
Sideways movement in a very small range fits the Elliott wave count. This correction is taking a little longer.
Summary: A triangle is coming to an end on the hourly chart. When it is done Gold should break out downwards to move at least to 1,172, and likely below that.
Click on charts to enlarge
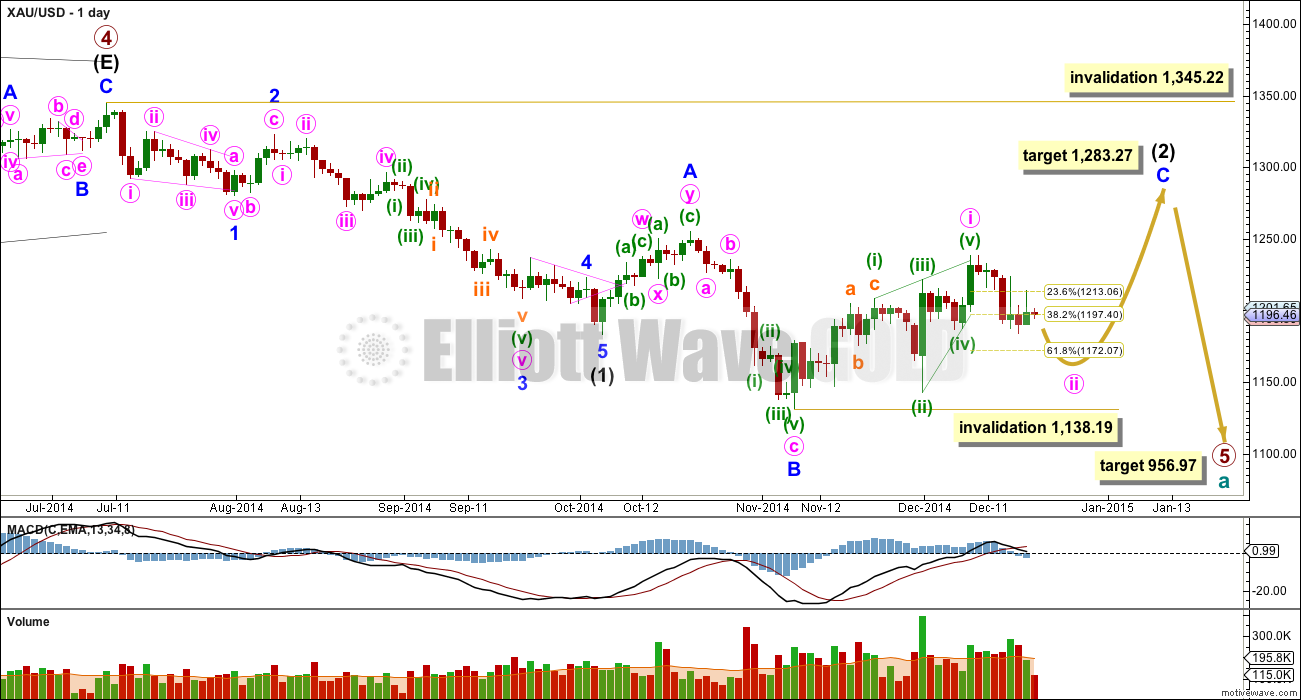
Primary wave 4 is complete and primary wave 5 is unfolding. Primary wave 5 may only subdivide as an impulse or an ending diagonal. So far it looks most likely to be an impulse.
Within primary wave 5 intermediate wave (1) fits perfectly as an impulse. There is perfect alternation within intermediate wave (1): minor wave 2 is a deep zigzag lasting a Fibonacci five days and minor wave 4 is a shallow triangle lasting a Fibonacci eight days, 1.618 the duration of minor wave 2. Minor wave 3 is 9.65 longer than 1.618 the length of minor wave 1, and minor wave 5 is just 0.51 short of 0.618 the length of minor wave 1. I am confident this movement is one complete impulse.
Intermediate wave (2) is an incomplete expanded flat correction. Within it minor wave A is a double zigzag. The downwards wave labelled minor wave B has a corrective count of seven and subdivides perfectly as a zigzag. Minor wave B is a 172% correction of minor wave A. This is longer than the maximum common length for a B wave within a flat correction at 138%, but within the allowable range of twice the length of minor wave A. Minor wave C may not exhibit a Fibonacci ratio to minor wave A, and I think the target for it to end would best be calculated at minute degree. At this stage I would expect intermediate wave (2) to end close to the 0.618 Fibonacci ratio of intermediate wave (1) at 1,283.27.
Intermediate wave (1) lasted a Fibonacci 13 weeks. If intermediate wave (2) exhibits a Fibonacci duration it may be 13 weeks to be even with intermediate wave (1). Intermediate wave (2) is now in its tenth week.
So far within minor wave C the highest volume is on two up days. This supports the idea that at this stage the trend remains up.
See the most recent Historic Analysis to see the long term channel about this whole downwards movement. The channel does not copy over to the daily chart when I put the daily chart on an arithmetic scale, so this channel must be drawn on a weekly chart on a semi log scale. The upper edge of that channel may be where intermediate wave (2) finally ends. I would not expect the upper edge of this channel to be breached.
The target for primary wave 5 at this stage remains the same. At 956.97 it would reach equality in length with primary wave 1. However, if this target is wrong it may be too low. When intermediate waves (1) through to (4) within it are complete I will calculate the target at intermediate degree and if it changes it may move upwards. This is because waves following triangles tend to be more brief and weak than otherwise expected. A perfect example is on this chart: minor wave 5 to end intermediate wave (1) was particularly short and brief after the triangle of minor wave 4.
Within minor wave C minute wave i subdivides perfectly as a leading contracting diagonal. When leading diagonals unfold in first wave positions they are normally followed by very deep second wave corrections. There is a nice example here on the daily chart: at the top left of the chart minor wave 1 was a leading contracting diagonal and it was followed by a deep 65% zigzag for minor wave 2. I will expect minute wave ii to be deep, at least to the 0.618 Fibonacci ratio at 1,172. When it is over then a third wave up should begin.
I do not think that minor wave C is complete at the high of 1,238 as an ending contracting diagonal for three reasons:
1. Intermediate wave (2) would be a very rare running flat correction.
2. Minor wave C would be substantially truncated, by $17.
3. This structure does not subdivide well as an ending diagonal because the third and fifth waves do not fit well as zigzags. Within an ending diagonal all the sub waves must be zigzags.
Minute wave ii may not move beyond the start of minute wave i below 1,138.19.
Intermediate wave (2) may not move beyond the start of intermediate wave (1) above 1,345.22. I have confidence this price point will not be passed because the structure of primary wave 5 is incomplete because downwards movement from the end of the triangle of primary wave 4 does not fit well as either a complete impulse nor an ending diagonal.
To see a prior example of an expanded flat correction for Gold on the daily chart, and an explanation of this structure, go here.
I do not want to publish a wave count which sees primary wave 5 complete at the low of 1,131. This downwards movement does not fit well at all as a complete five wave impulse. There would be inadequate alternation between the single zigzag of the second wave and the double zigzag of the fourth wave correction, and there would be no Fibonacci ratios between the first, third and fifth waves within it.
Main Wave Count
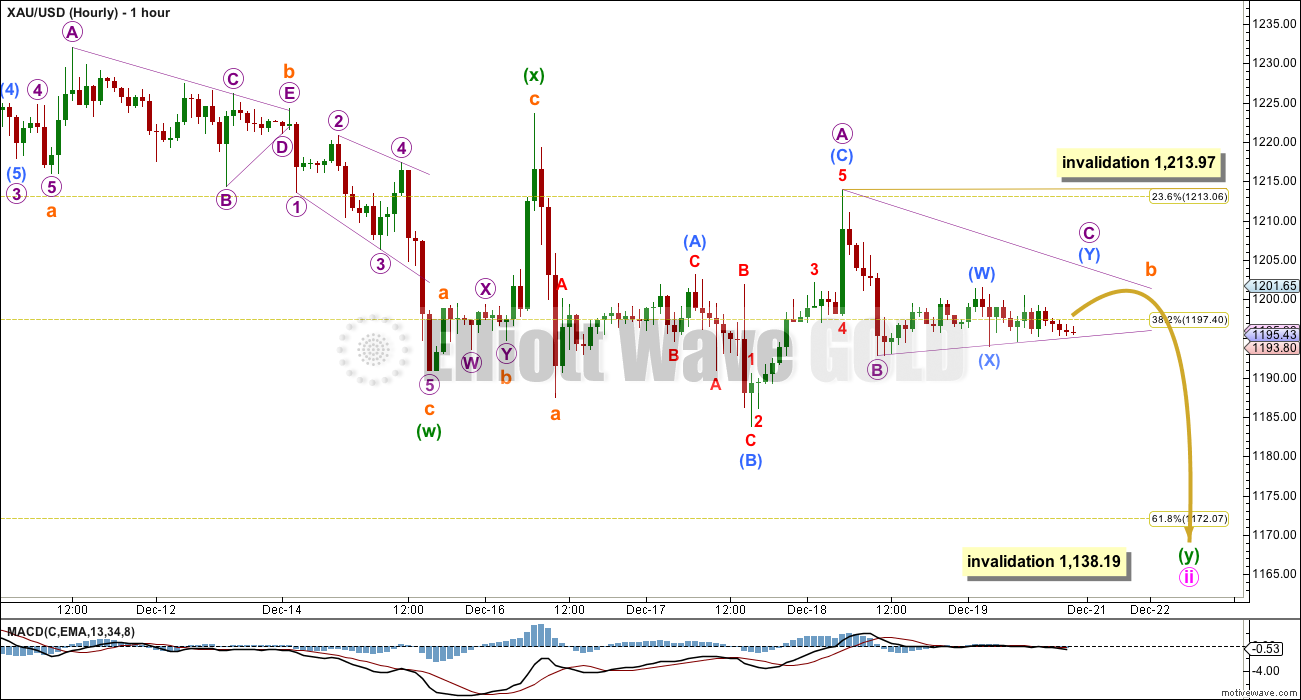
Minute wave ii may not exhibit a Fibonacci duration. It has now lasted eight days and is incomplete. It needs at least one more day of downwards movement before it is done.
Sideways movement over the last several hours looks like an unfolding triangle, which is supported by MACD hovering about the zero line while the sideways movement unfolds. The breakout should be a short sharp downwards thrust to complete minute wave ii if this main wave count is correct.
Within a triangle all the sub waves must be corrective structures, four of the five sub waves must be zigzags, and one sub wave may be more complicated and time consuming as a combination. So far micro wave A looks best as an expanded flat, micro wave B is a complete zigzag and micro wave C looks like an incomplete combination.
Micro wave C may not move above the end of micro wave A at 1,213.97. Micro wave D may not move beyond the end of micro wave B below 1,192.77. Micro wave E may not move beyond the end of micro wave C (wherever that ends up) and is most likely to fall short of the A-C trend line.
While the triangle completes the price range should narrow. If I have this triangle labelled correctly then at its end subminuette wave c should unfold in a five wave movement downwards.
Triangles are tricky structures. The part of this wave count I am confident of today is my labelling of subminuette wave a; I am confident it ends here and that on the five minute chart it subdivides as a five wave structure. This means I am confident that subminuette wave b may not move beyond the start of submineutte wave a above 1,223.57. However, my labelling of the triangle on this main hourly wave count could be wrong, and this is why I have an alternate for you today.
A new low below the end of micro wave B at 1,192.77 would most likely indicate that subminuette wave b is over and subminuette wave c downwards is underway.
Because I now don’t know where subminuette wave b has ended I cannot use the ratio between subminuette waves a and c to calculate a target for subminuette wave c to end for you. I would expect now that subminuette wave b should end lower that subminuette wave c may only reach equality in length with subminuette wave a at 36. It is most likely to take minute wave ii to at least the 0.618 Fibonacci ratio of minute wave i at 1,172, and very likely below that point.
Minute wave ii may not move beyond the start of minute wave i below 1,138.19.
When minute wave ii is finally over then a third wave up should begin next week.
Alternate Wave Count
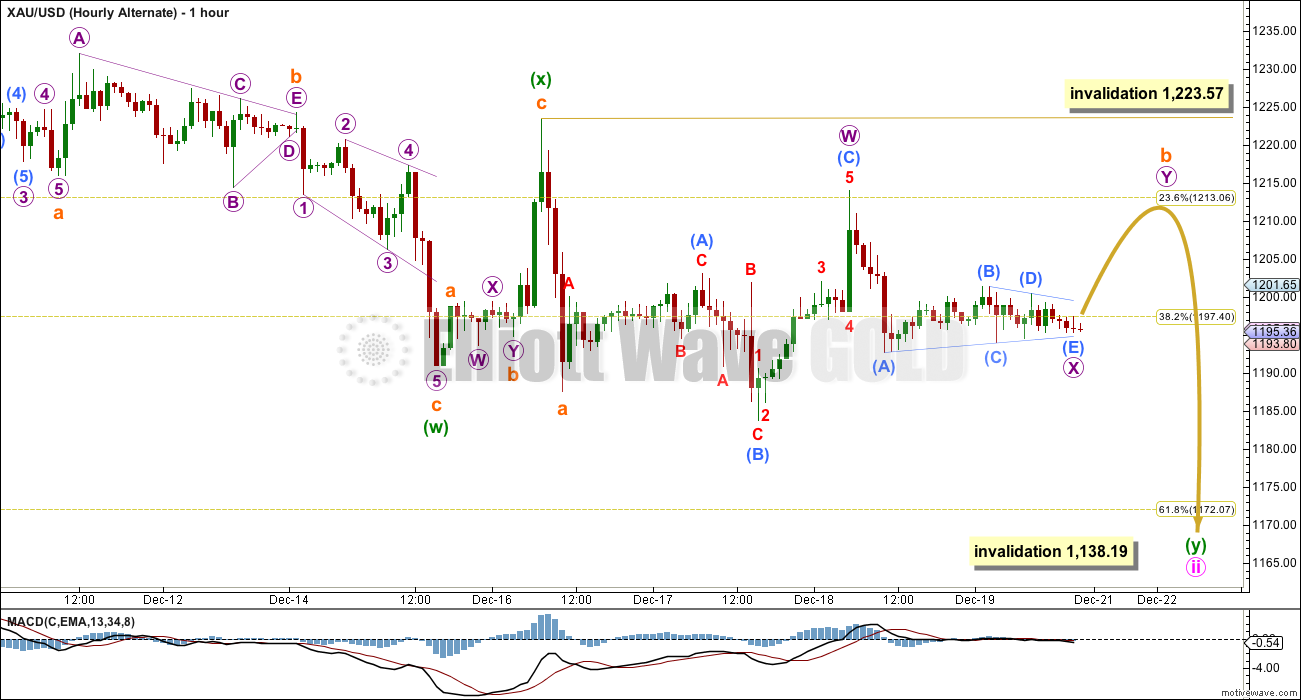
Here I am considering the possibility that instead of a triangle for subminuette wave b it may be that the triangle is an X wave joining the two structures in a double combination or double flat correction. The subdivisions are exactly the same so it is impossible to tell which hourly wave count is correct.
If the main hourly wave count is invalidated with a new high above 1,213.97 then I would expect upwards movement to end without breaching 1,223.57. Micro wave Y as the second structure in a double may be either a zigzag or a flat correction. When it is done then subminuette wave c downwards should unfold. Depending on how high subminuette wave b moves I would expect subminuette wave c to be either equal in length with subminuette wave a at 36, or 1.618 the length of subminuette wave a at 58.
If both hourly wave counts are invalidated with movement above 1,223.57 then both hourly wave counts are wrong. That would indicate that minute wave ii is over and a third wave up should then be underway.
This analysis is published about 3:44 p.m. EST.
Lara, there is only 1 hour until market close and gold has reached down to 1,172.75 and almost hit the 1,172 target, however the $36 length down to $1,162.19 may not be reached.
After the close today is minute wave iii heading up, or could this drop continue during market hours Tuesday?
I’m asking because I’m thinking about buying GDX for the wave iii trip up to 1,283. However perhaps gold may be weak due to holidays due to lower volume and might be cheaper miners the rest of the week or it has been suggested perhaps a big drop before 2015. Or this is the only significant drop this low in gold expected until 1,283. I’m looking for GDX of GDXJ ETF at Boxing Day prices, before gold hits 1,283.
I would expect downwards movement to be so very close to completion right now, and if the target is not met before markets close today that may be it.
The target may be too low.
Because minute wave ii is so so close to the 0.618 Fibonacci ratio its still deep, and the structure is so close to complete.
Richard, I’m looking at the five minute chart and I see a possible barrier triangle just over 15 minutes ago for a final fourth wave.
Barrier triangles are often followed by short fifth waves.
I think its over now, or very close indeed!
Could (ii) already be over at 1172.57?
Yes. It could.
Guess not…
I thought we’d get a retracement off of this main support level before heading lower.
4 wave is finish. Now we are in s wave of 5 last wave.
retracement and projection give proof
Some proof for me We are in 3 of 5 wave.
What is the target for 5th wave?
Robert, I have some big problems with that idea:
1. if your fifth wave begins there at 1,392.30 on 17th March then you must resolve how the prior fourth wave unfolds. That’s going to be rather difficult.
2. Within your chart your first wave (not labelled, shown with a red circle) subdivides as a zigzag. This movement quite simply does not fit as a five wave structure, so it cannot be a first wave.
3. the upwards movement of your fourth wave is similar in depth to the upwards movement of your second wave, and both are of the zigzag family. there is inadequate alternation.
$36 breakout down began at 10:35 am, bottom estimate is $1162.25 before bounce up towards $1,283. However When triangle is donw Gold subminuette wave c should break out with a short sharp downwards thrust in a five wave movement downwards to move at least to 1,172, and likely below that to complete minute wave ii. $36 in length below where subminuette wave b ends, which may have been at 1,198.25 minus $36 length of drop = $1,162.25 bottom estimate.
Yes, almost exactly.
Subminuette wave c began exactly at 1,198.24 in my data feed from FXCM.
1,198.24 – 36.05 = 1,162.19
Break out down began at 10:35 am Monday as a new low below 1,192.77 would most likely
indicate that subminuette wave b is over and subminuette wave c downwards is
underway and be $36 in length below where subminuette wave b ends.
Gold needs to cross 1183.70 Dec 17 low. LARA was thinking possibility of wave ii may be over;
Once the threshold of 1183.7 is breached yes it is wave c down to the target.
papudi
Lara said,
“A new low below 1,192.77 would most likely
indicate that subminuette wave b is over and subminuette wave c downwards is underway and be $36 in length below where subminuette wave b ends. It is most likely to take minute wave ii down to at least 1,172, and very likely below that point.”
Main Hourly wave count is being completed once the price drops below 1195???
b price point was 1203.5.
It was mentioned that the wave down to 1170 will happen on Monday or Tuesday.
Time closing in for wave ii completion.
Lara, you mention, “I do not want to publish a wave count which sees primary wave 5 complete at the low of 1,131.”
I believe you mean, at the November low of 1,138.19.
My data from FXCM has a low at 1,131.09 on 7th November, 2014.
Your data might be slightly different?
It shouldn’t be, but often different data feeds give slightly different data.
Lara,
Your charts have bottom invalidation at 1138.19.
I guess I thought that was the November low?
Yes, my bad. I don’t know what went wrong there, sorry Richard!
Lara any comment on why gold’s wave A of wave(2) and B of wave (2) were straight forward compared to many flats and zig zags in C of wave (2)?
Yet it is not finished.
It has turned out to be a very complex C .
I just checked C wave of US Oil back in March was complex also before oil started its impulse move down from 102+.
I hope to see same outcome for gold as oil when this complex C of wave (2) is finished.!!!!!!
Because its begun with a diagonal.
Diagonals have some corrective qualities. They have zigzags in their actionary waves and their second and fourth waves are very deep.
Minor waves A and B were pretty normal corrections. As they should be.
Happy Holidays Lara! I found your last paragraph odd suggesting there’s even a chance minute ii is complete. Do you have a wave count for it?
Happy Holidays to you too!
I included that because the invalidation point is close by and it always makes me a little nervous. I included it for a “what if I’m wrong” scenario.
No. I don’t have a wave count for it.
Sorry did not attach the chart. In edit chart can not be included.
Lara- From chart perspective ONCE gold breaks the red dotted line on the chart it is possible to get to price point of 1141.71 or one penny below it. High volume lows are always test with low volume and may be just one penny below it.
During this conso’d gold back tested the breakout line and dropped.
Invalidation is at 1130.40.
World traders will be all short thinking gold is going down and push the price down. It will be a huge bearish sentiment!!!!! at that price.
Confidence will be shaken in any opposite view big time!!!!
so much bearishness on gold these days, though it has held its ground for the most part. with the predicted fall. what the heck could bring about serious 3,3,3 waves up? Only thing I can think of is a major shock in the currency markets, beyond what’s already been digested the last week. for what we’ve seen with gold, I presume it could only be something like Russia going with a gold standard demanding that for their trading partners in collateral. I can’t see any other reason to be long here. Any other ideas why gold would jump from here?
Not that I can think of it. Plus Gold is staying flat in a narrow range even USD is moving higher. Strange!! It should be down.
Which shows that these relationships are fluid, and cannot always be relied upon.
Pjay
People may think it is the news events that moves gold but sentiment makes it’s own news events and Gold tracks sentiment. Sentiment is the leader not the news, which reacts to sentiment. However the media comes up with it’s belief in what made gold move and they are incorrect.