
Upwards movement was expected.
Summary: Upwards movement should continue overall to end at least slightly above 1,255.40, but the maroon channel from the weekly chart should not be breached. Upwards movement may end at the end of next week.
Click on charts to enlarge
Weekly Chart
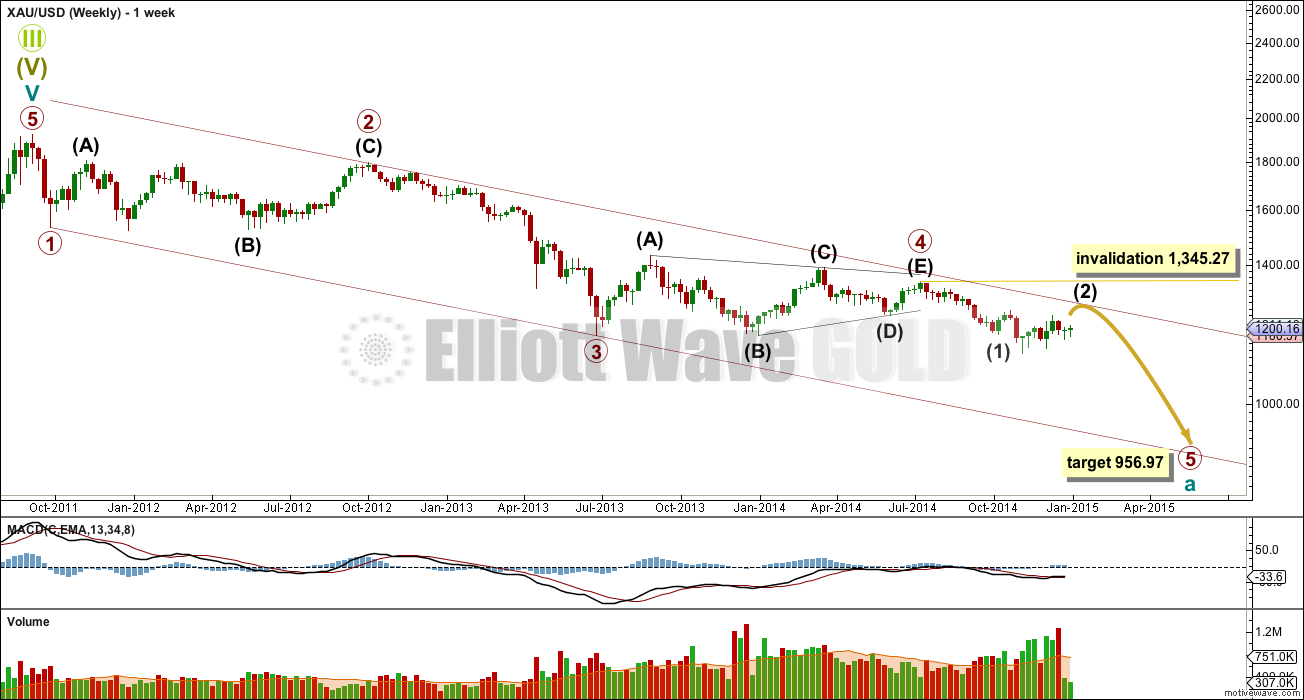
So far since the all time high at 1,921.15 in September 2011 Gold has moved lower in four waves. The final fifth wave down is underway.
Primary wave 3 is $12.54 short of 1.618 the length of primary wave 1. At 956.97 primary wave 5 would reach equality in length with primary wave 1. This is the most likely relationship between first and fifth waves, so this target has the highest probability.
Primary wave 2 was a deep 68% rare running flat correction. Primary wave 4 shows alternation in depth and structure with a shallow 27% regular contracting triangle.
With weekly and daily charts on a semi-log scale, draw a trend channel about this downwards impulse on the weekly chart and copy it over to the daily chart: draw the first trend line from the lows of primary waves 1 to 3, then place a parallel copy on the high of primary wave 2. I would expect downwards movement for primary wave 5 to find support, and maybe end, at the lower trend line. Alternatively, we may see a strong fifth wave typical of commodities and the lower trend line could be breached by strong downwards movement.
Primary wave 1 lasted 3 weeks, primary wave 2 lasted 53 weeks (two short of a Fibonacci 55), primary wave 3 lasted 37 weeks (three longer than a Fibonacci 34) and primary wave 4 lasted 54 weeks (one short of a Fibonacci 55). So far primary wave 5 has lasted 25 weeks. At this stage it may end with a total Fibonacci 34 or more likely 55 weeks (give or take one to two weeks either side of these numbers).
Main Wave Count
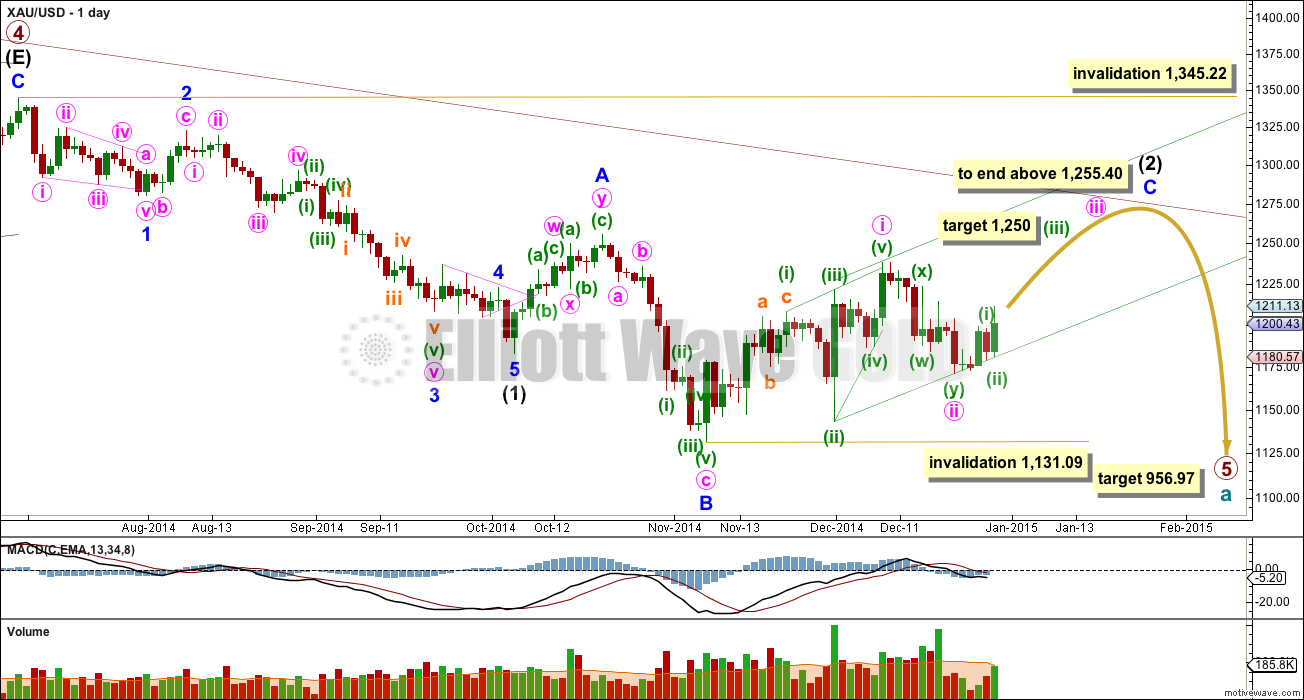
Primary wave 4 is complete and primary wave 5 is unfolding. Primary wave 5 may only subdivide as an impulse or an ending diagonal. So far it looks most likely to be an impulse.
Within primary wave 5 intermediate wave (1) fits perfectly as an impulse. There is perfect alternation within intermediate wave (1): minor wave 2 is a deep zigzag lasting a Fibonacci five days and minor wave 4 is a shallow triangle lasting a Fibonacci eight days, 1.618 the duration of minor wave 2. Minor wave 3 is 9.65 longer than 1.618 the length of minor wave 1, and minor wave 5 is just 0.51 short of 0.618 the length of minor wave 1. I am confident this movement is one complete impulse.
Intermediate wave (2) is an incomplete expanded flat correction. Within it minor wave A is a double zigzag. The downwards wave labelled minor wave B has a corrective count of seven and subdivides perfectly as a zigzag. Minor wave B is a 172% correction of minor wave A. This is longer than the maximum common length for a B wave within a flat correction at 138%, but within the allowable range of twice the length of minor wave A. Minor wave C may not exhibit a Fibonacci ratio to minor wave A, and I think the target for it to end would best be calculated at minute degree. Minor wave C is extremely likely to move at least slightly above the end of minor wave A at 1,255.40 to avoid a truncation and a very rare running flat correction. It may end when price touches the upper edge of the maroon channel, copied over here from the weekly chart.
I am removing the Fibonacci retracement from intermediate wave (1) today, and restoring the daily chart to a semi-log scale. The maroon channel may be a more reliable guide to where upwards movement may end in this case than a Fibonacci retracement. When minute waves iii and iv within minor wave C are complete I will calculate a target at minute degree, and only if it sees price end at the maroon channel will I use it.
Intermediate wave (1) lasted a Fibonacci 13 weeks. If intermediate wave (2) exhibits a Fibonacci duration it may be 13 weeks to be even with intermediate wave (1). Intermediate wave (2) is beginning its twelfth week. If it continues for one more week it may have an even duration with intermediate wave (1). It may be able to do this, but at this stage for the main wave count it is looking like it might need a little longer.
So far within minor wave C the highest volume is on three up days. This supports the idea that at this stage the trend remains up.
Within minor wave C minute wave i subdivides perfectly as a leading contracting diagonal. When leading diagonals unfold in first wave positions they are normally followed by very deep second wave corrections. There is a nice example here on the daily chart: at the top left of the chart minor wave 1 was a leading contracting diagonal and it was followed by a deep 65% zigzag for minor wave 2. Minute wave ii is now deep, just below the 0.618 Fibonacci ratio of minute wave i. Minute wave iii has most likely now begun.
I do not think that minor wave C is complete at the high of 1,238 as an ending contracting diagonal for three reasons:
1. Intermediate wave (2) would be a very rare running flat correction.
2. Minor wave C would be substantially truncated, by $17.
3. This structure does not subdivide well as an ending diagonal because the third and fifth waves do not fit well as zigzags. Within an ending diagonal all the sub waves must be zigzags.
Minute wave ii may not move beyond the start of minute wave i below 1,131.09.
Intermediate wave (2) may not move beyond the start of intermediate wave (1) above 1,345.22. I have confidence this price point will not be passed because the structure of primary wave 5 is incomplete because downwards movement from the end of the triangle of primary wave 4 does not fit well as either a complete impulse nor an ending diagonal.
To see a prior example of an expanded flat correction for Gold on the daily chart, and an explanation of this structure, go here.
I do not want to publish a wave count which sees primary wave 5 complete at the low of 1,131.09. This downwards movement does not fit well at all as a complete five wave impulse. There would be inadequate alternation between the single zigzag of the second wave and the double zigzag of the fourth wave correction, and there would be no Fibonacci ratios between the first, third and fifth waves within it.
If this main wave count is correct it should prove itself in the next 24 hours, otherwise the new alternate below would be preferred. At this stage I would judge them to have a close to even probability.
Minute wave iii may not exhibit a Fibonacci ratio to minute wave i; were it to only reach equality price would breach the maroon channel on the daily chart. A target for minute wave iii to end would be better calculated at minuette wave degree and I cannot do that yet for you. When minuette waves (iii) and (iv) are complete I will then calculate a target again for minute wave iii to end.
This main wave count looks at minor wave C unfolding as an impulse. Within it minute waves i and ii are complete and shown on the daily chart. Minute wave iii has begun.
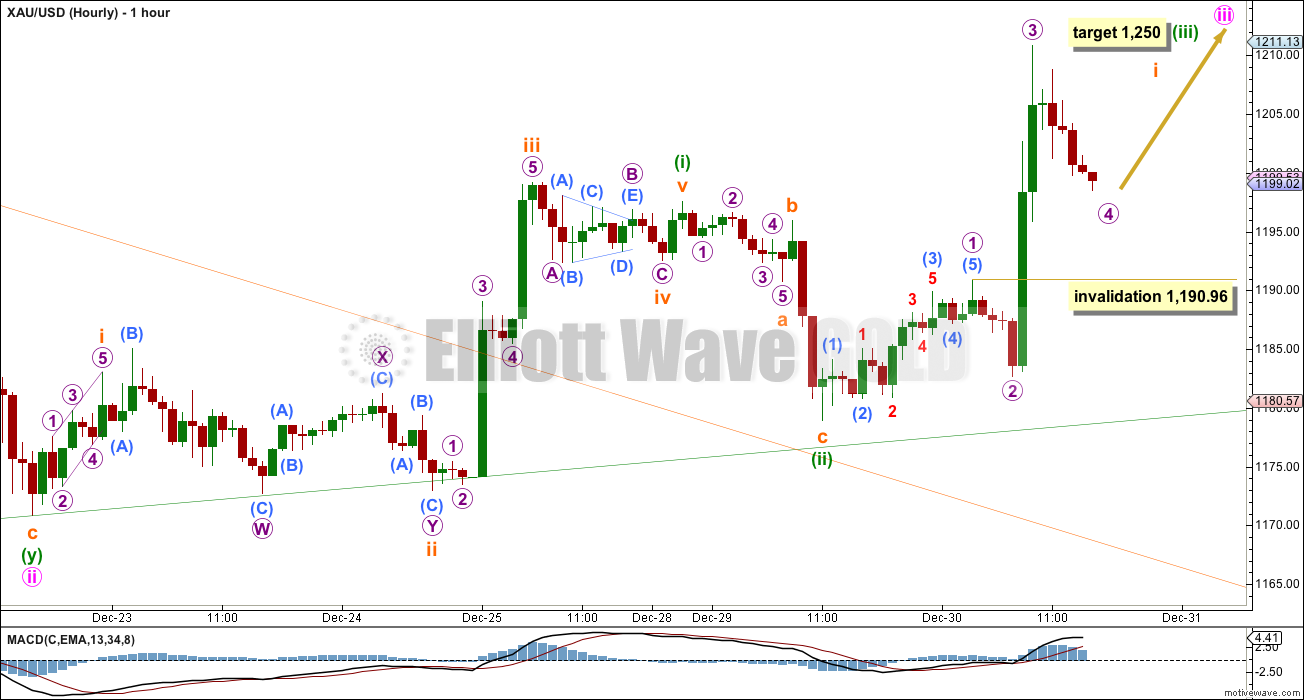
Minute wave iii may only subdivide as a simple impulse. It should show stronger upwards momentum than minute wave i. This wave count needs to prove itself with a very strong increase in upwards momentum; if this is not seen I will relegate it to an alternate.
Because momentum within the middle of minute wave iii has not increased beyond that seen for minute wave i I do not think the middle of the third wave has yet passed, if this wave count is correct. Within minuette wave (iii) subminuette wave i is incomplete. It should subdivide as an impulse, and that is what looks like it is unfolding as. Within this impulse micro wave 4 may not move into micro wave 1 price territory below 1,190.96.
If price remains above 1,190.96 and makes a new high, then subminuette wave i would be complete. At that stage the invalidation point for this main wave count would move down to the start of subminuette wave i at 1,178.95 and another second wave correction should unfold.
Draw the green best fit channel on the daily chart as shown and copy it over to the hourly chart. I would expect downwards corrections to continue to find support at the lower green trend line along the way up.
Alternate Wave Count
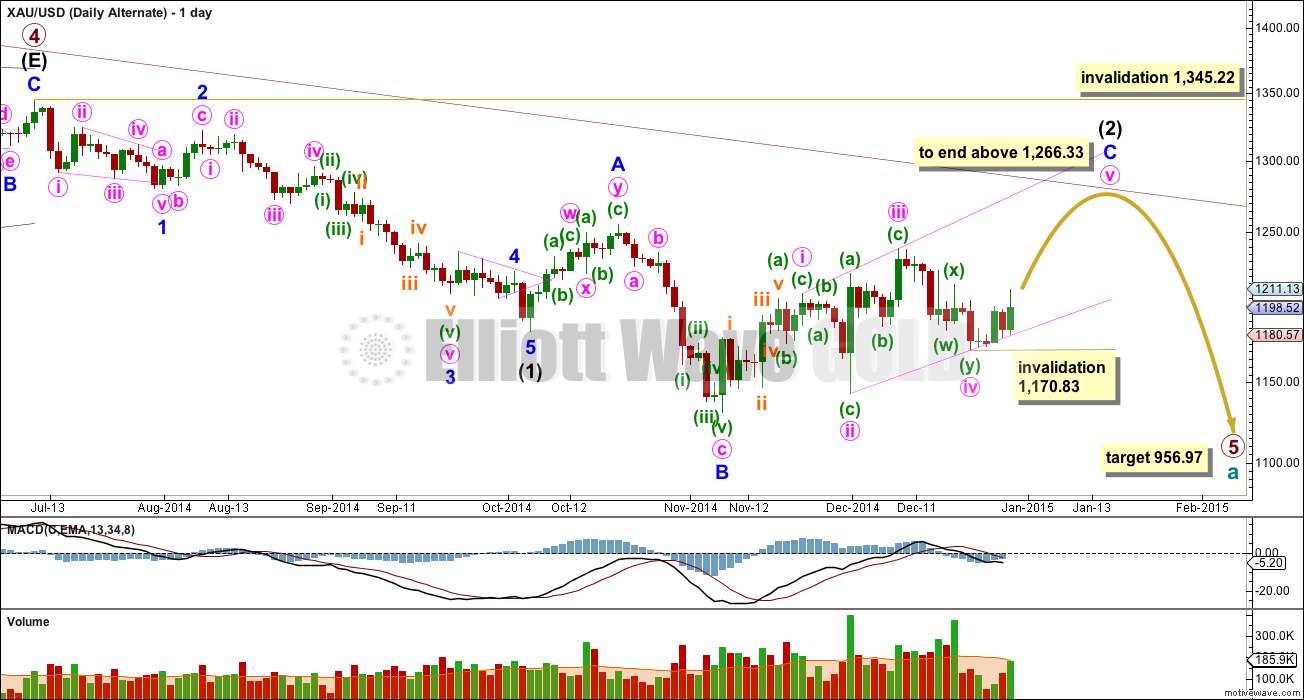
Minor wave C must subdivide as a five wave structure. The main wave count considers the more common impulse, and this alternate wave count considers the other possible structure for minor wave C, that of an ending diagonal.
Within an ending diagonal all the sub waves must subdivide as zigzags. Here I am seeing minute wave iv as a double zigzag, allowing for an interpretation of the rules outlined in Frost and Prechter which state that double and triple zigzags may take the place of single zigzags.
This diagonal would be expanding: minute wave iii is longer than minute wave i, and minute wave iv is longer than minute wave ii. The trend lines are slightly diverging. Minute wave v should be longer than equality with minute wave i which would be achieved at 1,266.33. This would also see minor wave C end above the end of minor wave A at 1,255.40 avoiding a truncation and a very rare running flat. It is possible for this alternate wave count that the final upwards wave could now be completed by the end of next week, and intermediate wave (2) could end in a total Fibonacci 13 weeks, even in duration with intermediate wave (1).
Minute wave iii shows stronger momentum than minute wave i, and minute wave v may show divergence with weaker momentum than minute wave iii as it makes new highs.
Within the final zigzag of minute wave v no second wave correction nor B wave may move beyond its start below 1,170.83.
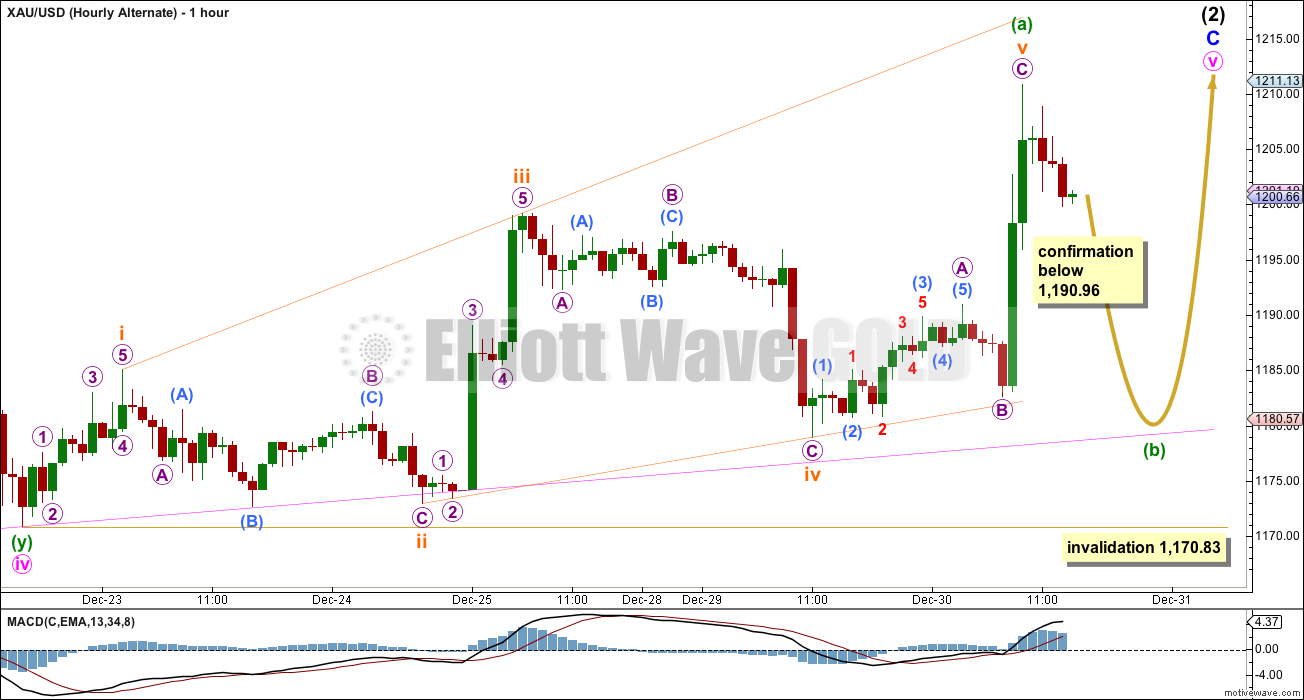
Within minute wave v zigzag minuette wave (a) may be a complete five wave structure as a leading expanding diagonal. Minuette wave b should find strong support at the lower ii-iv pink trend line, copied over here from the daily chart.
This alternate would be confirmed with a new low below 1,190.96.
Minuette wave (b) must subdivide as a corrective structure. Thereafter, minuette wave (c) upwards must subdivide as a five wave structure. If my labelling of minuette wave (a) as a diagonal is correct then minuette wave (c) would most likely be an impulse to show alternation with minuette wave (a).
Minuette wave (b) may not move beyond the start of minuette wave (a) below 1,170.83.
I have checked all subdivisions for this wave count very carefully on the five minute chart. It all fits. This wave count nicely explains all the choppy overlapping movement of the last eight weeks, and it fits perfectly so far with momentum.
This analysis is published about 4:18 p.m. EST.
Recently some excellent comments re trendlines by the members. Wish a happy and prosperous year to you all.
If gold breaks pink line 1180 what will be the next move? The invalidation 1170 still holds.
As long as $1183 hold it looks like a corrective structure
Yes, I agree. Diagonals always fit within their trend lines almost perfectly. This is important. I expect this line to provide strong support and initiate the start of the next wave up.
Lara when I read this comment by you today.
That was a game changer, I made sure I topped up on GDX for a low price before the close today.
Let this wave of the rally continue on up from it’s starting point at 1179.79 at 2:05 pm today
I’m breaking out the bubbly. Cheers.
Lara gave this guide: Minuette wave (b) must subdivide as a corrective structure.
Has wave b met this sub?
Yes. I can see a clear three on the hourly chart. The subdivisions fit on the five minute chart.
Alternate hour wave is confirmed
No. There is no minimum depth for minuettte wave (b).
It is highly likely to get back down to that pink ii-iv trend line though, and it looks like that’s what it’s done.
One question…..if primary wave 5 is unfolding, the trend line drawn from primary wave 2 and primary wave 4, should not be breached, is it correct ?
In the weekly chart this level is about a 1224.
Once completed primary wave 4, dont we should drawn again the channel from primary 2 and primary 4 ?
Thanks
I think top line from wave 2 is drawn as parallel to the bottom line drawn connecting wave 1 and 3.
You don’t need to redraw the channel, you only need to use whichever technique fits best. If the fourth wave remains contained within the channel then its best to leave it alone.
I have the price point on my weekly chart for intermediate wave (2) to touch the channel about 1,266. On the daily chart I have it about 1,280. There will be variation, depending on how steep the last wave up will be.
From chart perspective it is a head and shoulder pattern. This pattern pretty reliable.
At turning pts. notation are EW waves.
Break out to upside expected this week or early next week.
Interesting alternate! Are you suggesting c of v is going to be an extremely large wave? Let’s say b ends at $1185ish, c must be $80+ to get to $1266.
Yes.
Either that, or (a) is incomplete and I should be moving the degree of labelling within it down one degree.
5-3-5-3-3 is Acceptable subdivisions for leading expanding diagonal? This is how you have it labeled
Yes. There is nothing in Frost and Prechter which states that if one actionary wave of a leading diagonal is an impulse, then all must be impulses. It only states “waves 1, 3 and 5 of a leading diagonal usually subdivide into zigzags but sometimes appear to be impulses” – page 88.
I have noticed that if one of the actionary waves is to be an impulse, its often the third wave. In this case I checked the subdivisions of the first wave on the five minute chart and concluded it was more likely an impulse, but I guess it could also be a zigzag. That one is a bit ambiguous.