
The alternate Elliott wave count was confirmed with a new low below 1,190.96. The main Elliott wave count was invalidated, and will now be discarded.
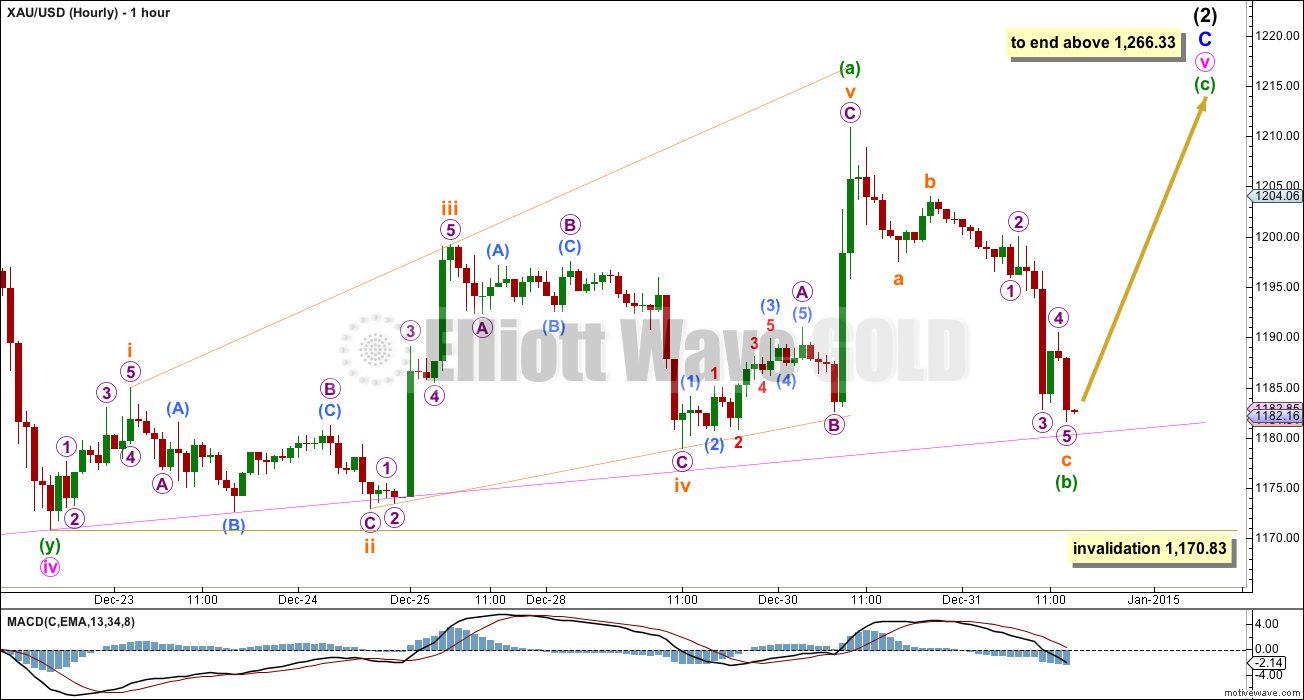
Summary: Downwards movement continues to find support at the pink ii-iv trend line. An upwards wave should begin from here. The target for upwards movement to end is at least 1,266.33.
Click on charts to enlarge

Primary wave 4 is complete and primary wave 5 is unfolding. Primary wave 5 may only subdivide as an impulse or an ending diagonal. So far it looks most likely to be an impulse.
Within primary wave 5 intermediate wave (1) fits perfectly as an impulse. There is perfect alternation within intermediate wave (1): minor wave 2 is a deep zigzag lasting a Fibonacci five days and minor wave 4 is a shallow triangle lasting a Fibonacci eight days, 1.618 the duration of minor wave 2. Minor wave 3 is 9.65 longer than 1.618 the length of minor wave 1, and minor wave 5 is just 0.51 short of 0.618 the length of minor wave 1. I am confident this movement is one complete impulse.
Intermediate wave (2) is an incomplete expanded flat correction. Within it minor wave A is a double zigzag. The downwards wave labelled minor wave B has a corrective count of seven and subdivides perfectly as a zigzag. Minor wave B is a 172% correction of minor wave A. This is longer than the maximum common length for a B wave within a flat correction at 138%, but within the allowable range of twice the length of minor wave A. Minor wave C may not exhibit a Fibonacci ratio to minor wave A. Minor wave C is extremely likely to move at least slightly above the end of minor wave A at 1,255.40 to avoid a truncation and a very rare running flat correction. It may end when price touches the upper edge of the maroon channel, copied over here from the weekly chart. To see how to draw this channel click here.
To see a prior example of an expanded flat correction for Gold on the daily chart, and an explanation of this structure, click here.
Intermediate wave (1) lasted a Fibonacci 13 weeks. If intermediate wave (2) exhibits a Fibonacci duration it may be 13 weeks to be even with intermediate wave (1). Intermediate wave (2) is ending its twelfth week. If it continues for one more week it may have an even duration with intermediate wave (1). This may be possible, or it may need a little longer.
So far within minor wave C the highest volume is on three up days. This supports the idea that at this stage the trend remains up.
Minor wave C may be either an impulse or an ending diagonal. At this stage an impulse looks very unlikely because there is too much overlapping. An ending diagonal looks more likely, and it may be now within the final fifth wave.
Within an ending diagonal all the sub waves must subdivide as zigzags. Here I am seeing minute wave iv as a double zigzag, allowing for an interpretation of the rules outlined in Frost and Prechter which state that double and triple zigzags may take the place of single zigzags.
This diagonal would be expanding: minute wave iii is longer than minute wave i, and minute wave iv is longer than minute wave ii. The trend lines are slightly diverging. Minute wave v should be longer than equality with minute wave iii which would be achieved at 1,266.33. This would also see minor wave C end above the end of minor wave A at 1,255.40 avoiding a truncation and a very rare running flat.
Within the final zigzag of minute wave v no second wave correction nor B wave may move beyond its start below 1,170.83. Downwards movement should find strong support at the lower ii-iv trend line of the diagonal, because diagonals always fit well within their trend lines.
Intermediate wave (2) may not move beyond the start of intermediate wave (1) above 1,345.22. I have confidence this price point will not be passed because the structure of primary wave 5 is incomplete because downwards movement from the end of the triangle of primary wave 4 does not fit well as either a complete impulse nor an ending diagonal. If it is seen as a complete impulse there would be inadequate alternation between the single zigzag of the second wave and the double zigzag of the fourth wave correction, and there would be no Fibonacci ratios between the first, third and fifth waves within it.
The final wave up of this ending diagonal for minute wave v must subdivide as a zigzag, subdividing 5-3-5. Within it minuette wave (a) may be complete, or this may be moved down one degree and may only be subminuette wave i within minuette wave (a). At this stage it makes no difference to the invalidation point or expected direction. I may move the degree of labelling or publish a different degree as an alternate if this idea does begin to diverge. For now I will keep the charts to the minimum.
Minuette wave (b) now subdivides as a complete zigzag. Within it subminuette wave c is just 0.83 longer than 1.618 the length of subminuette wave a. On the five minute chart the structure is either complete here, or may end with on final very small new low to complete the final fifth wave down within micro wave 5. If it does that it should find strong support at the pink ii-iv trend line, with only a small intra-hour overshoot acceptable (like that seen previously for the end of subminuette wave ii).
If minuette wave (b) ends here and minuette wave (c) begins here, then if minuette wave (c) were to only be 1.618 the length of minuette wave (a) minor wave C would end at 1,246. It would be truncated and the fifth wave of the diagonal would be shorter than the third. This target does not work. If minuette wave (c) were to reach 2.618 the length of minuette wave (a) minor wave C would end at 1,286 which would probably overshoot the maroon channel on the daily and weekly charts. This is very unlikely.
Minuette waves (a) and (c) may not exhibit a Fibonacci ratio to each other, which is somewhat common. The target may be best calculated at subminuette wave degree, or in this instance the maroon channel on the daily chart may be a better measure of where upwards movement may end than a price target.
Minuette wave (b) may not move beyond the start of minuette wave (a) below 1,170.83.
This analysis is published about 3:42 p.m. EST.
IMO Lara will find a way to relabel this so that we still have a target above 1255. I note from Frost & Prechter, 10-th edition, pg 49 regarding running flats “never label a correction prematurely this way , or you’ll find yourself wrong nine times out of ten.” The issue is not the truncation but the running flat that the truncation implies.
Good information for this EW novice.
You’re right. I’m seeing this downwards spike as a continuation of minute wave iv.
The invalidation point moves down to 1,142.88.
Minute wave iv is now a single zigzag, rather than a double. Which is nicer for the wave count. Its also now quite obviously bigger than minute ii so on the daily chart the whole thing has a more typical look.
This sucks, I hate being wrong, and I know its very frustrating for members. I’m considering what else I may have wrong, and looking at alternates. I keep coming to the same conclusion, it has to go up to at least 1,255.40. Upwards movement is not done.
No problems. Still good in the bigger timeframe. Time is fractal, but the shorter the timeframe, the greater the noise. Some ppl thrive on scalp trading but it drives me krazy.
Wish a happy & prosperous new year to all !!
so much for clean waves in gold…Lara has her hands full today
Chapstick–what do you say is happening?
Very tough to say and I wish I knew the answer. All rallies seem to be quickly sold so I would not be long here despite the EW count. This is purely from a price action standpoint and excluding any wave analysis. From a wave standpoint, it’s possible int 2 ended as a running flat. The problem is I would’ve expected a third of a third to show more downwards momentum by now
Of any wave the 1130 invalidation has remained.
The new invalidation my guess will be 1441.
Do you know what is the confirmation of wave b completion?
Boom come on baby!
I would now expect Gold to bet at or below 1000 in about 3 weeks time, should be a rather rapid decline
Draw a trendline below the last two major lows in this uptrend (Nov 7 and Dec 1). That seems like a reasonable area for gold to find support.
Daily and hourly charts both invalidated now 8:20 am below 1,170.83
Gold broke below the daily triangle. If stays here all long be out. Gold is going lower. Unless by end of the day gold moves higher than 1210 or get back in the triangle.
This wave invalidated. Like Chapstick was saying.
1,170.83 bottom trendline has just been breached below at 8:20 am down to 1168
Now pink line is resistance. During COMEX hour hope it gets breached today. Gold needs to be higher than 1200 by close today!!!!
papudi
When is COMEX hour and what do you expect to happen then?
COMEX starts around 8:15 AM. Since gold dropped before opening I think gold will be taken higher. I am waiting to see if 1180 is breached in nano second.
Intra-hour overshoot of the bottom pink trend line happened at 6:14 am January 2nd, when gold hit low of 1,180.67 for 2 minutes.
Watch video from 7:00 mark to the end to explain to watch for and it is OK if gold touches the bottom pink trend line or a very small intra-hour overshoot to end the (b) wave and that should initiate the start of the (c) wave up.
This wave count looks like it’s going to get blown up real quick. If it was correct, a third wave should have started. It should not be hanging around the pink trend line. This all reminds me of the 9 nine wave triangle 6 months ago. Lara kept saying the bottom triangle trendline should provide very strong support. Instead it kept hanging around the trendline and eventually broke down. The USD continues to skyrocket which is such a headwind for gold. They both can rise together, but the USD is going higher everyday.
I agree with you. Gold is hanging around bottom toooo long. That is my concern.
Lara’s concern is to avoid truncation. But truncation has happend before.
Now just one week to go for the final wave is concerning.
there it goes!
The pink line appears to be below 1180 on hour chart. Gold got to only 1180.67 and backed off.
Hi Lara…Happy New Year…hope you’re on board to catch a big wave this year (pun intended)…
So if I’m reading you right….violation of the ii-iv trendline (currently @ 1182) would negate this entire count…is that correct?….and would that be a one tick violation?….or a one minute close?…or an hourly close?…either way – nice risk/reward….risk $2 for potential $50 upside???
Ted see my comment above about trendline and also video from 7:00 to the end.
Hi Lara,
1st off, Happy New Year!
Just re reading the Gold Update and was wondering, what is the ALT found we should be on the lookout for now?
Thanks!
There will be no alt as gold is doing exactly what it needed to do when futures opened nearly 2 hrs ago. IMO, we should be in iii of (a). i of (a) was a leading diagonal with a perfect 78.6% retrace for ii of (a) which is extremely common following a leading diagonal.
Chapstick, where will iii of (a) end?
wave iii = 1.618 * wave i = $1244ish which is the most common ratio for third waves.
Chapstick, I appreciate your comments.
What will prove this is an (a) or (c) ? I would hate to be holding for 1266 and have the floor fall out from under me at 1244ish.
We could easily gap at the open right below 1170 at the open, that would be your ALT. Risky place to be long IMO, even by Lara’s count, we are on the cusp of a wave 3 down
Where in the text above Lara wrote on the cusp of wave 3 down?
Please help!!!
Above Lara wrote: “On the five minute chart the structure is either complete here, or may
end with on final very small new low to complete the final fifth wave
down within micro wave 5”.
Today Gold did not violate 1179.79 low of Dec 31and is at 1186 now(11PM).
Yes day is not over yet.
At what price point wave b is considered complete?
See my comment above about bottom trendline and start of (c) wave up.
Happy New Year, Lara.
Great asset for me last year is knowing of you your website here, and learning from you how to mastering and applying the Elliott wave theory.It really works. Thankfully.
I saw Lara’s comment today about the pink trend line at 1,180 as a strong support expecting it to hold and from where the new wave would start from. That made my day after the long forecast yesterday.
I had already bought some GDX at it’s day low today and I made sure to load up on more GDX and got more cheap in the last minute of the close. Now I can benefit from this 2 week short term rally without the stress of 3X ETF’s. Now to take profits on some shorter rallies along the way before gold changes direction for a day or so. No more waiting for a jackpot in two weeks. Now I get the profits off the table when they are being offered to me. Then plan another swing trade. Hey, multiple jackpots are possible.
I’m breaking out the Champagne, can’t wait until midnight.
Cheers to Lara, and a very prosperous New Years filled with Lara’s highly accurate forecasts and a joyful, wealthy abundance of our well planned and executed profitable trades. Reaping the cash harvest of our investing time and effort. Cha-Ching $$$,$$$.$$
Happy New Year to every one.
Great trade on GDX. I plan to add on Friday morning when COMEX boyz take gold down for final time before next week super rally.
This corrective wave has been full of stress for me.
Finally it is ending next week. That is some thing to look forward to.
Lara, would you agree $1267 must be met by end of next week to avoid breach of maroon channel? It’s do or die time for this entire wave count. If correct, this suggests $15/day avg of upwards movement for the next 6 trading sessions. Happy new year!
That is scary for Longs!!!!
Actually, I disagree.
This is why.
I draw the trend line on my daily chart on a semi log scale. I move the label for intermediate (2) to where it would end right on the trend line, pulling it as far to the right as I can while it stays above 1,266.33. So far I’ve got it at 1,269.95 and thats three weeks away.
If my explanation of how I’m doing this makes no sense I’ll do a quick video to show you.
I’m not sure about my degree of labelling so far within minute v, but I am sure it has to move higher. If my wave count is correct, that is.
Thanks, that’s good to know. I was only eyeballing it so I trust the software. January is seasonally strong for gold so maybe it takes about 2 weeks to complete. As far as your degree of labeling, I think you will end up changing it to subminuette i-ii of minuette (a) as complete. I would prefer to see minuette (b) end somewhere in the middle of the trendlines to have a better look.
Lara
Your comment above, “at 1,269.95 and that’s three weeks away.”
So that may be where and when Gold peaks?
That’s different than “one more week or a little longer” ?
Yes.
I’ll show you how I’m doing this today in the video.
If its going to have a Fibonacci ratio in time to intermediate (2) then it should end in just one more week.
But it doesn’t have to exhibit a Fibonacci ratio in time. It could continue for three weeks and still make the target while not breaching the channel.
Happy New Year, Lara and everyone !!
Tho the second half of this decade may be epic, and not in a good way, sigh.
The 2nd half or this decade is already Epic, in the Best possible way in my Perception, in my Intentions, In my focus and belief and reality NOW. We get what we focus on!
Lara, great for you to get this out before NYSE close, in the future even just the summary without text or video is great when time permits.
Wishing you and yours the best for 2015 – health, happiness and excellent waves.