
Both the main and alternate hourly Elliott wave counts remain valid. Both expected Monday to begin with upwards movement which has happened. The confirmation / invalidation point to the downside can now be raised.
Summary: If the main wave count is correct it should be confirmed within a very few hours with a new high above 1,213.45. The short term target is at 1,235. Alternatively, a new low below 1,191.36 would indicate one more downwards spike to 1,168 – 1,172 before the third wave up begins.
Click on charts to enlarge
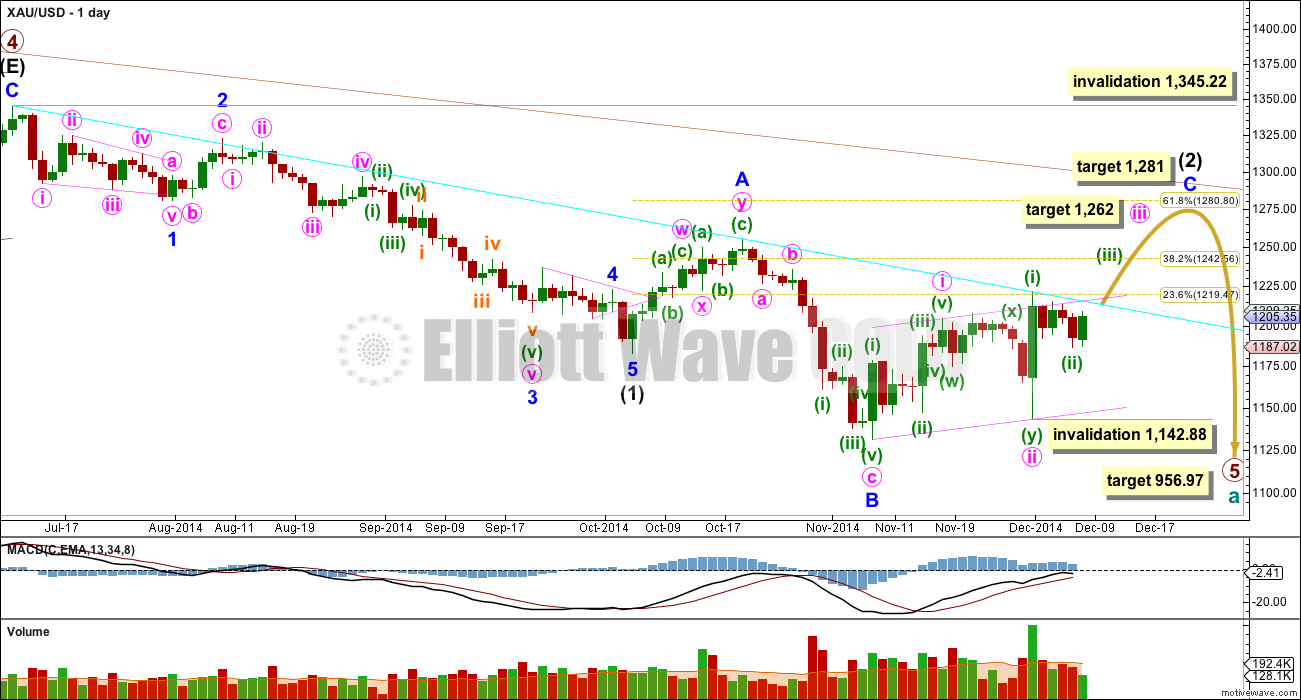
Primary wave 4 is complete and primary wave 5 is unfolding. Primary wave 5 may only subdivide as an impulse or an ending diagonal. So far it looks most likely to be an impulse.
Within primary wave 5 intermediate wave (1) fits perfectly as an impulse. There is perfect alternation within intermediate wave (1): minor wave 2 is a deep zigzag lasting a Fibonacci five days and minor wave 4 is a shallow triangle lasting a Fibonacci eight days, 1.618 the duration of minor wave 2. Minor wave 3 is 9.65 longer than 1.618 the length of minor wave 1, and minor wave 5 is just 0.51 short of 0.618 the length of minor wave 1. I am confident this movement is one complete impulse.
Intermediate wave (2) is an incomplete expanded flat correction. Within it minor wave A is a double zigzag. The downwards wave labelled minor wave B has a corrective count of seven and subdivides perfectly as a zigzag. Minor wave B is a 172% correction of minor wave A. This is longer than the maximum common length for a B wave within a flat correction at 138%, but within the allowable range of twice the length of minor wave A. Minor wave C may not exhibit a Fibonacci ratio to minor wave A, and I think the target for it to end would best be calculated at minute degree. At this stage I would expect intermediate wave (2) to end close to the 0.618 Fibonacci ratio of intermediate wave (1) just below 1,281.
Intermediate wave (1) lasted a Fibonacci 13 weeks. If intermediate wave (2) exhibits a Fibonacci duration it may be 13 weeks to be even with intermediate wave (1). Intermediate wave (2) has just begun its ninth week, and so it may continue now for another five weeks in total.
So far within minor wave C the highest volume is on an up day. This supports the idea that at this stage the trend is up.
The upper maroon trend line is the upper edge of the Elliott channel drawn about this impulse on the weekly chart, and copied over here to the daily chart. See the most recent Gold Historic Analysis to see how this trend line is drawn on the weekly chart. If minor wave C lasts long enough it should find extremely strong resistance at that trend line, I would not expect that trend line to be broken while primary wave 5 is incomplete.
The aqua blue trend line is a simple TA trend line which is showing where price is currently finding resistance. The power of the middle of the upcoming third wave should break above this trend line. If this trend line begins to be breached that may be the earliest indication that the main hourly wave count is correct today. I am copying this trend line over to the main hourly wave count today.
The target for primary wave 5 at this stage remains the same. At 956.97 it would reach equality in length with primary wave 1. However, if this target is wrong it may be too low. When intermediate waves (1) through to (4) within it are complete I will calculate the target at intermediate degree and if it changes it may move upwards. This is because waves following triangles tend to be more brief and weak than otherwise expected. A perfect example is on this chart: minor wave 5 to end intermediate wave (1) was particularly short and brief after the triangle of minor wave 4.
Intermediate wave (2) may not move beyond the start of intermediate wave (1) above 1,345.22. I have confidence this price point will not be passed because the structure of primary wave 5 is incomplete because downwards movement from the end of the triangle of primary wave 4 does not fit as either a complete impulse nor an ending diagonal.
To see a prior example of an expanded flat correction for Gold on the daily chart, and an explanation of this structure, go here.
Main Hourly Wave Count
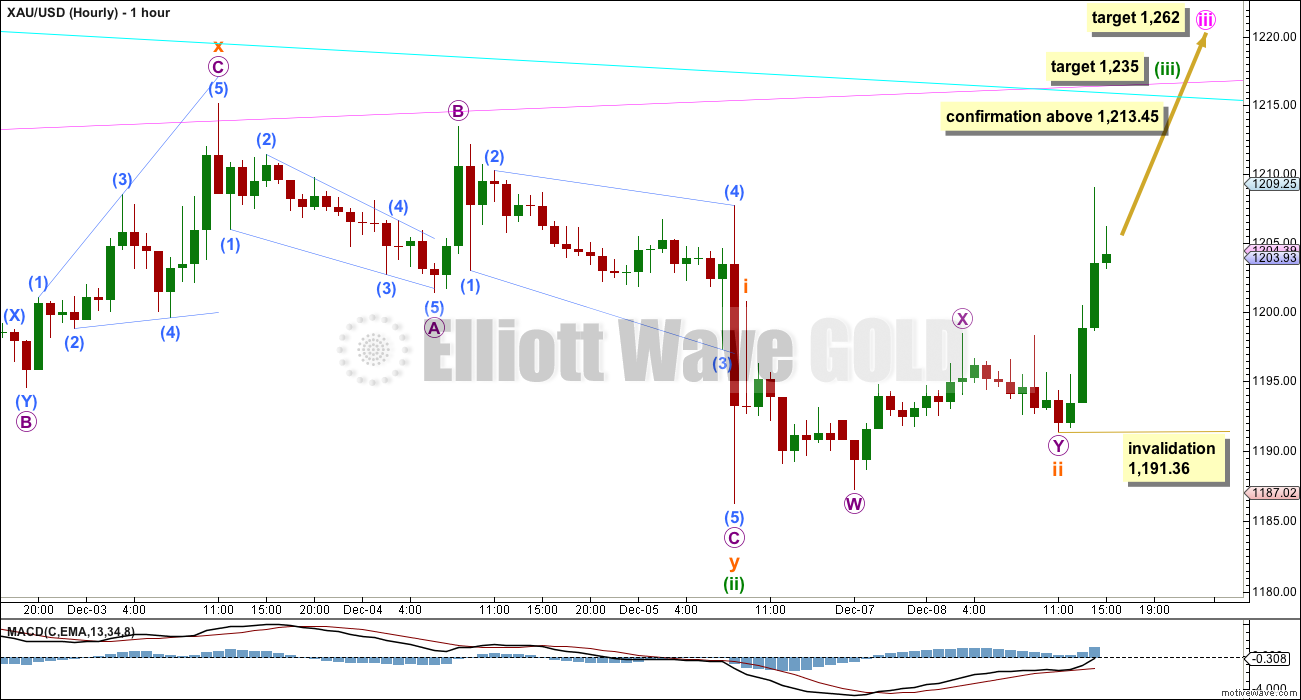
If minuette wave (ii) is over then this upwards movement should be minuette wave (iii) within minute wave iii. It should be showing a strong increase in upwards momentum. So far momentum is beginning to increase, but it should continue to increase strongly if this main wave count is correct.
At 1,235 minuette wave (iii) would reach only 0.618 the length of minuette wave (i). I am using this Fibonacci ratio to calculate the target in this case for two reasons: minuette wave (ii) is very shallow and this fits best with the higher target for minute wave iii. If minuette wave (iii) were to reach equality in length with minuette wave (i) it would end above 1,262.
However, because this is an unusual ratio for a third wave I do not have full confidence in this target. I do however have more confidence in the target for minute wave iii to reach 1.618 the length of minute wave i at 1,262.
Within minuette wave (iii) so far subminuette waves i and now ii are probably complete. Within subminuette wave iii no second wave correction may move beyond the start of its first wave below 1,191.36. The lower invalidation / confirmation point can now be moved upwards.
It may be that the aqua blue trend line is breached before price makes a new high above 1,213.45. If this happens it would be an early indication that this main wave count is correct. A new high above 1,213.45 would confirm it.
Alternate Hourly Wave Count
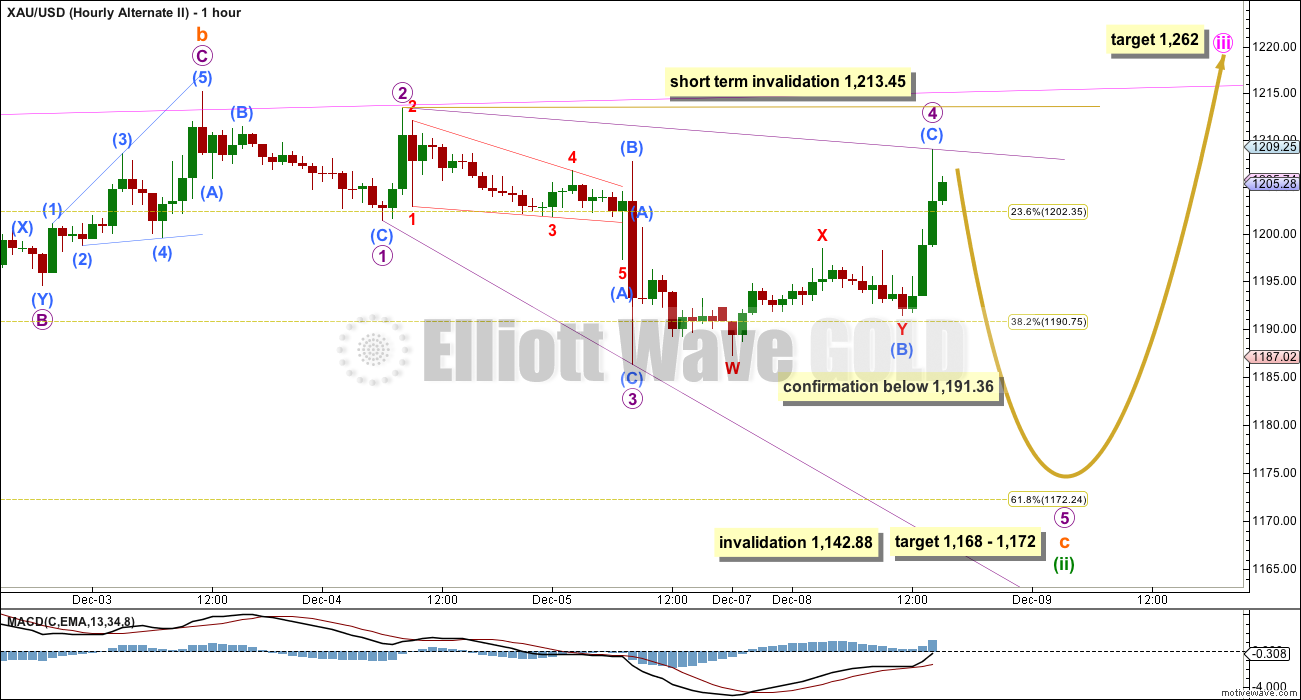
It is still possible that minuette wave (ii) is an incomplete single zigzag. Within it subminuette wave c downwards is an incomplete ending expanding diagonal.
Within an ending diagonal all the sub waves must subdivide as zigzags. The second and fourth waves within diagonals are normally very deep, between 0.66 to 0.81 the first and third wave lengths. Here micro wave 2 is 0.88 and micro wave 4 is now 0.84.
This alternate wave count now expects one more spike downwards to complete minuette wave (ii). It would be confirmed with a new low below 1,191.36. At that stage the target for the last spike down to end would be at 1,168 – 1,172 where subminuette wave c would reach 1.618 the length of subminuette wave a and minuette wave (ii) would end close to the 0.618 Fibonacci ratio of minuette wave (i).
This alternate wave count is still about equally as likely as the main wave count today. It too required some upwards movement for micro wave 4 to overlap into micro wave 1 price territory, and for micro wave 4 to be a suitably deep correction. It is right at this point at the time of writing this analysis that the two wave counts now diverge.
Alternate Daily Wave Count
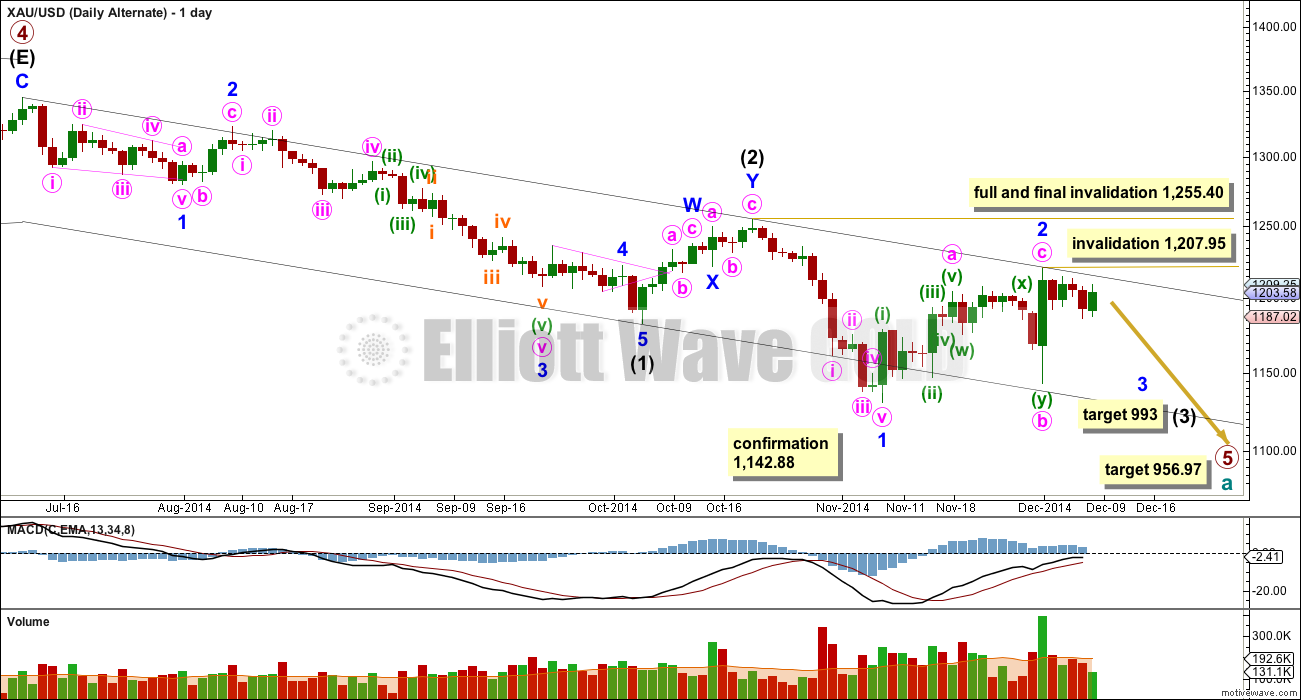
I will publish this alternate today so that my Gold analysis is in line with my Silver and GDX analysis. This idea works for all three markets. It is possible that the middle of a strong third wave down has begun.
However, for all three markets this idea has a very low probability. I do not always publish all possible alternates because sometimes the probability of an idea is too low for it to be given consideration. I am concerned that in publishing this it may be given too much weight. However, in response to a members concern, here it is.
Yes, this is technically possible. But I consider it to have an extremely low probability. Intermediate wave (2) would have been a rather brief and shallow correction for an intermediate degree wave. Intermediate wave (2) lasted 11 days and was only 45% the length of intermediate wave (1).
Minor wave 2 is longer in duration than intermediate wave (2), at 16 days in duration. It is also very deep at 73% the length of minor wave 1.
If intermediate wave (3) has begun, then the second wave correction within it should be more shallow and definitely more brief than intermediate wave (2). This is what substantially reduces the probability of this wave count. In my experience Gold has the most typical looking structures of all markets (because this market has huge volume). It is proportion of the waves which give a typical look to structures. This wave count is disproportionate.
Any movement above 1,207.95 would invalidate this wave count as it is labelled. Movement above 1,255.40 would fully invalidate it as no second wave correction within intermediate wave (3) may move beyond its start. However, before that price point is passed a daily candlestick above the upper black trend line (this is a base channel about intermediate waves (1) and (2)) would see this alternate discarded. A lower degree second wave correction should not breach a base channel drawn about a first and second wave one or more degrees higher.
This analysis is published about 06:23 p.m. EST.
I don’t think so… I’m looking at the subdivisions on the hourly chart now so I’ll be able to answer this question more definitively in today’s analysis.
But it doesn’t look like it is done yet. The target was too low. Recall I didn’t have 100% confidence in that target for minuette wave (iii) at 1,235.
Is wave green iii done?
Cha Ching … Nice one Lara
Hear hear. Excellent!
Alternate daily count did it get invalidated gold was briefly above 1208? Now it is around 1207.
Thanks.
The probability of that alternate is now miniscule. Less than 1%.
It will be fully and finally invalidated by a new high above 1,255.40.
Because EW rules are black and white invalidation points are too. They only need to be breached intra minute, by only the tiniest amount. Any breach of any amount of any duration invalidates the wave count as it is labelled.
Lara, Thanks for adding the alternate daily count. I think the benefit to members is that it helps us see and hear from you why the wave count has such a low probability and for you, it likely means that you will wake-up to less frantic comments.
That made me laugh. Yeah, sometimes I wake up to lots of frantic comments. I make sure I have at least one coffee in me before I turn on the computer 🙂
may you being bless with abundance of love, health and wealth.