
With the market moving higher than expected, I have updated hourly charts for you. We can use the confirmation / invalidation points to show which wave count is correct.
Click on charts to enlarge.
Main Hourly Wave Count
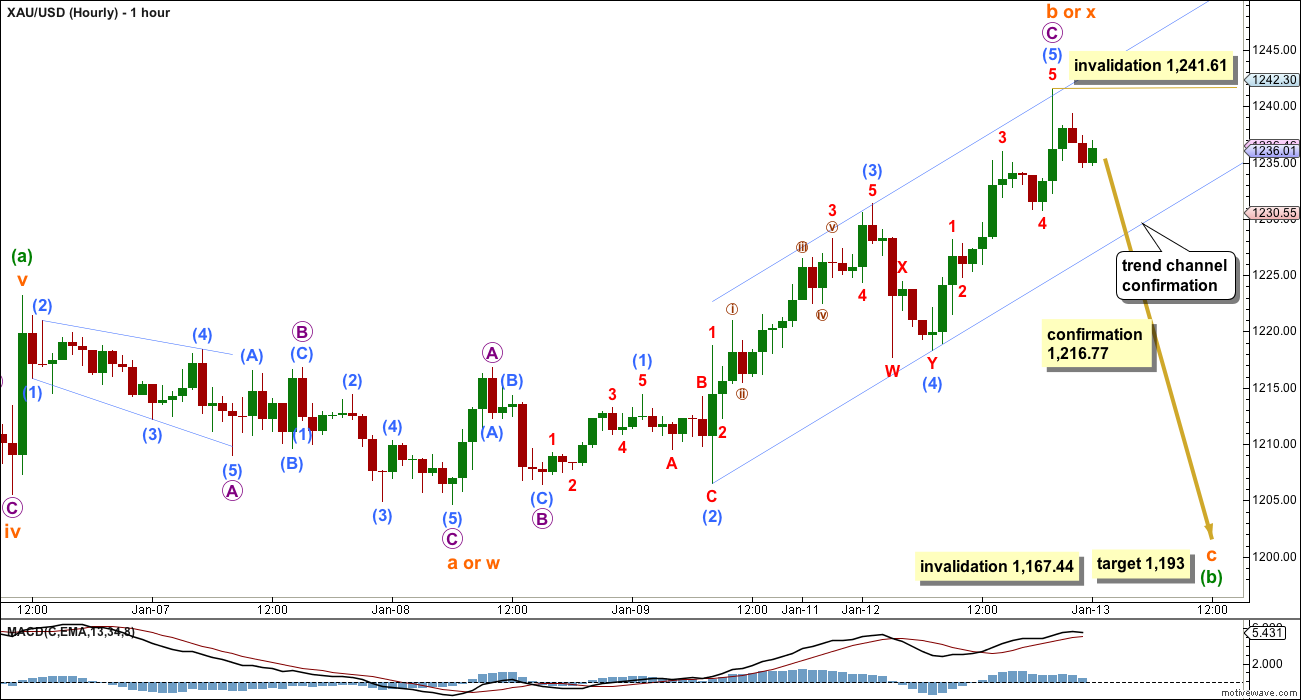
Subminuette wave b is now a 199% correction of subminuette wave a, and is just below the maximum allowable length of 200%. For this main wave count subminuette wave c must have begun, and within it no second wave correction may move beyond its start above 1,241.61.
This wave count requires a breach of the blue trend channel. A new low below 1,216.77 would confirm it. At 1,193 subminuette wave c would reach 2.618 the length of subminuette wave a.
Alternate Hourly Wave Count
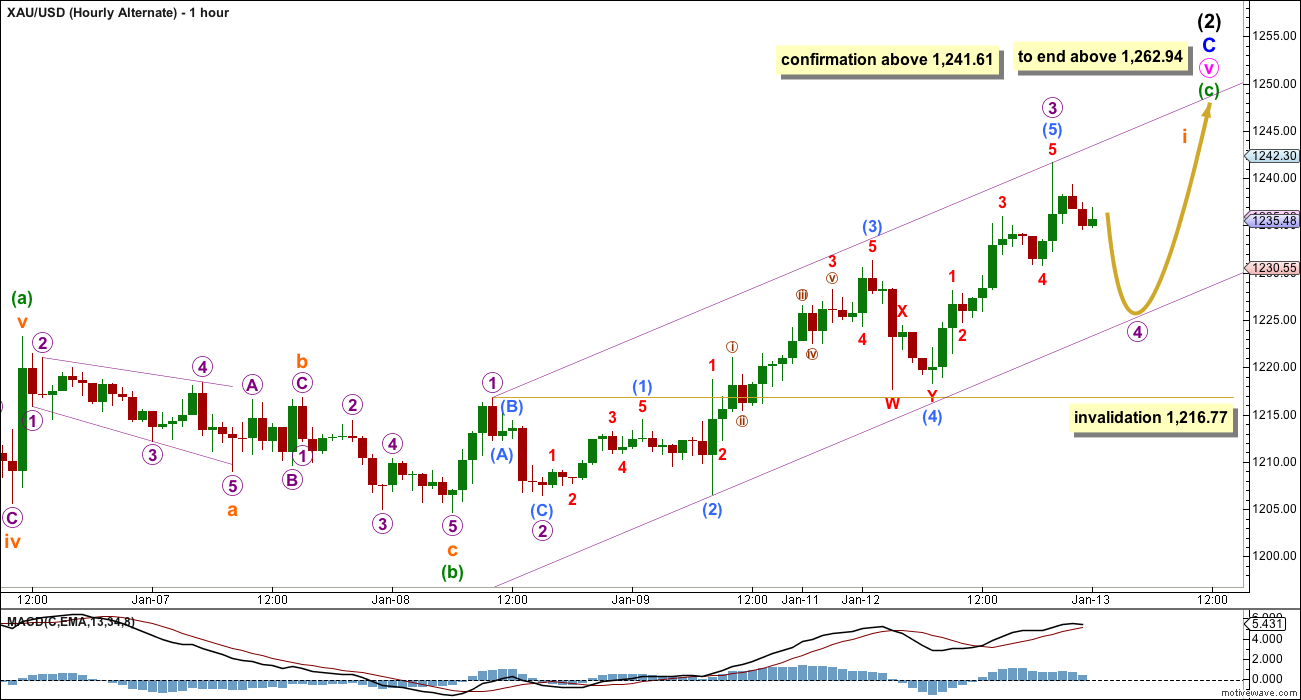
A new high above 1,241.61 at any time by any amount would confirm this alternate and invalidate the main wave count. At that stage I would expect that upwards movement should continue overall for a few days yet to at least 1,262.94.
When subminuette wave i is complete then the invalidation point must move down to its start at 1,204.65. A following second wave correction may show on the daily chart as one or more red candlesticks or doji.
This analysis is published about 1:03 a.m. EST.
This post’s number of comments must be the record. solid 71 including this one.
yeah, its fantastic! the membership is growing steadily, and its awesome to see members interacting with each other real time to help each other out.
we have some very experienced professionals here; a few CMTs, fund managers and people who trade for a living. there is a wealth of knowledge here now, and its great to see the more experienced members kindly sharing that knowledge and expertise with everyone.
Only question now is correction. Is it over? How deep will it go? EW gurus, let’s hear your position.
We had a correction, or rather a dip, 2 hours ago. Use the lower rail of the channel above as a guide for future dips on the way to 1262.
Anyone care to make a guess how low this correction will now go.
subminuette wave ii It started at 3:12 am this morning with gold peaking at 1,244.27. I am glad I bought DUST as Lara is even projecting one or more candlesticks for this second wave correction.
I’m reading comments on gold peaking but not on this big deep correction that has already just started.
How deep will this correction go today?
Gold will go up today….and tomorrow.
I know gold is heading for 1262+
However Please explain this comment by Lara and where you think subminuette wave i is?
“When subminuette wave i is complete then the invalidation point must move down to its start at 1,204.65. A following second wave correction may show on the daily chart as one or more red candlesticks or doji.”
I think it is time for Lara to chime in at this point. However, I interpreted sub i to end around 1262.
Richards interpretation is correct, that’s what I meant.
Minuette wave (a) didn’t show its subdivisions on the daily chart, it was just 2-3 days of upwards movement.
I’d expect to see some kind of alternation between minuette waves (a) and (c), so minuette wave (c) may be more time consuming and its subdivisions (the second and fourth wave corrections within it) may show up on the daily chart.
So when subminuette wave i is done (which I think it now is) we may see one or more red candlesticks or doji on the daily chart.
I say we MAY, and it is likely, but not definite.
Richard, and any other readers, I apologize for any confusion that I may have caused.
Matt, Apology accepted. Elliott Wave is complex. I make mistakes as well. I appreciate your response based on your honest interpretation. That is why it is great that nightly Lara shows up to clarify everything for everyone.
Matt why do you feel that gold will go straight up to the 1262 target other that an line and arrow point there? Why would gold go straight up when there are corrections all over the place and Lara warns of 1 or more red candlesticks?
See my comment about lower rail above. There will likely be dips on the way to 1262, just no major corrections. There is nothing in Lara’s words that indicates otherwise…..at least from my reading.
You didn’t answer why she said 1 or 2 red candlesticks?
After Lara says “At that stage” (meaning once gold makes a new high above 1241.61 – which it did), she states that she expects gold to continue upwards for days. Only when that upwards movement is finished, will those red candlesticks come.
So you think one or two red candlesticks are for when gold hits the upper target of 1262+.
I think you are mistaken as that is when gold will have maybe 60 red candlesticks.
You think ” I interpreted sub i to end around 1262.”
Plenty of corrections and other waves before that.
Good luck.
Yes that is how I read her analysis. In other words, gold goes to 1262ish, then corrects and then it moves higher still (1280s?). The 60 red candlesticks will come at that time. Lara may set her target higher now, but let’s allow her to clarify all of this.
Matt, when gold hits at least 1,262.94 that is expected to be the short term high. after that gold is expected to head towards 956.97 and not continue up to 1,280.
Any gold investments I will sell at 1,262+ area maybe up to 1,269 but must stay below the maroon weekly channel on the daily chart. The low in November wasn’t gold final bottom. That hasn’t happened yet and is expected before spring at 956 area.
That was my plan all along as well. Intermediate wave 3 is the grand prize to me that will make this all worth it.
It is entirely possible that within this final upwards wave for minuette wave (c) that it could show its subdivisions on the daily chart; that its second and fourth wave corrections may result on one or more red candlesticks or doji.
Its entirely possible, and reasonably likely. I would judge it to be more than 50% likely; minuette wave (c) may show alternation with minuette wave (a
1,244.27 completed subminuette wave i at 3:12 am. Then gold heads much lower so must lower invalidation point.
Alternate hourly wave count invalidation point must now move down from 1,216.77 to 1,204.65. A following second wave correction subminuette wave ii may show on the daily chart as one or more red candlesticks or doji.
Why do you believe that gold will go lower now? Lara says above that “upwards movement should continue overall for a few days yet to at least 1262.94.”
Matt overall movement is up, but there will be waves down on the way up. Any considerable dip below 1230 should be bought though (if this wave count is indeed the one).
I agree completely. However, I don’t see any reason for gold to move below the channel that Lara drew until we get to the 1262 area.
The tiny i besides 1,245 in Lara’s alternate hourly wave count is subminuette wave i and it just ended at 1,244.27 at 3:12 am so that calls for a correction down in subminuette wave ii and to move the invalidation point much lower. Below this updated alternate wave count Lara says,
“When subminuette wave i is complete then the invalidation point must move down to its start at 1,204.65. A following second wave correction may show on the daily chart as one or more red candlesticks or doji.”
I think you misinterpreted the placement of the i.
I think you misinterpreted that the i means 1262.
Exactly.
I am fortunate to join this service. To time the trade according to all different waves , micro, subminuette, minute has not resulted in success on a daily basis. However Lara has been providing the best guidance of the major trend which is up in this case.
Target is 1262 how gold gets up there is seems immaterial.
I am focused on having getting this int (2) C over and done.
Then have fun.
Prior to this week no one I know was calling gold to be 1262 with conviction as Lara. Since last two days of trading there are many pundits calling the target.
Bravo Lara!!!!!!!!
Thanks!
Its on its way. The question now… how will it behave on the day up, and how long will it take to get there.
I have another prediction for you (which is not part of my analysis); when it gets up there most analysts will call for new highs to go above 1,345.22. I’m pretty confident it won’t do that though, it will turn around and drop strongly for a third wave down. That may take many by surprise.
That’s my 2 cents worth.
Lara, keep those predictions coming! EW mostly objective. Your predictions combine objective and subjective (experience and intuition) which are very important.
Lara this is very interesting
Could you elaborate on why your count differs from what most are predicting?
Thanks
Because the others are wrong and think November low is end of primary wave 5
That’s right. Just like what happened for primary wave 4 🙂
I have; see my explanations of why primary 5 is probably not over, specifically the lack of Fibonacci ratios and alternation between 2 and 4 within it.
Yes. And as an original member I will take that further and say that the daily Gold & Silver charts have been very good since before the subscriber service even started.
Besides the early call for this current gold & silver run, in 2014 she nailed that gold was still in P4 when others prematurely labelled it as P5, and she stood her ground (correctly) when we pressed her about it. She nailed the beginning of P5 in 2014. And in spring 2013 she nailed the famous waterfall event in gold and silver well in advance of that breakdown of major shelf support (1525 gold).
I could go on but you get the picture. Her accurate, detailed and articulate analysis is beyond equal.
She also has a pleasant voice.
And I hope all our members have a fantastic day 🙂
My only complaint is that she teases us with those monthly pics from gorgeous NZ…
Lara, are you aware just how difficult it is to obtain permanent residency there?
lol
To be clear, is Lara saying that gold will go straight to 1262.94 without a real correction?
Hi Matt,
Lara says ” When subminuette wave i is complete then the invalidation point must move down to its start at 1,204.65. A following second wave correction may show on the daily chart as one or more red candlesticks or doji.”
…….so maybe Lara expect that we will arrive at 1262 in 5 waves and maybe is finish only the first ( subminuette i )
So is the target for subminuette i at 1262? Just having trouble understanding this alternate above….which is now the main.
No subminuette i was 1,244.27 completed at 3:12 am. Then subminuette ii way down, then many more up and down waves before get up to 1262+
There is no straight line up. NO
The target at 1262 is for minuette c and not for subminuette i, so maybe subminuette i is finished at 1244 and sub ii down is underway. For my opinion the problem is if the space from 1244 and the daily trend line will be sufficient for developping sub iii, iv and v, needed for complete minuette c, without breach this trendline.
No straight to 1262.94 as that line and arrow on the hourly chart is just an indication of the overall direction and upper target. Gold still has lots of up and down waves before 1262+.
That is clear, but I wouldn’t be so sure that there will be any DEEP corrections on the way to 1262.94.
Hi Lara and members,
what you think about this solution ?
Wave 3 is 1,618% wave 1……
I do not like the end of subminuette i within minuette c, because the target for the end of minuette c could be too high and breach the trend.
Have to follow the party line???
Sorry Scott, i do not understand English very well…..what meaning “party line”?
I think he means “follow the majority” or the consensus.
I think the second and fourth wave corrections there are too disproportionate… however, the fourth wave is a triangle and they do tend to be more time consuming.
That one is pushing it though.
I also think that you must resolve the subdivisions within that third wave; it may only be an impulse and it has a cursory count of 7 which is corrective.
Suppose 1131 is the bottom. 1239 is 1(108), 2 is 1168(71) 65%R, 1262 is wave 1 of 3(94), then wave 2 of 3 with 62%R turns out to be 1204+_
Just conjecture, need to be ready to reverse or get out of your positions quickly in this unpredictable market…
1262 is not wave 1 it is wave (c) v circle, C (2)
yeah, there seems to be too much confusion about this. I’ll focus on an explanation in todays analysis
The ratio of Gold to Oil is extreme. Currently it is 27. Historically the ratio average is 15.
Some thing here needs to give between gold and oil?????
Hi Lara Great work!! I have educational question. Definition of running flat:
in a Running flat wave B terminatess well beyond begining of wave A. as in expanded flat , but wave c fails to travel its full distance, falling short of the level at which wave A ended.
Above states well beyond but you are limiting at max 200%of wave a for wave B.
you’re correct, but I’m not seeing a question, just a comment?
the limit of 200% is a bit arbitrary, and its not in Frost and Prechter. I got this figure from Elliott Wave International after I asked the question of how long can a B wave within a flat can be. Their response was that there is no limit, but their computer program calls for the idea that a flat is unfolding to be discarded when B reaches 200% the length of A or longer.
ALTERNATE hourly wave count is now validated. Don’t use Main hourly wave count as it has been invalidated at 3:11 and 3:12 am when Gold went above 1,241.61 up to 1,244.27 to complete subminuette wave i.
Alternate hourly wave count invalidation point must now move down from 1,216.77 to 1,204.65. A following second wave correction subminuette wave ii may show on the daily chart as one or more red candlesticks or doji.
Richard, can u get Lara to update again now that it is invalidated. I think any correction now will just be a pause before it moves up.
I’m working on it now.
Need to respect head and shoulder chart pattern. Chart patterns do not lie.
I am waiting for the second wave correction which may not move beyond 1204.65.
I hope gold start correcting now.
The chance that 1131 is the bottom is quickly increasing and we won’t be seeing 1204 again. We’ ll find out shortly after 1262+
Correction, still possible, see above…
In every nightly video Lara explains why 1,131 is not the bottom of Primary wave 5.
Head and shoulders is interesting though.
Lara is the 1st to admit she’s had to change her wave count before.
Good luck. I’ll sell it all around 1262+
No chance 1131 is the bottom.
First 1262 then 956.97
Head is $120 from 1130 to 1250. Neckline is now around 1235, so target by measured rule is 1235 + 120 = $1355.
IMO from experience the pattern isn’t a bad indicator of direction on longer timeframes, but the target by measured rule isn’t good.
Lara, it very considerate and really helpful that you updated your nightly forecast because of the concern over the 8:21 pm spike up to 1,242.30.
You are the best Elliott Wave forecaster in the world. I sincerely appreciate your amazing deluxe analysis everyday.
Agreed Lara went above & beyond her duties to do this.
What is your data feed? I do not see that 1242.3 at 8 pm, but watching silver, it will probably pull up gold
I had 1,241.25 at 8:21 pm on the 1 minute scale at http://www.pmbull.com live gold feed.
Lara has 1,242.30 on the hourly charts. She may have an every more precise time in the seconds that can pick up spike in more detail.
I second that. Great work Lara!!!
Thanks!
I passed over the Southern Alps yesterday through Haast Pass, and when I arrived in Wanaka with a great internet connection I was dismayed to see my analysis was not working out as I had expected. I couldn’t go to sleep knowing what I should have published, and that alternate was a very necessary “what if”.
You interrupt the Alps for a 2nd update.
Ah, thanks a million!