
The alternate Elliott hourly wave count from yesterday’s update was confirmed with a new high above 1,241.61.
Summary: The trend is up. I expect it to end above 1,262.94. Use the trend channel on the hourly chart to indicate when a larger correction has arrived, because I expect two on the way up to the target. It is reasonably likely that they may show up on the daily chart as one or more red candlesticks or doji.
Click on charts to enlarge.
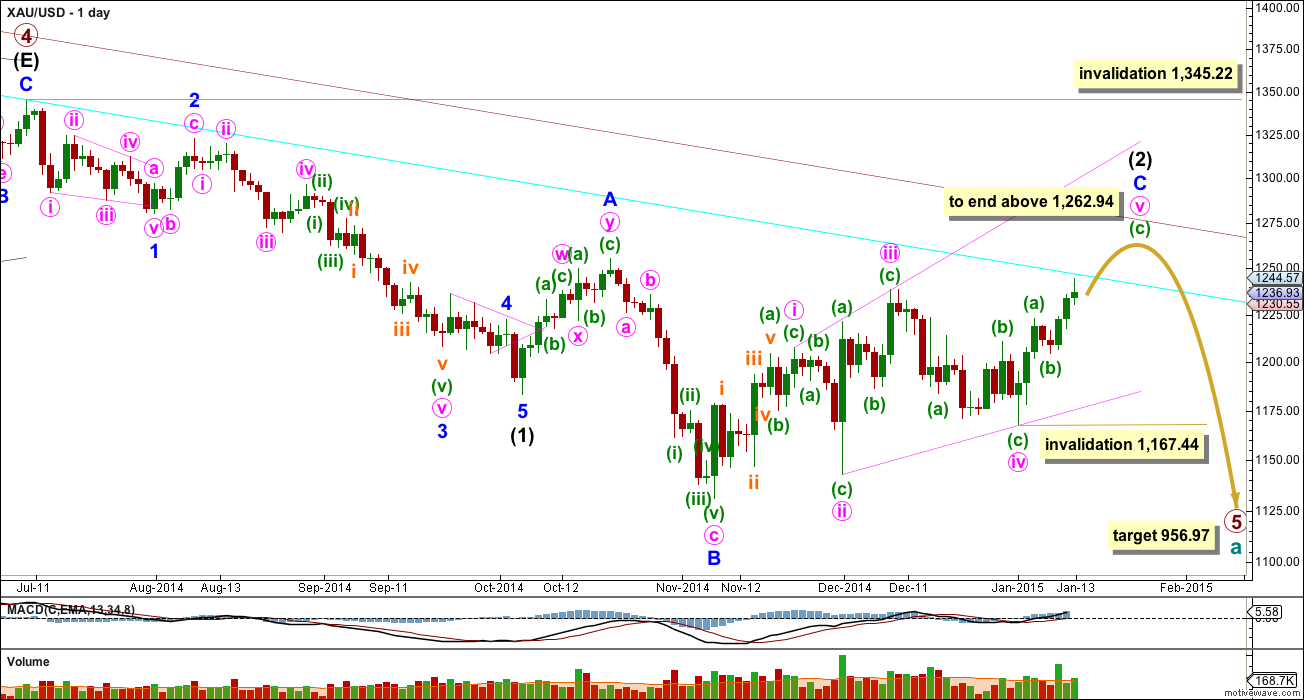
Primary wave 4 is complete and primary wave 5 is unfolding. Primary wave 5 may only subdivide as an impulse or an ending diagonal. So far it looks most likely to be an impulse.
Within primary wave 5 intermediate wave (1) fits perfectly as an impulse. There is perfect alternation within intermediate wave (1): minor wave 2 is a deep zigzag lasting a Fibonacci five days and minor wave 4 is a shallow triangle lasting a Fibonacci eight days, 1.618 the duration of minor wave 2. Minor wave 3 is 9.65 longer than 1.618 the length of minor wave 1, and minor wave 5 is just 0.51 short of 0.618 the length of minor wave 1. I am confident this movement is one complete impulse.
Intermediate wave (2) is an incomplete expanded flat correction. Within it minor wave A is a double zigzag. The downwards wave labelled minor wave B has a corrective count of seven and subdivides perfectly as a zigzag. Minor wave B is a 172% correction of minor wave A. This is longer than the maximum common length for a B wave within a flat correction at 138%, but within the allowable range of twice the length of minor wave A. Minor wave C may not exhibit a Fibonacci ratio to minor wave A. Minor wave C is extremely likely to move at least slightly above the end of minor wave A at 1,255.40 to avoid a truncation and a very rare running flat correction. It may end when price touches the upper edge of the maroon channel, copied over here from the weekly chart. To see how to draw this channel click here. I have created a parallel copy of this upper maroon trend line today and pulled it down to sit right on the high of primary wave 4. Upwards movement for today’s candlestick is extremely close to this trend line, which may provide enough resistance to initiate a second wave correction.
To see a prior example of an expanded flat correction for Gold on the daily chart, and an explanation of this structure, click here.
So far within minor wave C the highest volume is on three up days. This supports the idea that at this stage the trend remains up. Even for the last 13 trading days the highest volume is in five up days.
Minor wave C may be only subdivide as an impulse or an ending diagonal. With all the overlapping within it, an ending diagonal looks more likely, and it is now within the final fifth wave up. The diagonal is expanding and the trend lines clearly diverge. Expect the final fifth wave of expanding diagonals to fall short of the i-iii trend line. Minute wave v should be longer than equality with minute wave iii which would be achieved at 1,262.94. This would also see minor wave C end above the end of minor wave A at 1,255.40 avoiding a truncation and a very rare running flat.
Within an ending diagonal all the sub waves must subdivide as zigzags. The fourth wave should overlap first wave price territory. The rule for the end of a fourth wave of a diagonal is it may not move beyond the end of the second wave.
Within the final upwards zigzag of minute wave v if minuette wave (b) were to continue further it may not move beyond the start of minuette wave (a) below 1,167.44.
Intermediate wave (2) may not move beyond the start of intermediate wave (1) above 1,345.22. I have confidence this price point will not be passed because the structure of primary wave 5 is incomplete because downwards movement from the end of the triangle of primary wave 4 does not fit well as either a complete impulse nor an ending diagonal. If it is seen as a complete impulse there would be inadequate alternation between the single zigzag of the second wave and the double zigzag of the fourth wave correction, and there would be no Fibonacci ratios between the first, third and fifth waves within it.
Minuette wave (b) must be complete. This upwards movement is extremely unlikely to be a continuation of that correction. Minuette wave (c) looks like it has begun.
At 1,260 minuette wave (c) would reach equality in length with minuette wave (a). I expect upwards movement to end very close to 1,262.94, at or slightly above this point, so that minuette waves (a) and (c) are close to equality.
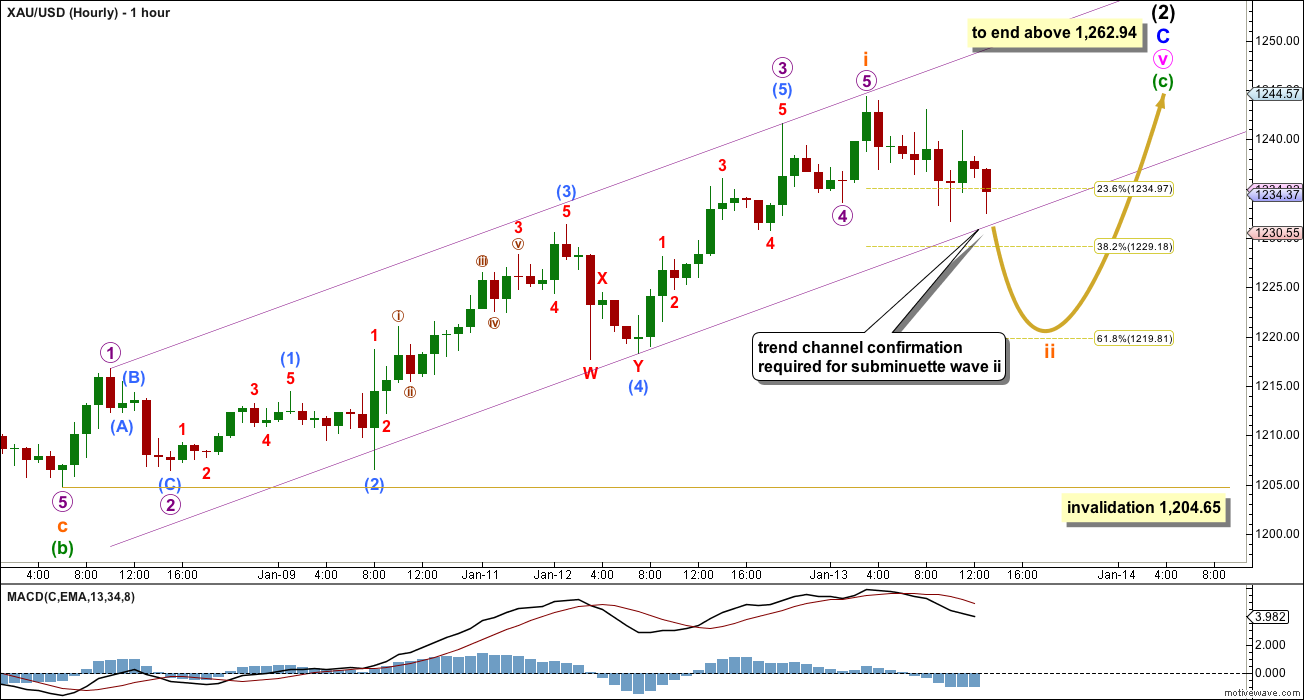
Minuette wave (c) must subdivide as a five wave structure. The only two possibilities are an impulse (most likely) or an ending diagonal (less likely). Within minuette wave (c) there will be two larger corrections along the way up: one for subminuette wave ii and the other later on for subminuette wave iv.
So far to the upside within minuette wave (c) I can see a completed five wave impulse. It is possible and very likely that subminuette wave i is over. Because this subdivides so well as a five wave impulse this indicates that minuette wave (c) is unfolding as a simple impulse rather than an ending diagonal, because within an ending diagonal all the sub waves must be zigzags.
Ratios within subminuette wave i are: micro wave 3 is 3.44 longer than 2.618 the length of micro wave 1, and micro wave 5 is 1.38 short of equality in length with micro wave 1. Because this labelling has such good Fibonacci ratios I am reasonably confident it is correct.
I have drawn a parallel best fit channel about submineutte wave i. It is important that this channel is used to confirm that subminuette wave i is over and subminuette wave ii has begun. Confirmation will come with a full hourly candlestick below the lower edge of the channel and not touching that trend line.
I will expect to see some alternation between minuette waves (a) and (c). Minuette wave (a) lasted 2-3 days and was a straight up movement, and did not show its subdivisions on the daily chart. Minuette wave (c) may look different with its subdivisions (subminuette waves ii and iv within it) showing up on the daily chart as one or more red candlesticks or doji. It does not have to do this, but is just reasonably likely that it will do this.
When the channel here is breached then I would have more confidence that subminuette wave ii is underway. It may end at the 0.382 or 0.618 Fibonacci ratio of subminuette wave i, favouring the 0.618 ratio as this is a second wave correction.
Subminuette wave ii may not move beyond the start of subminuette wave i below 1,204.65.
This analysis is published about 2:16 p.m. EST.
SEE LARA’S IMPORTANT COMMENT BELOW
Fibonacci retracement of .618 of movement last night may bring gold down to $1,232. That is my guess. All you EW experts can make a projection of gold bgottom today.
Could 1233 just now be it?
See Lara comment below 10 minutes ago
Yes, thanks. Looks like we could be going lower.
GDXJ is putting inverse HnS #2. Once the price moves above NL #1 time to buy GDXJ.
papudi, Great GDXJ chart.
GDXJ is last at 27.48 at 12:11 pm and I think you are suggesting to wait until GDXJ is above neckline #1 at $28.00 to buy GDXJ. We know Lara’s short term forecast is $1,262, which is much higher that the 1,239 gold is at now.
If I understand you correctly, why wait to buy GDXJ higher to buy it, when it is forecast to go much higher?
The breakout signals the wave is over. Yes one buys at higher price.
Still do not know where the right shoulder is and bottomed.
I would rather follow Lara than that chart.
Especially when she gives today’s update.
Does that make sense to you or would you wait until tomorrow to look at that chart updated?
Any EW expert care to suggest a retracement target for subminuette wave iii ASAP now and then also an upper target for subminuette wave iii so it helps people buy more low now and then sell it higher up when time for subminuette wave iv correction???????
Hi Richard
I just bought NUGT for what expect will be a final run for GDX. I think we are in iv now…
disqus, Thanks for your response.
So you think subminuette iii may have peaked overnight and we are already in subminuette wave iv now? It may be possible, just would like Lara to clarify before the close.
Great that you would of bought NUGT quite cheap now since momentum in miners has really dropped of today so their prices has been dropping today even though gold is all day been yesterday’s gold close.
I was referring to GDX having completed wave iii or (iii) i believe is the way it is labeled. Miners are very weak
Richard
Miners are disconnected with gold. Today GM is down big time. GDX is following the GM not gold.
gold has stayed flat all day and Miners have given up.
I understand. Yes miners lost momentum.
I’m waiting for Lara forecast of gold’s next move, which will also lead miners.When gold peaks in next one or two highs, GDX will follow along with greatly increased momentum.
By the way I am very cautious with 3X ETFs during this short term rally.
sold NUGT for a loss. Don’t like the way GDX is looking. its only 1$ from invalidating, could easily trade lower and gap down in the am
From your action you think wave iv is completed here????
No he is suggesting “referring to GDX having completed wave iii or (iii)”
my quick 2 cents worth: this second wave correction will have either one final downwards wave (a regular flat) to end just below 1,225.15 and possibly down to 1,220 at the most…. OR…. this second wave correction is over and a third wave up has begun to 1,264.
a new high above 1,244.53 should confirm a third wave up.
a new low below 1,230.92 should confirm the second wave correction is not done.
at this stage I judge both scenarios to be even in probability.
good luck everyone! I’m writing it up now.
Lara, as per papudi above, it can’t be over at 1227 right, but must go below 1225?
“:…a new low below 1,230.92 should confirm the second wave correction is not done …to end just below 1,225.15 and possibly down to 1,220 at the most.”
Since I wrote the Q though, she mentions the possibility of “a very rare running flat.”
At 2 pm gold had new low of 1227. Gold wave ii is not over????
I invite comments under Lara’s recent GDX analysis.
Lara already provided the update last night. She is sleeping and I wouldn’t expect contact until about 2 pm. Gold doesn’t have to go any lower than what it already did last last night at 9:07 pm at 1,225.14 since that was between her two targets and trend channel confirmation definitely happened with many full hours under the lower trend line.
I suggest that the EW experts may consider calculating the possible retracement target to hit any minute now based on the movement up this morning or did it already hit it at 10 am today.
Then if possible calculate what the target for subminuette wave iii might be.
As far as 1262 by Friday, very unlikely as first subminuette iii has to top then subminuette iv has to bottom, yes a real correction again, then gold can go up very close to, at or above 1262.
Richard
Time to get in GDX and GDXJ????
Yes now or any minute now they are low right now. I already bought twice this morning and expect to sell at subminuette wave iii high today or tomorrow.
Lara any update ??? Gold is back near top 1244. Is it going to 1262 by Friday?????
working on it now – see my recent comment to Richard above
Gold break out in 30 min and 10 min. Correction over!!!!! Acting like a impulse wave iii.
How about an expanded flat correction within subminuette wave ii?
I show b wave isn’t 105% of a wave. Maybe a regular flat correction. However, I favor subminuette ii already completed at $1226ish.
Chapstick,
I agree subminuette wave ii has completed at $1,226ish.
Gold hit that area many times from 9 pm until 5 am overnight and also had many full hours below lower trend channel for the required trend channel confirmation.
Why do you think subminuette wave ii hasn’t ended yet when it has already met all of Lara’s requirements and then went all the way up to 1,244.48?
Guess we already have our answer. It was a flat, just not expanded.
Interesting $USD chart from a Chris Vermeulen post. Strong dollar should continue to drive the gold bear.
We have Confirmation subminuette wave ii has
begun as already had 8 full hourly candlesticks fully below lower edge of
channel as of 5:30 am January 14th.
I am out of DUST. May be I will get in in GDX and GDXJ by end of the day.
I am looking to buy more GDX, hopefully gold gets closer to Lara’s preferred 1219.81. Gold may then move up to finish subminuette wave iii then I sell GDX because correction in subminuette wave iv.
1219 may be reached today or tomorrow.
Or perhaps the correction is already over at 1224.9?
2nd waves generally correct deeper than this. In fact, a long time ago I read that 2nd waves must correct a minimum of 50%. This wasn’t something that I read on Lara’s site – it was some other Elliotian, but I don’t recall where I saw it. Has anyone else ever learned that? I know that Lara has made exceptions during strong 3rd waves, for example, and allowed for less lengthy 2nd waves within them.
Thanks for that clarification. You could very well be right – I’m an EW novice. Just was observing very recent price movement (after 1pm EST).
it is not a strict rule for 2nd wave to correct of 50%. that’s why Lara gives several levels of correction.
50% is not required as Lara gove two choices for correction bottom for subminuette ii at 38.2% 1229.18 and 61.8% at 1219.81 on her hourly chart and gold bottomed at 1,225.14 at 9 pm and met all other requirements that Lara stated.
I’ve never heard that one, and in my experience its not true.
Its not in Frost and Prechter anyway.
I’ve read a lot of “rules” about EW online from all sorts of people and I’ve firmly concluded; stick with Frost and Prechter. Don’t rewrite EW rules, and don’t take anyone who diverges from what they’ve written seriously at all. Ignore it.
I believe that will not happen.
Bob B. (or anyone following GDX) do you think correction for GDX / GDXJ is over or are we facing more down? If more down, how much more?
Looks like we had a bearish engulfing candlestick on both GDX and GDXJ today. According to “thepatternsite”, there is a 79% chance of a lower low after this candlestick. This correction may last another 2-3 days. Hard to say what pattern the correction will take. We may go up tomorrow, then down more, or go mostly sideways. The lowest that I see GDXJ going is around 26, but we may not get that low.
Thanks Bob B, appreciate your postings on GDX and GDXJ.
GDXJ is making HnS. Just made the neckline and now in this wave ii will put in the right shoulder. GDXJ already has the HnS in 2 hr and testing the neckline after a break out.
Lara just posted GDX EW analysis on Jan 14th.
The GDX info is January 12th, I can tell by the close in the chart. Also EW for GDX is not as accurate as Gold due to reduced volume and gold gives textbook EW but not GDX.
I bought 500 of DUST 6 seconds before close Monday and sold it today for $441 Canadian profit, could of been more however difficulty knowing how low gold would correct to today and choppy. Anyways got a profit, live and learn and bought some GDX cheap this afternoon and maybe more Wednesday and then sell it higher up at top of third wave then maybe buy DUST for 4th wave down then sell and buy GDX for final 5th wave up to 1,262+ area high. It’s a wild ride figuring these short swing trades along the way and the next peak and retracement targets especially often ahead of getting them from official EW analysis. I try to get profits often instead of holding for a maybe profit longer term that may or may not materialize or getting caught the wrong way for days and ending up in a negative and stressed.
R u out of DUST? Gold is 1229 at 8:30 and going down??
I sold DUST before closing.
Yes I sold my DUST today
I checked hourly trend line and it is borderline possible that gold had 1 full hour barely under bottom trend line 1 hour from 4:00 to 5:00 today.
If someone has a way to calculate that precisely that would be appreciated.
A trendline break is more convincing if it is done with a strong down bar instead of a small sideways bar. Lara made that distinction a few weeks ago for a different channel trendline. We have not (yet) taken out the 2 pm low.
Yes, and on top of that, we are now back above the trend line with this hour just closing at 1232.95, above the TL at 1232.39. It seems that dip may have been a fake out…. esp with no new low like you said.
Yes indeed, and normally I’d go with that.
In this case today though we also have a red candlestick now complete for 13th Jan. It looks like this is the second wave correction beginning to show up on the daily chart.
At 9:07 pm EST gold just dropped to 1225.14 and took out the 2 pm low and has to stay under trend line a full hour, not yet.
Great to see everyone working so hard together before this reversal. Thanks for your update Lara, I’m sure this board (including myself) will need you more than normal for the next while.
Keep up the hard work.
Jaf, I agree. Good to work together to figure out next gold targets for buys and sells.
Hi Lara..
Thanks for the update. Hoping to make some money soon from these updates.
Confused by this most recent count though…
Wave c is supposed to start at 1204 and end at 1262 for a length of $58. Wave c is supposed to be an impulse. An impulse has 5 waves.
Wave i of c started at 1204 and ended at 1244 for a length of $40.
That leaves $18 for waves 4 and 5.
Is that realistic if wave 3 cannot be the shortest?
Doesn’t it pretty well force the wave structure to be a diagonal?
I can’t picture the impulse…can you clarify?
Subminuette wave ii may end down at 1229 or 1220 area.
Then up to 1,262+ area.
the situation may be overly constrained and something may have to give. For example, wave 5 could be tiny or we could go quite a bit above 1262. The idea of Intermediate (2) being an expanded flat is not invalidated until price goes over 1345. I know Lara considers Intermediate (2) going over 1300 to be low probability, but low probability is not the same as impossible.
The rule is a third wave cannot be the shortest, which is not the same as it must be the longest.
In this instance we may have a deep second wave correction, a third wave equal in length to the first and a short fifth wave.
Or… we could have a third wave shorter than the first and a fifth wave shorter still.
Subminuette wave i now looks complete for two reasons; we have a small red candlestick on the daily chart for 13th Jan, and we have a small breach of the channel on the hourly chart.
Only when subminuette wave iii is clearly complete also will I begin to worry about the lengths of subminuette waves i, iii and v in relation to each other. Its too early to do that now.
Not enough time to get 1 full hour of breach below lower trend channel confirmation before close Tuesday as bottom of trend line around 1,232. I did check on pmbull hourly chart and appears won’t get a full hour before close today.
If we continue up from here without having a full hour bar below the uptrend channel, maybe that would mean today’s action has been micro wave 4 of subminuette i tracing out a larger expanded flat (and we are now in micro 5).
Hi FP, micro 5 could go to 1262 and then the large retracement to 1204… It’s possible, we’ll find out soon..
Scott, micro 5 of subminuette wave i may not get to 1,262 area if we still have numerous waves to go through until we reach the final target of 1,262 area.
1,204 is the invalidation point and the two targets are either 1,229.18 or 1,229.81.
We will see overnight and tomorrow how it plays out and our opportunities to firm up our positions.
It’s just conjecture as I said this morning. Just alt possibilities for members to think about if they wish…I not promising anything…
I think a strong impulse could get to 1262…
Any idea how gold might open Wednesday if gold doesn’t end up with lower trend channel confirmation overnight? I sold my DUST today for a profit and already took a small position in GDX already and looking to sell it at a profit or buy more cheaper Wednesday.
On a 15-minute chart, GDX looks like today’s downwave is not complete. Subwaves 2 and 4 look too similar which makes me think subwave 4 needs more work.
You deleted your post about micro 5 possibly starting
Sorry, I see it now. Ai moved to the bottom.
Do we have to have a full bar body below the trend line or just a close? Because we already got the close below the trend line with the last hour….
Lara set the standard as a full bar below the trendline for deciding whether subminuette i is over.
Last hour is now complete, fully below the trend line… correct?
Yes. And we now have a completed red candlestick for 13th Jan. I expect this second wave correction to show up on the daily chart, and it looks like this red candlestick is the first part of it. Although the channel breach is really small so far, in conjunction with this red candlestick I think that is enough to say this is very likely subminuette wave ii beginning.
Lara it appears the hourly channel is holding nicely… just bounced right around $1228 & does not appear like we will get an hourly close below that channel.
That might depend on whether we’ve had a complete zigzag or just the zig and part of the zag so far. I can see how to label it each way