
This second wave correction is either over already or it may have one final last push down. We may use confirmation / invalidation points to work with the two hourly wave counts today.
Summary: The trend at minute, minor and intermediate degree remains up. A third wave up would be confirmed as underway if we see a new high above 1,244.53, and the target for the third wave to end is at 1,264. Alternatively, this small second wave correction would be confirmed as incomplete if we see a new low below 1,230.92. The target for it to end is either just below 1,225.15 or maybe 1,220.
Click on charts to enlarge.
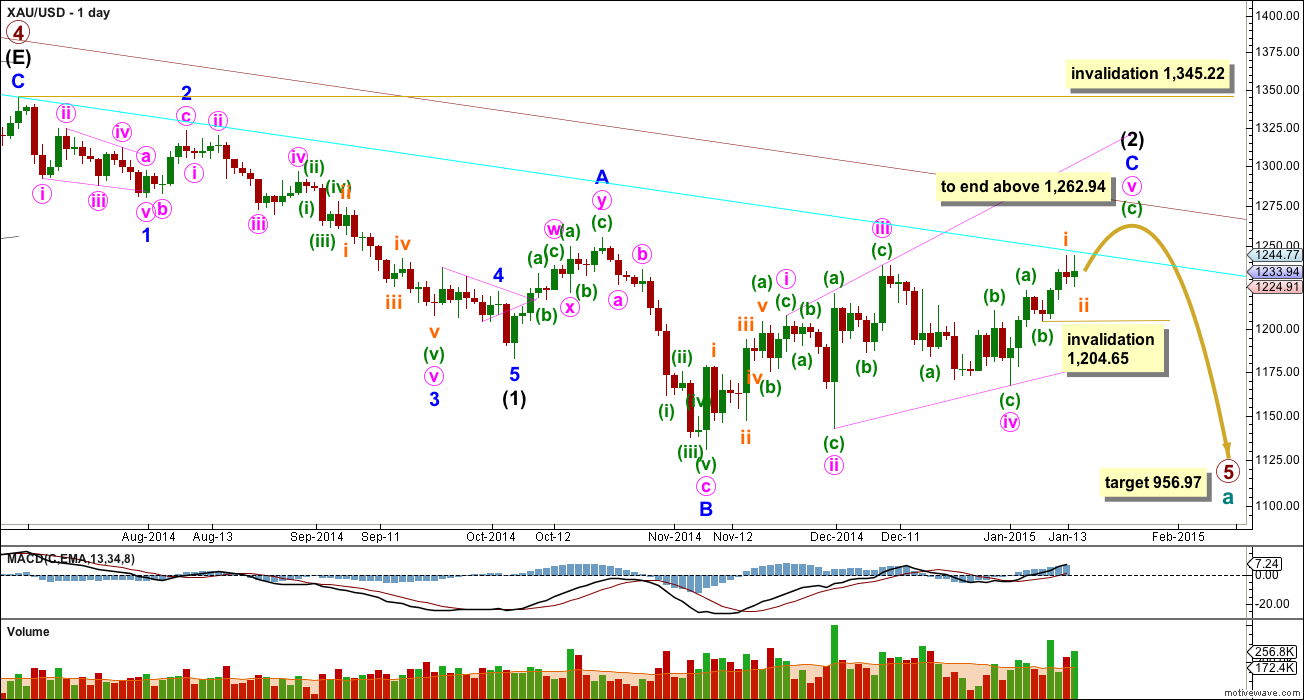
Primary wave 4 is complete and primary wave 5 is unfolding. Primary wave 5 may only subdivide as an impulse or an ending diagonal. So far it looks most likely to be an impulse.
Within primary wave 5 intermediate wave (1) fits perfectly as an impulse. There is perfect alternation within intermediate wave (1): minor wave 2 is a deep zigzag lasting a Fibonacci five days and minor wave 4 is a shallow triangle lasting a Fibonacci eight days, 1.618 the duration of minor wave 2. Minor wave 3 is 9.65 longer than 1.618 the length of minor wave 1, and minor wave 5 is just 0.51 short of 0.618 the length of minor wave 1. I am confident this movement is one complete impulse.
Intermediate wave (2) is an incomplete expanded flat correction. Within it minor wave A is a double zigzag. The downwards wave labelled minor wave B has a corrective count of seven and subdivides perfectly as a zigzag. Minor wave B is a 172% correction of minor wave A. This is longer than the maximum common length for a B wave within a flat correction at 138%, but within the allowable range of twice the length of minor wave A. Minor wave C may not exhibit a Fibonacci ratio to minor wave A. Minor wave C is extremely likely to move at least slightly above the end of minor wave A at 1,255.40 to avoid a truncation and a very rare running flat correction. It may end a little short of the upper maroon trend line (most likely) or it may end when price touches the upper edge of the maroon channel, copied over here from the weekly chart. To see how to draw this channel click here. I have created a parallel copy of this upper maroon trend line and pulled it down to sit right on the high of primary wave 4. Upwards movement for the last two candlesticks is extremely close to this trend line, and this is where a small correction began.
To see a prior example of an expanded flat correction for Gold on the daily chart, and an explanation of this structure, click here.
So far within minor wave C the highest volume is on three up days. This supports the idea that at this stage the trend remains up. Even for the last 14 trading days the highest volume is in two up days.
Minor wave C may be only subdivide as an impulse or an ending diagonal. With all the overlapping within it, an ending diagonal looks more likely, and it is now within the final fifth wave up. The diagonal is expanding and the trend lines clearly diverge. Expect the final fifth wave of expanding diagonals to fall short of the i-iii trend line. Minute wave v should be longer than equality with minute wave iii which would be achieved at 1,262.94. This would also see minor wave C end above the end of minor wave A at 1,255.40 avoiding a truncation and a very rare running flat.
Within an ending diagonal all the sub waves must subdivide as zigzags. The fourth wave should overlap first wave price territory. The rule for the end of a fourth wave of a diagonal is it may not move beyond the end of the second wave.
Within the final zigzag upwards of minute wave v, within minuette wave (c) its second wave correction may not move beyond the start of its first wave below 1,204.65.
Intermediate wave (2) may not move beyond the start of intermediate wave (1) above 1,345.22. I have confidence this price point will not be passed because the structure of primary wave 5 is incomplete because downwards movement from the end of the triangle of primary wave 4 does not fit well as either a complete impulse nor an ending diagonal. If it is seen as a complete impulse there would be inadequate alternation between the single zigzag of the second wave and the double zigzag of the fourth wave correction, and there would be no Fibonacci ratios between the first, third and fifth waves within it.
Main Hourly Wave Count
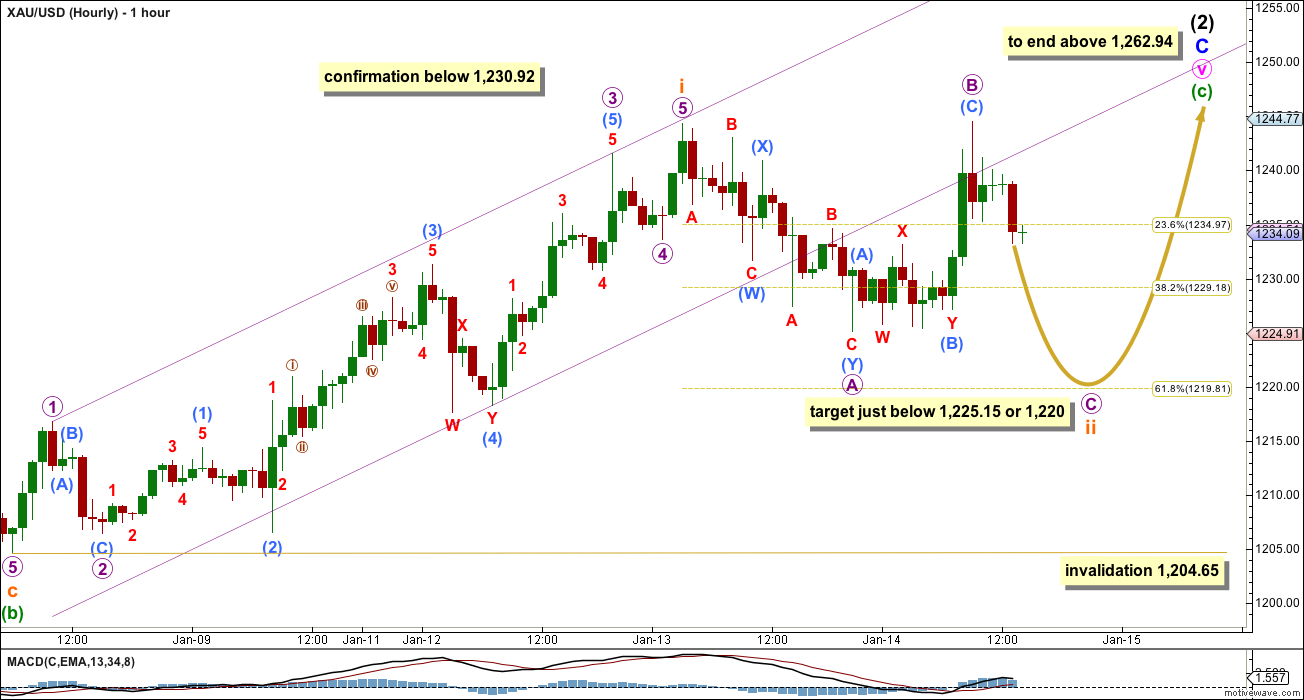
At this stage I would judge this main and the alternate hourly wave counts to have an even probability.
Subminuette wave ii may be an incomplete regular flat correction. Within it micro wave A subdivides nicely as a double zigzag, and micro wave B is a 101% correction of micro wave A. Regular flats most commonly have C waves which end slightly below the end of their A waves. Micro wave C may end slightly below 1,225.15 to avoid a truncation and a very rare running flat. It may move slightly lower to close to 1,220 to reach down to the 0.382 Fibonacci ratio. *edit: this is the 0.618 Fibonacci ratio, not 0.382
If this second wave correction is shallowdeep then the third wave up to follow it may only reach equality in length with the first wave at about $40 in length. The following fourth wave correction should be deepshallow, and the final fifth wave up may be shorter than the first and third waves.
The alternate wave count below would be invalidated with a new low below 1,230.92 which would provide confirmation for this wave count.
Subminuette wave ii may not move beyond the start of subminuette wave i below 1,204.65.
Alternate Hourly Wave Count
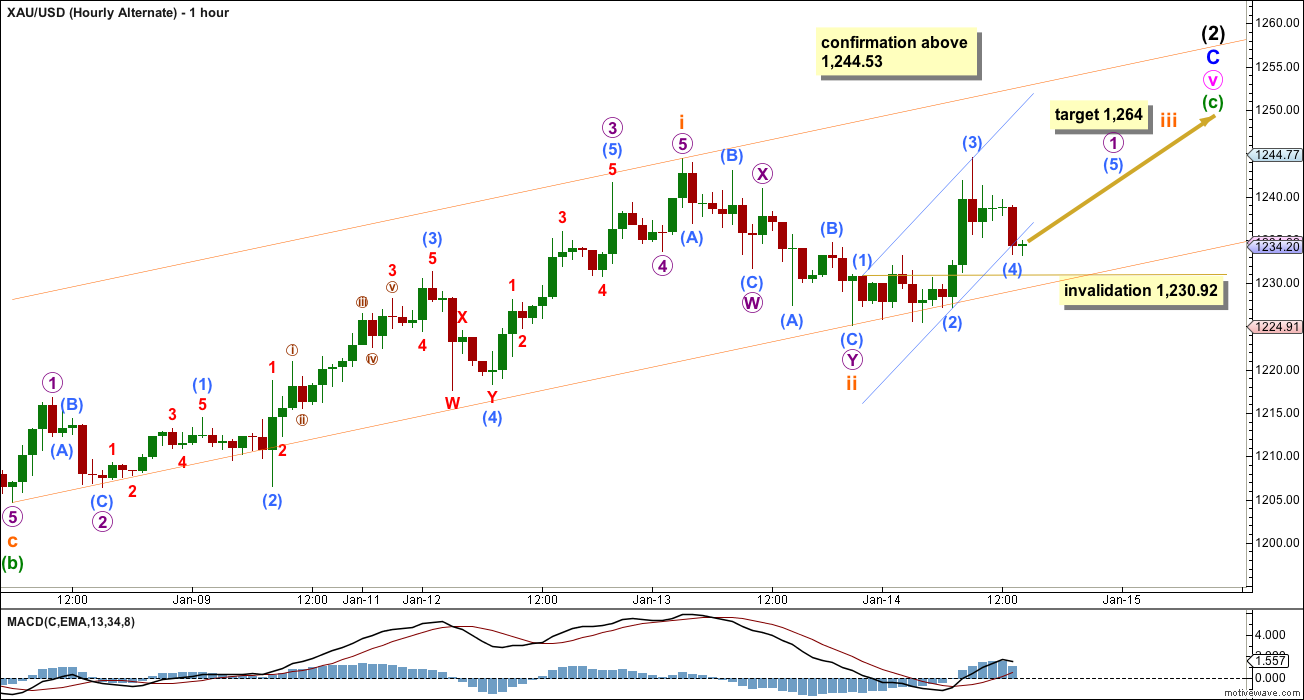
Although I have labelled these hourly wave counts “main” and “alternate” maybe I should have labelled them “first” and “second” today.
It is entirely possible that subminuette wave ii is over as a quick shallow double zigzag. This is a low degree second wave correction within minette wave (c), and may not last very long. It shows on the daily chart as one small red candlestick so far, and that gives the wave count at the daily chart level the “right look”.
If subminuette wave ii is over then at 1,264 subminuette wave iii would reach equality in length with subminuette wave i. Subminuette wave iii should show a clear strong increase in upwards momentum beyond that seen for subminuette wave i. It may only subdivide as a simple impulse.
If subminuette wave iii has begun then we need to see a clear five up on the hourly chart in order to have confidence in this wave count. So far there is only a 1-2-3-4, probably at submicro wave degree. Submicro wave (4) may not move into submicro wave (1) price territory below 1,230.92. A new low below this point confirms that the lasts upwards wave to the last high at 1,244.53 is over, and was a three wave structure.
This analysis is published about 2:34 p.m. EST.
Lara does this change your gdx target?
Elliott Wave Gold Mod Richard • 19 minutes ago (answered about 2:20 pm)
Its not quite done yet Richard, I think its in its fourth wave now. I don’t have a target for you sorry, because it won’t exhibit a ratio to subminuette wave i (but it will be longer, a little) and I can’t calculate a target for it to end at micro degree because micro wave 4 is unfolding now. But it will move higher.
There’s not a lot of room left now for upwards movement if that maroon trend line provides the strong resistance I expect it to. Upwards movement is coming to an end, faster than I had anticipated. The structure is close to complete.
•
Reply
•
Share ›
Yes I may have jumped the gun this morning. We’ll see
Anyone strongly considering that Intermediate Wave 2 is complete, right here right now?
I guess wait for 3PM update from Lara???
Intermediate wave 2 is not over yet. Check Lara’s answer to me below.
Beside int 2 what did you get from her reply. wave iii over and it is in wave iv.
pls explain in no ew term. thks
I am unclear about her response
Maybe third wave is over and we are in the fourth wave and hard to calculate top target yet because no clear Fib ratio to use from fourth wave and that short term rally may be over sooner than she expected.
I guess that Intermediate wave (2) will finally end very soon as very close to Maroon weekly channel on daily chart that will act as strong resistance to end this short term rally for good. Then down gold goes very soon in intermediate wave (3) (4) (5) to $957 by Spring. My interpretation.
I just sold my miners for decent profit and bought a gdx put exp in early Feb. Getting too volatile and as Lara pointed out not much more room to run. for now?
Sold half of my GDX in pre-market and the rest at 9:46 am basically for the same price, thought I’d check if gold went up after the open, it went up some but stalled temperarily and so did GDX so I sold. Glad I made profits on the 4 different GDX purchases I made Tuesday and Wednesday. Now I wait for Lara’s forecast on where subminuette wave iv ends so i can buy GDX back to sell at subminuette wave v final high of intermediate wave (2) short term correction any day now.
Apparently because gold dropped in the morning and bounced up that with gold at 1262 there is almost a new normal high gold price and the miners really jumped today GDX up 6.45% astounding. NUGT up 18.89% at 1:04 pm. I shouldn’t of sold so soon this morning, but I still made good profits anyways and will make new trade based on Lara’s update today.
Any plan to buy DUST??? wave iv is baked in already??
But the wave iv needs to be multi day correction.
Are you thinking that today is final peak for intermediate wave (2) or just for subminuette iii ?
I wouldn’t think that subminuette wave iv has happened yet today or definitely not finished.
Normally I might buy DUST
However Swiss action is a HUGE risk event and may be a game changer in ways I may not understand. I need to have predictable probabilities to buy any 3X ETF. Today I can’t make any decision to buy until I get Lara’s analysis and overnight could be more dangerous than usual if you make the wrong decision. Yesterday I buying GDX while highly convinced it will head up over night. I am not able to say which way gold and the miners will go overnight. So I wait for Elliott Wave GrandMaster Lara to enlighten me on the mysteries of Gold and it’s next moves and possible revised upper and lower targets and at what point in the wave pattern gold is at right now.
Rule # 1 in Elliott Wave, When in doubt wait for Lara.
Thanks for insight. It is a huge news about Swtzd. Bullish for gold world wide gold bugs.
Hello Lara,
Can that be that minuette wave c is unfolding as an expanding diagonal and now the price is finishing the last 5th wave?
Thanks in advance
here is the chart. each wave seems like divides as a three perfectly
No, because the fourth wave does not overlap first wave price territory, its far away.
Gold high of the day (so far) 1,266.82 at 11:15
Right on with Lara’s projection of about 1226.10 plus $40 = 1266.10
Lara mentioned third wave length about $40 in length so add that to bottom of subminuette wave ii at 1226.10 at 1:36 am, which gives a truncation of 96 cents because gold didn’t drop down to either just below 1,225.15 or possibly down to 1,220 at the most, (1,226.10 is just 96 cents from upper target of 1225.14.) Under main hourly wave count analysis Lara mentions, “Micro wave C may end slightly below 1,225.15 to avoid a truncation
“If this second wave correction is deep then the third wave up to follow it may only reach equality in length with the first wave at about $40 in length. The following fourth wave correction should be deep, and the final fifth wave up may be shorter than the first and third waves.
Anyone can check were at wich level the price touch the downward trendline (wave 2 to wave 4), on the daily chart? Thanks
1142.88 & 1167.44
This will give you a rough idea of what I mean with respect to my last post…
Any comments..?
Is GDX finished / topped out / complete?
Question for your EW gurus (which also shows how little I know about EW). Take a look at live GDX chart, GDX at 21.33 is slightly below what I thought was the 3 wave high 21.76 set Monday. According to EW can this 5 wave end below the 3 wave? Or is GDX just pausing for another run up?
From an EW perspective, I think either is possible. There is where it helps to have some other methods to try and get confirmation of an idea.
For entertainment purposes, I’ll attempt wavecounts assuming subminuette iii has to use much more time. Micro (1) length was about $35. Micro (2) started with a zigzag to retrace about 38.2%. Right now the market is trying to decide whether micro (2) will evolve into an expanded flat or double zigzag or whether it will embark on micro (3). If Micro (2) is over and Micro (3) turns out to be the same length as micro (1), micro (3) would go over 1280. If micro (2) continues lower, then the target would be lower than 1280.
There are a lot of big money shorts in this market. Beads of sweat are starting to appear on their brows. If they panic and cover, the rise will be quick, violent and likely get retraced once over. That event could conveniently mark the end of Lara’s minor C.
The above are my opinions and I am not an expert. Comments and corrections are welcome.
Miners appear to be sitting on the fence post…
As long as miners do not do what birds do, I am okay.
An updated count: in miniscule 3 of submicro 5 of micro (1). Submicro 5 has already exceeded the length of submicro 1, so I have no guess on a target. After submicro 5, correction could be deep zigzag.
Hehe..
What I am calling submicro 5 has a lot of overlap so maybe it is an ending diagonal. If so, it is getting long in the tooth.
Yes there are some big shorts, but the last Gold COT reports showed that the large speculators have actually been increasing their longs on a NET basis on the Comex.
I watch that category for its sentiment and impact on the longer time units, but it’s definitely not a timing tool.
With thia max at 1263,90, If the daily count is correct, we need downward movement but not down to 1244 and then another max to end minuette c within minute 2.
Richard
Thanks for pmbull site.
Is there a setting for session time. I need to keep refresh the page more often.
No settings for session time that I ever found. Sometimes I have 8 windows open with pmbull one each from hourly down to 1 minute and once in a while I look for trends.
Surprise Swiss news may be trigger for gold after mainstream investors digest news. Usually a delayed reaction, be careful.
Or may make sharp correction down…
Is shorting gold at 1260ish or 1270ish levels a good idea?
Lara, I have a concern with micro C truncating. Could micro B & C of our expected flat correction become an embeded 1,2 as a result? This will impact the third wave up?
I was concerned with that too. I have a new analysis of subminuette wave ii for you today which neatly avoids the truncation, and which I wish I’d seen yesterday.
Don’t have my computer in front of me at the moment… Confirm, wave 3 is shorter than wave 1. ?
Anyone?
This will limit wave 5 so that 3 is not the shortest wave. And if wave 5 were to exceed…. We’ll have problems. Looks good so far.
So far, subminuette iii is shorter than subminuette i. However, iii is maybe not over yet. 39.26 for sub i and 34.73 for sub iii, according to my data feed. However, even if iii goes up a little more, it does seem likely that sub v will be shorter than iii.
Well done!!
Yes sub 3 ( 38 usd ) is shorter then sub 1 (39,59 usd )
I’m very new to this board but, have already made profits using Lara’s calculations. As late as November 28th she had a price target of $1281 to end the final wave (c) up. Is there a technical reason why that target cannot be reached? Thanks in advance.
Gordo
Welcome to the board. Profit!!! Can you share your trading plan? I was struggling to make trade in this whacki wave 2.
just the hint???
Based on Lara’s posts I sold JDST yesterday and bought JNUG at 34.70. The big question now, is the up move over? The ECB will make a big move next week (at least the Swiss are betting they will), the dollar is up big and oil is down big. If all events begin to equalize, will gold be pushed higher? IDK
You posted on Nov 28th that $1285 could be the back test for gold. Still have that opinion?
I think we could see a price well above $1262 but, I’m not the technician that you and Lara are.
The reason is that upper maroon trend line. Look at that channel on the weekly chart, we’re almost there.
Any new calculation? Expecting to go up more? How high should it be?
a new high above $1261 will complete subminutte iii and may happen in 1-3 hrs from now. My guess is it will make a slight new high around $1262-$1263.
Corrections for subminuette iii show up clearly on a 5 minute chart. Looks to me like gold may have just completed a 4th wave within subminuette iii, so your estimate seems reasonable.
Yes and I expect subminuette iii to be shorter than i which means v will be shorter yet. However, this fits perfectly in the big picture where int 2 should not breach maroon trendline which sits around $1275ish today.
Lara has wrote repeatedly that 1262 will not breach. OR it may breach slightly but not close above. What is that TL ??
Is it reasonable that subminuette i took 8 days and subminuette iii takes less than one day? What is the chance we just saw micro (1) of subminuette iii? If so, it would be reasonable for micro (2) to be a deep zigzag. That would burn the most people.
The subminuette iv correction has to stay above the end of subminuette i in the 1244 area.
It took only a few hours for subminuette iii to peak today thanks to Switzerland this morning.
Any guesses on what Gold price will be at the open 9:30 am and if gold will spike up quick or go up strong the whole day or will drop fast?
Looking to sell my GDX at the most profitable time possible. Or maybe buy more fast at the open?
GDX is up in pre-market. Looks like its going to be a wild ride today. I’m selling my GDX today, I’ve gotten burned too many times being a little greedy and Fridays have been tough for gold recently..right?. I’m also thinking of shorting oil today. Thoughts?
Gold already at 1261. Wave iii not done yet.
Please can anyone calculate projected high subminuette wave iii ASAP?
Gold up at 1261.01 at 6:22 am. 4:30 am Switzerland’s dropped Franc cap and gold surged and has been strong since.
At 1:36 gold dropped to 1,226.10 and needs to go either just below 1,225.15 or possibly down to 1,220 at the most, (1,226.10 is just 96 cents from upper target of 1225.14.) Under main hourly wave count analysis Lara mentions, “Micro wave C may end slightly below 1,225.15 to avoid a truncation and a very rare running flat. It may move slightly lower to close to 1,220 to reach down to the 0.382 Fibonacci ratio.” so at this time there is a truncation of 96 cents.
In video Lara advised that once subminuette wave ii ends that she will calculate the top of subminuette wave iii. In analysis is mentioned “A target for the third wave up of about $40 in length will be calculated once subminuette wave ii ends.” I am not sure if this would be exact to calculate top of subminuette wave iiias it would take gold up to 1266.10, which sounds incorrect.
http://www.MarketWatch.com Jan. 15, 2015, 5:42 a.m. EST
ZURICH–The Swiss franc rocketed beyond parity with the euro on Thursday after Switzerland’s central bank stunned markets by scrapping its long-standing cap on the strength of the currency. The franc surged more than 20%, ending more than three years of calm in Swiss… Full Story
http://www.bloomberg.com/news/2015-01-15/europe-stock-index-futures-jump-indicating-equities-to-rebound.html
Actually swissy spiked twice as much as bloomberg says.
Look at the data feed & range; usd/chf reached 0.71 (ie., 40% gain for chf) after the SNB, before settling below 20% later. Wow, we’ve never seen a currency move like that b4.
There will be ramifications. Between this and the oil crash (and maybe $2 copper next?), there’s likely some leveraged derivatives blowing up somewhere. Scary.
Its not quite done yet Richard, I think its in its fourth wave now. I don’t have a target for you sorry, because it won’t exhibit a ratio to subminuette wave i (but it will be longer, a little) and I can’t calculate a target for it to end at micro degree because micro wave 4 is unfolding now. But it will move higher.
There’s not a lot of room left now for upwards movement if that maroon trend line provides the strong resistance I expect it to. Upwards movement is coming to an end, faster than I had anticipated. The structure is close to complete.
Lara the last post on gold called for gold to go higher. A fabulous call by you.
Bravo!!!!!! Excellent job .
Every statement came in as written.
Two days of red candles and move above 1244!!!!
You are the best.!!!!!!!
The chart pattern HnS of gold and GDXJ worked very well.
Indeed, those great calls.
Yes hitting that HnS neckline for a 3rd time did it, hurray 🙂
I see main hourly is validated However.
Does gold still have to reach “target just below 1,225.15 or 1,220.?”
Gold went up to 1,244.48 Wednesday am but still had to come back down to finish the job with “target just below 1,225.15 or 1,220”.
Is that a must that we have to wait for until gold can rally today?
Or is 1,227.12 at 8:02 pm close enough to finish subminuette wave ii?
If not close enough, than I’m looking for gold to get the job done preferable just before open Thursday morning and then gold rallies all day to the high before close in subminuette wave iii and GDX rockets up and I sell it before close.
“Third wave up to follow it may only reach equality in length with the first wave at about $40 in length.” In main hourly wave would subminuette wave iii high be at $1,264 just like in the alternate hourly?
Looks like we got the answer.
Credit (or blame) switzerland. Wow!
Look at the gold price in CHF, lol… Huge new lows
Trading this int (2) has not been successful due to choppy nature of this wave.
Hope to benefit from the int(3) down once it get going.
Yes, absolutely!…
As you know, int (3) should be bigger prize!
Wish you good luck and fortune too then 🙂
Diagonals are horrible. They’re hard to pick, and hard to trade. This minor wave C has been pretty awful, the only thing I was confident of during it was that the trend was up.
Int (3) may only be an impulse. Hopefully minor wave 1 within it is a clear impulse, not a leading diagonal.
Now gold will go in wave iv a shallow correction before going higher or that al ready happened?
Yes, good question, it would be nice to have more clarity on that.
Will do.
Gold daily HnS with two red doji right at the neckline. It appears if a white (green) candle with impulse to be expected it may happen with gold open in COMEX hour at lower and rise tomorrow which will cover the full range of both doji. OR if during night hour if gold rises than NY time Comex will have a gap up white candle.
Third may be another red candle and gold may wait for Friday.
Thank you Lara for the timely update and hello traders.
My 2 cents, breifly… The short-term is ambiguous and best to step aside unless you like gambling. There are conflicting indicators (indeed Lara’s main and alt are 50/50). For example, there is currently a clear hns on the 4hr. I previously mentioned the inverted hns on daily but gold is below the neckline, tho gold holds above the significant trendline connecting the Oct & Dec highs. Bollinger bands are converging and gold is now within the BB at longer time units. Silver, after pulling gold up Monday with its 3% spike, is down 2 days, and is side-stepping its aforementioned TL now around 16.9 without the daily silver candle standing above that.
So all-in-all, IMO it’s a mixed bag with heightened uncertainty. My trade here be no trade, tho if pressed I’d maybe lean bearish short-term (eg., Lara Alt) but remember to employ good money mgmt/risk practices as always.
Good luck all.
I would only get concerned with sustained trade below $1220. I wouldn’t worry about indicators right now. Main hourly wave count validated and I would expect gold to be much higher in 24 hrs.
I like you Sir Chapstic_Jr. for your optimism. Getting comments from EW like you is encouragement for me EW novice. I do not have any experience and understanding of varoius waves. So I rely on others to provide some insights.
Thanks.
Chapstick
I see main hourly is validated However.
Does gold still have to reach “target just below 1,225.15 or 1,220.?”
Gold went up to 1,245 Tuesday night but still had to come back down to finish the job with “target just below 1,225.15 or 1,220”.
Is that a must that we have to wait for until gold can rally today?
Well the SNB surprise of the century took it all.
CHF climbs 43% against US dollar in just seconds.
The corresponding spike in XAU and XAG is surprisingly tiny.
Congratulations to all who were short USDCHF or EURCHF and short Gold in terms of CHF.