
It is entirely possible that we could see one final wave up. I have a new hourly alternate Elliott wave count for you.
Note: I am unable to upload any video today. My internet connection is limited. I will ensure that the text below is thorough. I will have a better connection tomorrow. Thank you for your patience.
Summary: I am expecting a trend change either now or very soon. First confirmation would come with a new low below 1,244.34 and a clear breach of the orange channel on the hourly chart. Stronger confirmation would come with a clear breach of the green channel on the daily chart. This is a big trend change and patience is essential.
Click on charts to enlarge.
Main Daily Wave Count
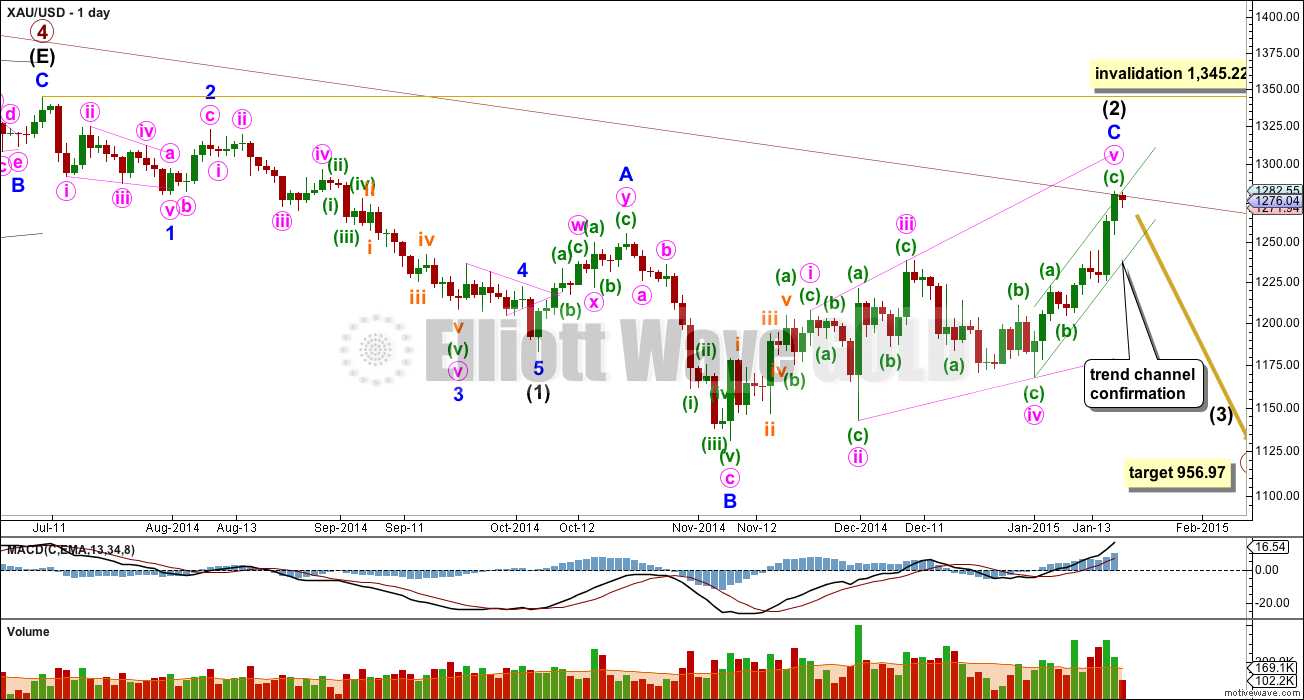
Within primary wave 5 intermediate wave (1) fits perfectly as an impulse. There is perfect alternation within intermediate wave (1): minor wave 2 is a deep zigzag lasting a Fibonacci five days and minor wave 4 is a shallow triangle lasting a Fibonacci eight days, 1.618 the duration of minor wave 2. Minor wave 3 is 9.65 longer than 1.618 the length of minor wave 1, and minor wave 5 is just 0.51 short of 0.618 the length of minor wave 1. I am confident this movement is one complete impulse.
Intermediate wave (2) may not move beyond the start of intermediate wave (1) above 1,345.22. I will today publish an alternate which will be the main wave count if this invalidation point is passed.
Intermediate wave (2) is now a complete expanded flat correction. Minor wave C is longer than 1.618 the length of minor wave A, and there is no Fibonacci ratio between them. Minor wave C is either a complete expanding ending diagonal, or one final small fifth wave up may yet unfold to complete it.
Within an ending diagonal all the sub waves must subdivide as zigzags. The fourth wave should overlap first wave price territory. The rule for the end of a fourth wave of a diagonal is it may not move beyond the end of the second wave.
Within the final zigzag up of minute wave v minuette wave (c) does not look like a clear five wave structure on the daily chart, and looks like a three. I have a new alternate hourly wave count for you today which requires a small final fifth wave up to make this structure look more typical on the daily chart.
Draw a “best fit” channel about minute wave v zigzag. When this green trend channel is clearly breached by a full daily candlestick below the lower green trend line and not touching it, then I would have a lot of confidence that there has been a trend change at intermediate wave degree. Only a new low below 1,131.09 would provide full and final price confirmation that downwards movement is intermediate wave (3), but we should be alerted to it before that price point is passed by looking at structure and momentum. Intermediate wave (3) may only subdivide as a five wave impule, and it should show a clear strong increase in downward momentum.
Draw the maroon trend line on a weekly chart on a semi-log scale, and copy it over to a daily chart also on a semi-log scale (see this analysis for a weekly chart). If this wave count is correct this maroon trend line should provide very strong resistance, and upwards movement should end here or with only a small overshoot. If this trend line is breached by a full daily candlestick above it and not touching it then this wave count would substantially reduce in probability and I would take the new daily alternate below much more seriously.
Main Hourly Wave Count
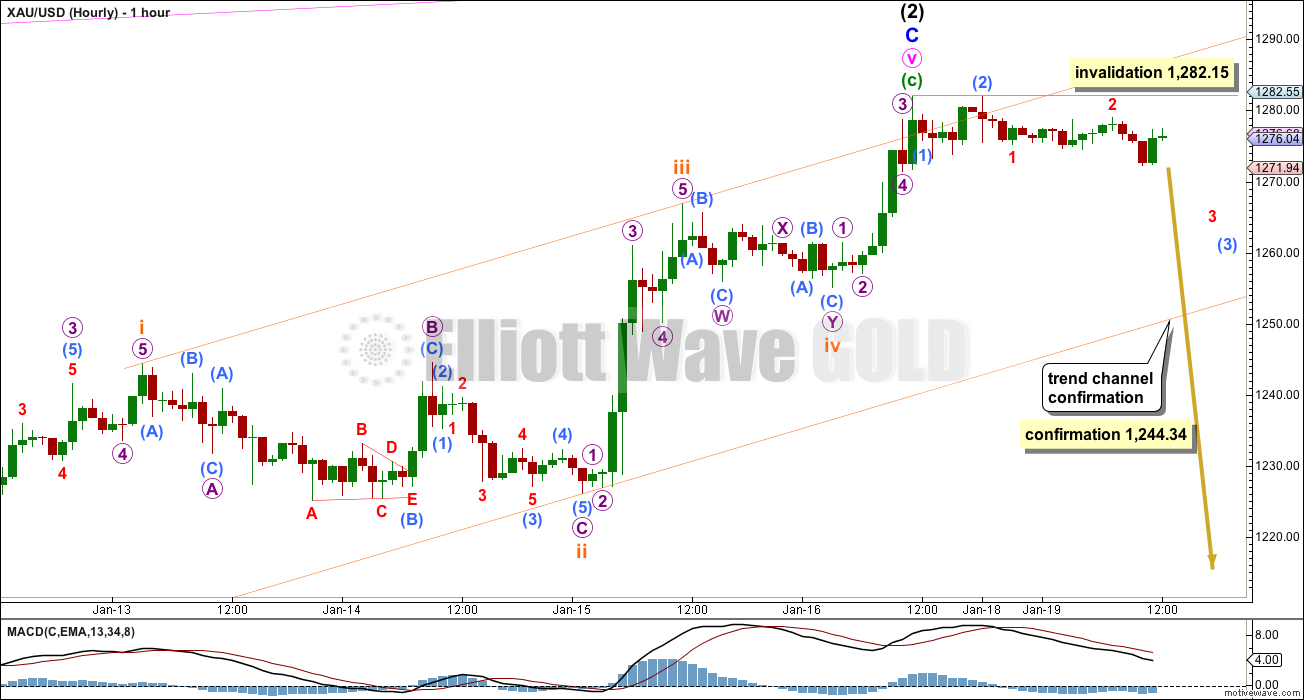
It is possible that intermediate wave (2) is over at all wave degrees. However, within the last upwards zigzag of minute wave v minuette wave (c) looks like a three and not a five on the daily chart. For this reason I have the alternate hourly wave count below.
Ratios within minuette wave (c) are: subminuette wave iii is 1.07 longer than equality with subminuette wave i, and subminuette wave v is 1.86 longer than 0.618 the length of subminuette wave iii.
If intermediate wave (2) is over then intermediate wave (3) down should follow. This wave count requires confirmation before I have any confidence that there has been a trend change at intermediate wave degree. A new low below 1,244.34 and a clear breach of the orange channel here on the hourly chart are required. Thereafter, a clear breach of the green channel on the daily chart would provide confidence that the trend is down, at least for the mid term.
Alternate Hourly Wave Count
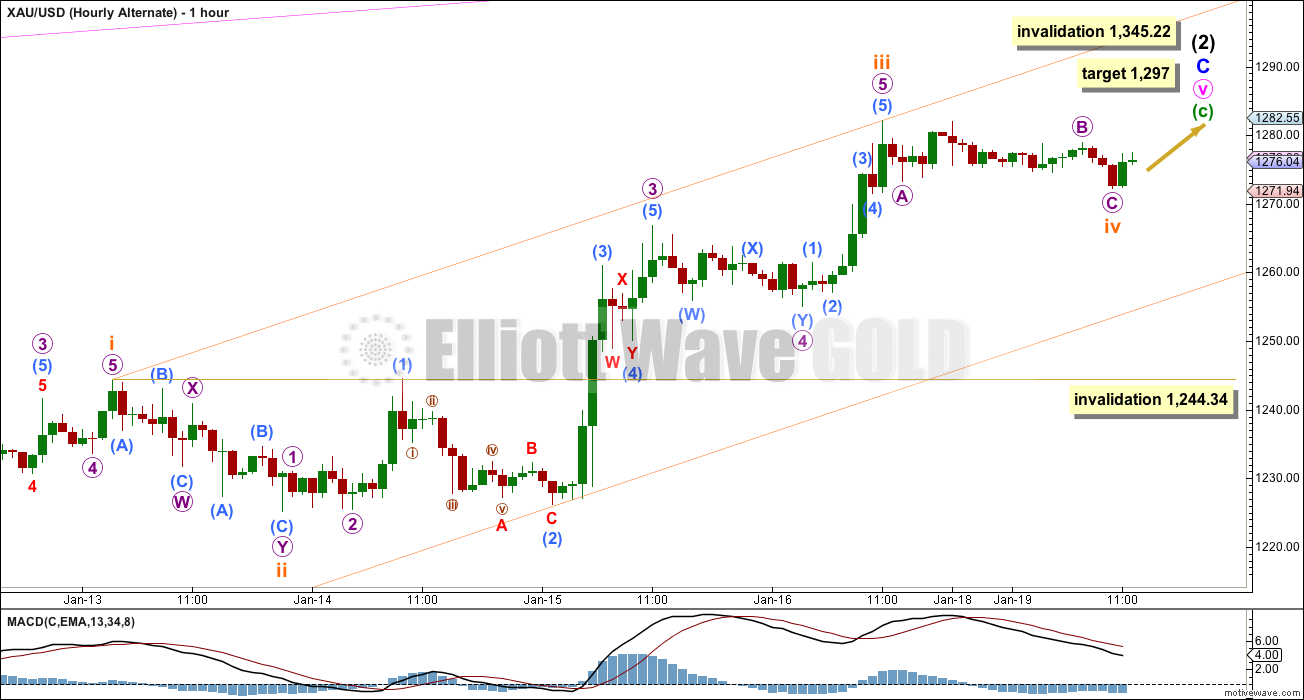
It is possible that minuette wave (c) will have one final last fifth wave up to give it a clear five wave look on the daily chart.
Within minuette wave (c) subminuette wave iii has no Fibonacci ratio to subminuette wave i. At 1,297 subminuette wave v would reach 0.618 the length of subminuette wave i. This is the ratio I am using to calculate the target because I would expect a short fifth wave, because there should be very strong resistance from the maroon trend line on the daily chart.
Subminuette wave iv may not move into subminuette wave i price territory below 1,244.34. A new low below this point would indicate that minuette wave (c) is complete, and this price point will remain as a confirmation point even if this alternate hourly wave count is correct and we see a final fifth wave up unfold.
Alternate Daily Wave Count
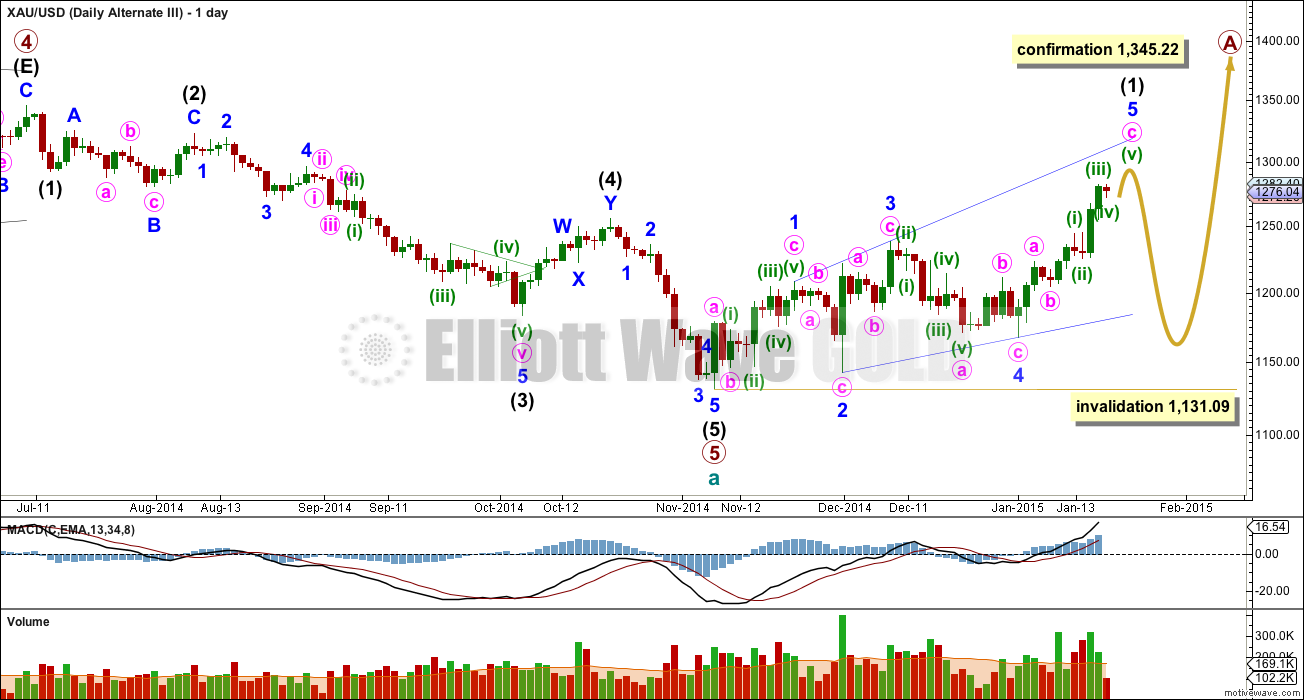
If price breaks above 1,345.22 this would be my only wave count. Prior to a new high above that point it will remain an alternate, or at best at even probability with the main daily wave count.
If primary wave 5 is over, then within it the problems of a lack of alternation and Fibonacci ratios can be resolved. But other problems are introduced which keep this wave count at a low probability.
Intermediate wave (2) is a rare running flat. This is entirely possible just before a strong third wave, with the downwards pull of a third wave forcing minor wave C to be slightly truncated. However, within intermediate wave (2) minor wave C looks clearly like a three wave structure on the daily chart and this is a considerable problem. If you’re going to label a running flat it is essential that the subdivisions fit perfectly. This reduces the probability of this wave count substantially.
Intermediate wave (2) is a 58% correction of intermediate wave (1), and is a running flat. Intermediate wave (4) is a 52% correction of intermediate wave (3) and is a double zigzag. There is little alternation in depth, but now perfect alternation in structure.
Ratios within primary wave 5 are: intermediate wave (3) is just 1.09 longer than 2.618 the length of intermediate wave (1), and intermediate wave (5) has no Fibonacci ratio to either of intermediate waves (1) or (3). The problem of a lack of Fibonacci ratios that I previously had for this idea is now resolved.
Intermediate wave (5) still looks like a zigzag rather than an impulse, and has a corrective wave count. This also reduces the probability of this wave count.
It is entirely possible that we are seeing a leading expanding diagonal coming to an end as the first five up within primary wave A. If there is one final fifth wave up that would complete the structure as per the alternate hourly wave count, and it would have a typical look on the daily chart. For diagonals the contracting variety is more common than expanding, and ending diagonals are more common than leading. While a leading expanding diagonal is not rare, it is not very common either. This very slightly also reduces the probability of this wave count.
Leading diagonals are almost always followed by very deep second wave corrections, often deeper than the 0.618 Fibonacci ratio of them. When this structure is complete with a final fifth wave this wave count expects a big deep correction downwards. We may not have clarity between this alternate and the main wave count for several weeks for this reason. The structure of downwards movement would clarify: the main wave count needs an impulse down for third wave while this alternate needs a corrective structure downwards.
When the leading expanding diagonal is complete then intermediate wave (2) may not move beyond the start of intermediate wave (1) below 1,131.09.
Silver Daily Chart
This wave count has a good fit.
For Silver minor wave 2 may be an almost complete double zigzag. Only a final fifth wave up may be required. This fits perfectly with the alternate hourly wave count for Gold.
I still have more work to do for alternate ideas for Silver, and I should be ready to publish a full separate analysis for Silver later this week.
This analysis is published about 2:35 p.m. EST.
The EW counts and signals can forecast and are more important that the T/A indicators and signals, which are not able to forecast. In my opinion so I don’t put much weight in the T/A indicators.
That may (or may not) be true but only if a particular EW count is right. Sometimes that is not possible to know until after the fact. I suspect there may be an issue with our main wave count, but it could still work out.
The tape has recently been and is currently bullish. There could still be a reversal right here. But IMHO that really remains to be seen and I don’t see any ominous patterns developing that one might usually see upon an imminent major trend change. Not yet anyway
Indeed there is no silver bullet.
A very few technical models have made people rich, but those are proprietary. For example, Jim Simons made billions in the market from his own private mathematical model based on chart pattern recognition.
I think trendline analysis is another good TA tool for a traders’ repertory, as in the trading forums that seems to be what some of the best use. Although not difficult to start with, it’s nevertheless an art that takes years of experience to master.
But if you have a system that works for you and manage your risk, then you’re ahead in the game.
I don’t yet. Still definitely working on it
Daily candlestic chart looks very bullish. A small body red candle between two large green (white) candles. It has potential to move to 1320.
However if tomorrow if a bearish engulfing develops than outlook for gold may change.
Hi. That’s what I am thinking with 1286 currently holding and downside risk 1277-76-74…. I hope the big test
of must reverse from 1297-98 works; Gold price looks to be heading for a high range close today indicative of upside continuation higher with the risk of a break above 1300 looking imminent! Tomorrow is another day. Good luck all!
Thanks for the excellent gold & silver post.
Why can’t gold have just ended its 3rd wave? Prefer outlook of daily alternate, which looks better from a TL analysis perspective.
Today comex gold turned right at the Gann 3×1 trendline. There is major support in the 1260-70 range incl Gann 1X2. A close below that and especially <1240 would change the picture from overall bullish back to bearish. Unless that happens, viewing a correction towards 1270s as a long entry opportunity with SL <1240. Still hold long & strong from 1150-1170. Today is not Time for a major turn on intermediate (weeks-months) time unit. Monthly and weekly candlestick pattern shows reversal.
Silver also hasn't reached its top.
Interesting article and includes today’s Head and shoulder gold chart.
I would disregard the bulls are in charge part.
Technical Trading: Gold Bulls Are In Charge Of Trend, Bottom Pattern Seen
By Kira Brecht of Kitco News Tuesday January 20, 2015 10:05 AM
http://www.kitco.com/news/2015-01-20/Gold-Bulls-Are-In-Charge-Of-Trend-Bottom-Pattern-Seen.html
Good day all! IMHO: Gold price firstly spiked through 61.8% of 1392/1130 at 1292 with ease before falling back and taking second wind, likely now to seek 1302-05…. Lets wait and see!
Those were just Elliott Wave standard up and down movements. Good luck with 1302-05. I’ll stick with Lara alternate target $1,297.
Thanks Richard: I am following the EW standards, that’s why I am here….Lara’s accuracy is fascinating to say the least. Just trying to be cautious about upside risk of a break above 1300…. 🙂
You may have made an error in your 61.8% at 1,292
“At 1,297 subminuette wave v would reach 0.618 the length of subminuette wave i. This is the ratio I am using to calculate the target because I would expect a short fifth wave, because there should be very strong resistance from the maroon trend line on the daily chart.”
Gold just hit high of $1,297 Lara’s alternate target high at 11:46 am. I just bought more DUST at day low.
I added to my JDST position at $6.90 as well.
Added again at $6.93
Prosperous trading. Today’s analysis and video both look bearish including the alternate daily wave count, both expecting a couple of weeks down.
I’m looking at DUST what is it exactly?
DUST is a daily 3x bear etf for GDX. If GDX goes down 1% than DUST will go up 3%. and vice versa.
Very risky not for buy and hold. Must trade and take profit.
Interesting ty
Is not too early ?? Must have confirmation that wave 2 is over.
I added though DUST.
I also bot NUGT PUT option 9 m0nths out.
papudi
It is early. However I took a small position in DUST and will increase it as the various confirmation points and trend lines are passed as gold drops.
Yes DUST is usually a day trade, however I am looking to hold it until the beginning of the next significant EW correction wave that would move back up then I sell DUST.
Gold upper target is 1297 and it only hit 1294.22 at 4:28 am then it hit 1,293 at 9:51. I am still expecting gold to hit 1,297. Any EW experts with any different viewpoint as of 10:10 am or think that 1294.22 will be the peak?
c=1.618*a almost to the penny with signs of a reversal! Big divergence in MACD and possible impulse down from the high. Something to keep a close eye on
If wave iv within this c wave end at 1271,97, it seems that we need another max or two……
c=1.618*a almost to the penny with signs of a reversal!
Please clarify that? Will gold still go to 1297?
As I am looking to buy more DUST now or then thanks.
Last night gold put in HnS in 5 min period. This early hour it broke and is now at 1294. Now alternate hour count is main count.
Hope this will end here and by end of the day gold will reverse and wave int (2) C will be over.
Volumen is very interessing. Potential revers is very possible
Hi. My main count is different but i see potential revese.
I am not good like Lara but I try 🙂
Yes I agree Lara is the best EW analyst. Your counts sound good to me. EW novice.
Your wave counts began at 1392. What is the count from 1923 to down here?
My main count.
The first wave is a three wave movement. First waves may only subdivide as fives. So if you want to go with that count you need to check the subdivisions within that first wave very carefully indeed on a daily chart.
Check where you have that fourth wave ending. There is a triangle there.
IV overlaps into I…simply doesn’t work
Your count seems incorrect. When impulse waves unfold as 5-wave moves then the 4th wave cannot trade in the territory of the 1st wave which happens in your count.
In my analyse wave 1 and 5 possible territory. In wave 3 never 4 terittory 1
Danil is correct. Although your subdivisions are very good, you have IV within wave I price territory which breaks a core EW rule. No part of a fourth wave may enter any part of a first wave within an impulse. And an impulse is what you’re labelling.
There is another problem actually. Within your wave IV you have an A wave which looks like a clear three wave movement. Then the B wave down also looks like a clear three. When A waves subdivide as threes that indicates a flat correction, within a flat the B wave must retrace a minimum 90% of wave A. In this case the B wave is well less than 90% the length of the A wave.
That idea is one that takes a little while to get your head around. Keep posting your analysis and I’ll keep giving feedback until you’re doing it all right by EW rules.
Thx. i still learnig 🙂
$1,284.81 at 3:34 am EST Tuesday not Monday invalidated main hourly wave count. Now use alternate hourly wave count next target 1,297.
The main hourly wave count was invalidated with movement above $1,282.15 at 3:34 am EST Monday, when gold hit $1,284.81.
Now the alternate hourly wave count becomes the main hourly wave count.
The next target for gold is at $1,297 to end intermediate wave (2). $1,297 may get high overnight as gold is already at $1,292.86 at 3:59 am EST. Then gold continues back down in intermediate wave (3) to finish primary wave (5) and the gold bear market at $956.97.
At 9:30 PM EST gold broke the neckline of HnS in 5 min period above 1277. If there to be a trend change by morning gold needs to trade below 1274( below RS) to negate the HnS. IMO.
Lara, I have a question regarding the hourly alternate. Is there a point when you would consider the fourth wave to be lasting too long to be in proportion with the second wave? Hypothetically speaking, what if gold grinds sideways/lower over the next 48 hours but stays within the orange channel? Would that wave still have the right look and be acceptable, or would you discard it? Thanks.
Fourth waves are usually contained within the channel, but not always. So even if it moves below the channel it could still be the fourth wave.
So far I have subminuette wave ii lasting 17 hours and subminuette wave iv over now in 23 hours. But it could continue sideways yet and still remain within the channel, its only just over 1/2 way past.
Lara, good call as you mentioned 3 hours ago, “So far its only sideways, and looks very corrective, so the alternate is looking better.”
And you were right.
and now… the big test for this main preferred wave count begins. It MUST reverse from here. Its right at its limit, it can’t go higher for one more day or it will breach that maroon trend line.
Good call indeed! Thanks.