
The main hourly wave count was invalidated with a new high, and at that stage the alternate wave count was confirmed. The target for upwards movement to end for the alternate was 1,297. That has now been met.
Summary: Both the main and alternate daily wave counts expect downwards movement from here, and both expect a trend change at intermediate degree. The depth, structure and momentum of downwards movement will tell us which wave count is correct in coming weeks.
Click on charts to enlarge.
Main Daily Wave Count
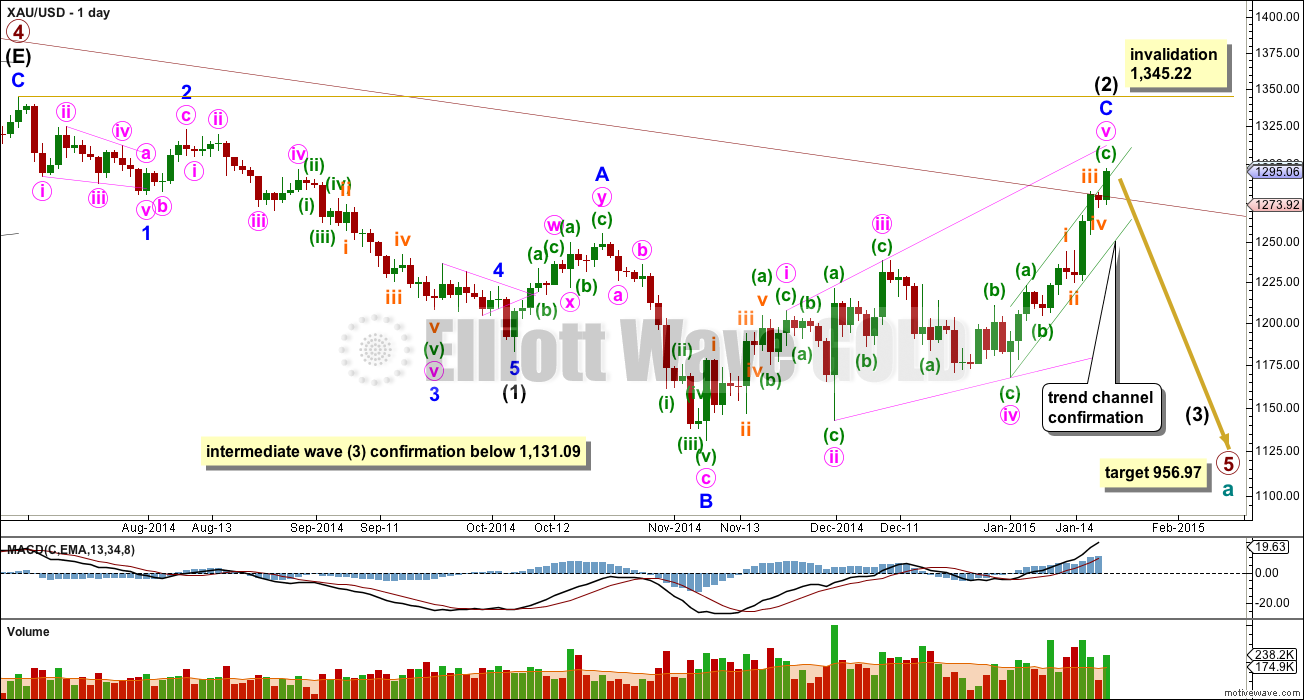
Within primary wave 5 intermediate wave (1) fits perfectly as an impulse. There is perfect alternation within intermediate wave (1): minor wave 2 is a deep zigzag lasting a Fibonacci five days and minor wave 4 is a shallow triangle lasting a Fibonacci eight days, 1.618 the duration of minor wave 2. Minor wave 3 is 9.65 longer than 1.618 the length of minor wave 1, and minor wave 5 is just 0.51 short of 0.618 the length of minor wave 1. Although I am still confident this movement is a complete impulse, the alternate wave count is also reasonable (but has a lower probability).
Intermediate wave (2) may not move beyond the start of intermediate wave (1) above 1,345.22. If this invalidation point is passed this main wave count would be invalidated and the alternate daily wave count would be confirmed.
Intermediate wave (2) is now a complete expanded flat correction. Minor wave C is longer than 1.618 the length of minor wave A, and there is no Fibonacci ratio between them. Minor wave C is either a complete expanding ending diagonal, or one final small fifth wave up may yet unfold to complete it.
Within an ending diagonal all the sub waves must subdivide as zigzags. The fourth wave should overlap first wave price territory. The rule for the end of a fourth wave of a diagonal is it may not move beyond the end of the second wave.
Within the final zigzag up of minute wave v minuette wave (c) now looks like a clear five wave structure on the daily chart. Minute wave v now has a clear corrective count of seven.
Draw a “best fit” channel about minute wave v zigzag. When this green trend channel is clearly breached by a full daily candlestick below the lower green trend line and not touching it, then I would have a lot of confidence that there has been a trend change at intermediate wave degree. Only a new low below 1,131.09 would provide full and final price confirmation that downwards movement is intermediate wave (3), but we should be alerted to it before that price point is passed by looking at structure and momentum. Intermediate wave (3) may only subdivide as a five wave impulse, and it should show a clear strong increase in downward momentum.
Draw the maroon trend line on a weekly chart on a semi-log scale, and copy it over to a daily chart also on a semi-log scale (see this analysis for a weekly chart). This trend line is now overshot. A clear breach with one full daily candlestick above it and not touching it would see this main wave count substantially reduce in probability. For this main wave count to remain my preferred wave count price must reverse here. If this maroon trend line is breached on the weekly chart, with one weekly candlestick above it and not touching it, then I would discard this wave count in favour of the alternate.
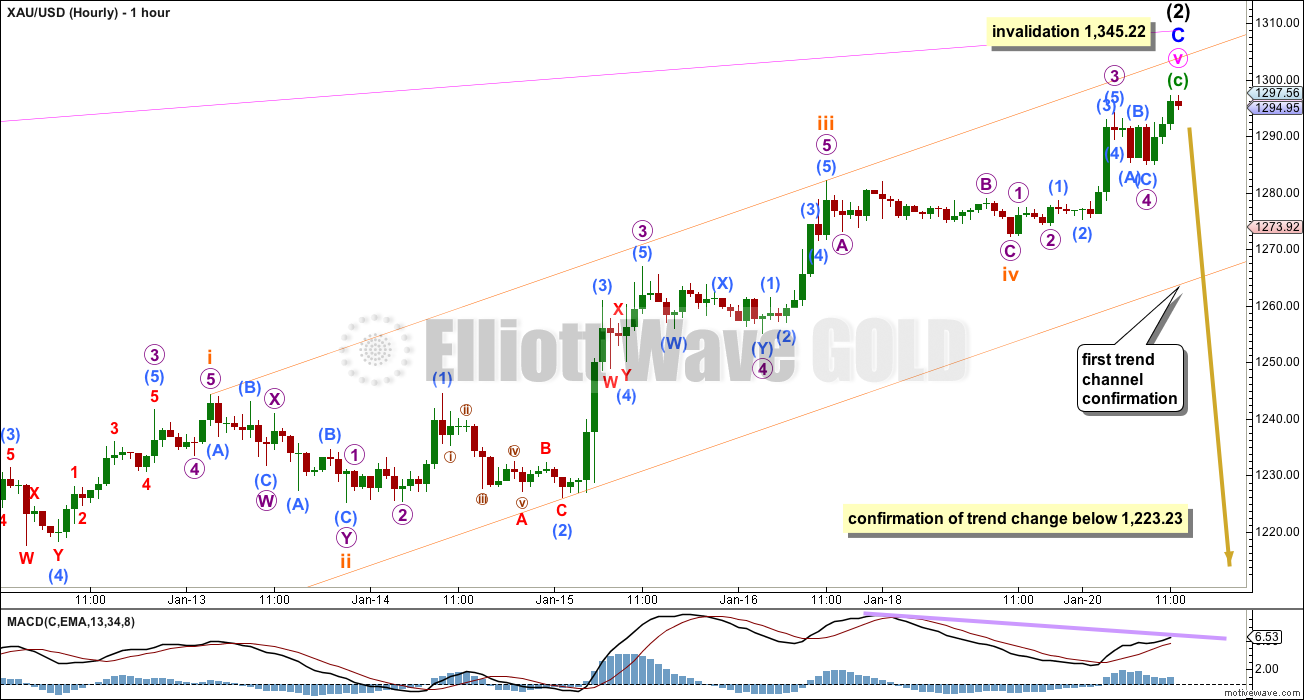
Minuette wave (c) is now a complete five wave impulse.
Ratios within minuette wave (c) are: subminuette wave iii has no Fibonacci ratio to subminuette wave i, and subminuette wave v is just 0.45 longer than 0.618 the length of subminuette wave i.
Draw a best fit channel about minuette wave (c). When this orange channel is clearly breached with downwards movement that would provide first indication that there has been a trend change. A new low back into minuette wave (a) price territory below 1,223.23 would provide strong price confirmation of a trend change, as that would eliminate the possibility that this upwards wave of minute wave v is a continuing impulse because price would be back in what would be its first wave territory.
Once the orange channel is breached I will move the invalidation point down to the end of intermediate wave (2) for this wave count. While we have absolutely no confirmation of any trend change I must allow for the possibility that this final fifth wave could continue higher today.
This wave count for minuette wave (c) fits perfectly with momentum. Subminuette wave iii exhibits the strongest upwards momentum. Subminuette wave v is showing divergence, while price moved higher momentum was lower. This is an indication of a possible upcoming trend change.
Alternate Daily Wave Count

Thank you to a member of EWG for posting a chart of this idea from another EW analyst.
If price breaks above 1,345.22 this would be my only wave count. Prior to a new high above that point it will remain an alternate, or at best at even probability with the main daily wave count.
Intermediate wave (2) is a rare running flat. This is entirely possible just before a strong third wave, with the downwards pull of a third wave forcing minor wave C to be slightly truncated. However, within intermediate wave (2) minor wave C looks clearly like a three wave structure on the daily chart and this is a considerable problem. If you’re going to label a running flat it is essential that the subdivisions fit perfectly. This reduces the probability of this wave count substantially, and this is its main problem.
Intermediate wave (2) is a 58% correction of intermediate wave (1), and is a running flat. Intermediate wave (4) is a 52% correction of intermediate wave (3) and is a double zigzag. There is little alternation in depth, but perfect alternation in structure.
Ratios within primary wave 5 are: intermediate wave (3) is just 1.09 longer than 2.618 the length of intermediate wave (1), and intermediate wave (5) has no Fibonacci ratio to either of intermediate waves (1) or (3).
Intermediate wave (5) still looks like a zigzag rather than an impulse, and has a corrective wave count. This also reduces the probability of this wave count.
It is entirely possible that there was a leading expanding diagonal as the first five up within primary wave A. For diagonals the contracting variety is more common than expanding, and ending diagonals are more common than leading. While a leading expanding diagonal is not rare, it is not very common either. This very slightly also reduces the probability of this wave count.
Leading diagonals are almost always followed by very deep second wave corrections, often deeper than the 0.618 Fibonacci ratio of them. This wave count expects a big deep correction downwards. It should subdivide as a clear three on the daily chart, where the main wave count now expects a clear five down.
Intermediate wave (2) may not move beyond the start of intermediate wave (1) below 1,131.09.
This analysis is published about 2:14 p.m. EST.
If this is a dumb question, or if someone has already asked this, please forgive me. However, is there a remote possibility that gold is still in primary wave 4? It is just that the current movement since 1130 (on the weekly chart) looks so similar to the final e wave up of primary 2. The implications of this are that the big channel would have to be redrawn. It would also mean that primary 4 is much longer in duration than primary 2. Nonetheless, it would allow for a drop to the $1000 or below area which my other analysis leads me to anticipate. The end of a multi year bear market should end with a bang (spike). Thanks.
Impossible gold is still in primary wave 4. Nightly Lara explains the end of primary wave 4.
I have heard the explanation for months as well and it always seemed plausible. Guess I am just having trouble accepting that gold didn’t end with a major spike. I always thought primary 5 would look much like primary 3, but a little shorter. That is, we would have major spikes down like in April and June of 2013.
I write about it early. In my opinion we have 4 wave, but it only my opinion.My chart ->
19th January
I looked at your chart and we’re talking about something different. I am looking at a weekly chart that shows movement from 2011 until the present. What Lara considers the end of primary wave 4 (the e wave of the triangle), could just be part of d down. We could now be approaching the end of the e wave and the end of primary 4.
That doesn’t make sense.
gld looking good here for ii at 50% retrace
I thought we’d go lower before 1345. maybe not.
Papaudi, we have well over 1 hr to get there, looking good!
Lara do you have an updated silver count? Thank you
Will be doing GDX and Silver today or tomorrow.
Hi Papudi
What level do we need to close beneath to be below the maroon line right now?
That is way down. Not today. The level from Lara’s daily chart is below 1273ish
However this wave count on daily stays for another week. Lara wrote above: ” If this maroon trend line is breached on the weekly chart, with one
weekly candlestick above it and not touching it, then I would discard
this wave count in favour of the alternate.”
Just like every one I am monitoring gold price daily to see if it will close below maroon line. As of now it is unlikely. But like to see a reversal candle of sort like doji etc. Then gold may close below the maroon line. ????
That shoud not change the count I believe.
Are we finishing up a 2nd wave within a first wave down? 0.618 of this downleg would bring gold to the 1297-8 area. Anyone?
we have been in a wedge-like pattern from 10:30 until around 1. This does not seem to fit the EW definition of a triangle. A diagonal can only be the first or last wave. Maybe there is a much larger triangle or combination being sketched out and we cannot know what it is until more of it appears. Or, maybe the correction is over and we need to look at this in the context of a continued uptrend.
What is pattern of diagonal? Can u post a chart depicting the pattern?
Thanks.
I strongly encourage you to get a copy of the book Elliott Wave Principle by Frost and Prechter.
fencepost
Thanks.
Look at the education videos on the education page. They explain all the structures, rules and guidelines. And yeah, Frost and Prechter is essential
I think the decline this morning was the third wave in an expanded flat that corrected yesterday’s advance. If correct, that means we can expect more upward movement.
Possible but it maybe not first wave down only a wave in 4 wave
Just when least expected Gold does a double top at 1,305.15 at 9:32 am. GDX also hits a high with $23.22 high with amazing accuracy only .23-.28 away from $23.45-23.50 target. Then gold drops $20 in 53 minutes by 10:25 am. How could we have guessed those overnight and opening surprises?
“While we have absolutely no confirmation of any trend change I must allow for the possibility that this final fifth wave could continue higher today.” Lara’s analysis comment Tuesday.
Hello $20 reversal so far! Things are interesting again
The decline looks like a 5 wave pattern so far. We need more time to see if it is part of a larger 5 or 3 (e.g. zigzag, corrective) form.
I can argue both the bullish and bearish points of view. Here are some bearish points (not EW): volume on today’s decline is heavier than bulls would prefer. Also, quoting Jim Sinclair, a rhino horn on a weekly chart should be sold…look at weekly gold in euros. Of course, that rhino horn could end with a Euro advance as well as a gold decline.
Silver could test 1850 today, which was my previously-mentioned TL target and is coincidentally also 618 fib pt and 200 DMA.
IS IT POSSIBLE THAT BOTH THE MAIN WAVE COUNT & ALTERNATE COUNT COULD BE VALID?
THAT IS, COULD PRIMARY 5 ON THE ALTERNATE BE PRIMARY 1 AND THIS CORRECTION TOWARDS $1,305 BE A W-X-Y CORRECTION?
On the open, we are going to be very close to Lara’s 2/C/v target on GDX this morning.
What is the price point pls?
If you go back a few days you will see the GDX post Lara had. She had a target of $23.45. GDX is trading premarket at about $23.20. High yesterday was $23.09.
Thanks. Range is 23.45 to 24.5???
PM sector is in the area of major turn soon.
Papudi, you may be waiting 3-4 weeks for that turn.
Thanks
That’s from the 16th. An up to date analysis would be helpful.
Lara now that the main count will most likely be invalidated with a full daily candlestick above maroon trendline, can you check to see if this count from $1131 works on hourly chart specifically what I have labeled Minor 1?
Minor 1 = $1131-$1239 (smaller scale LD)
Minor 2 = $1239-$1167 (slightly greater than 61.8%)
Minor 3 = targeting July high at $1345ish
The strength of this wave from $1167 certainly looks like a third wave at Minor degree
This looks familiar. Probable also.
The leading diagonal does not fit there. Its fourth wave would be below its second wave. For that general idea you’d have to see the leading diagonal ending at the prior swing high, at 1,208. Even then, within it the third wave is the longest so the wave lengths aren’t right.
I am seriously trying to consider alternates along this line, I’ve done some work playing with it, and I can’t yet see the solution. I’ll keep at it, because if this idea is right we’re right in the middle of a third wave, and so its really important to see if it could be so!
Above Lara wrote: This trend line (maroon) is now overshot. A clear breach with one full daily
candlestick above it and not touching it would see this main wave count
substantially reduce in probability.
By end of the day price must come down lower or below the trend line. That means huge red candle. ????
A critical day today.
It can’t do it now.
Think it is ready. The wave c has contracted.
Lara on yout day chart may request you to extend the bottom green channel line further up to 1315 or so.
Than I can monitor the real time price with the green line.
Thanks in advance.
Ok.
Syed’s target hit: Further new highs targeting 1303-10 is expecting.
Now the reversal candle is going to put in today in daily chart. Gold opens at high and drop with close down engulfing the green candle of yesterday.
Gold made double top at 1303 in 5min period and trading at 1299.
Last two days gold made several HnS in 5 min period and broke out of all of them. Current HnS must negate below 1296.
Per aleforex’s chart below, and my posts on Monday and 15 hours ago @ bottom of this page, can anyone plz explain the EW reason:
Why can’t gold be ending a third wave instead of a C-wave or 5th?
Hi J, it is exactly what I think ( only one difference, I count iii within 3 from 1204 to 1303 ) but it seems that the first part of my labeled ( wave 1 as leading diagonal ) not respect EW rules….
This is my alternate count. Downward movement is expected in area of wave (iv) ( 1272-1281 ) for wave iv and after up movement for wave v within wave 3 in area 1340, where wave 3 will be 1,618 of wave 1.
This is only my alternate, because I prefer the main Lara’s count
sorry the first chart is wrong…..the top is not wave 3 but wave iii as in the second chart…
Yep, I’ve found we can’t replace or delete a chart.
The count doesn’t appear valid. Your wave 1 would need to be a leading diagonal since wave iv overlaps wave i. Wave v would then need to be longer than wave iii of the diagonal.
See the rules here:
http://www.elliottwave.com/images/forexfocus/diaewp.doc
Good eye.
That big rocket up felt like a 3rd of a 3rd.
Couldn’t this still be ending iii of 3, entering iv down, then up to new highs for v of 3?
Also, the second wave within that leading diagonal must be a flat not a zigzag.
Hi Bob, the rule for leading contracting says that wave v must be shorter than wave iii , no longer…The problem is that the rule says also that wave i must be longer than wave iii, and this seems no fit as I have labeled.
The alt wave count is looking stronger. No retracement until we hit the upper trend line?
No sign of any turn around. We could wake up to another 20$+ gap up
Did you miss this last little spike? Interesting trading this past hour.
Gold just double topped at 1297.30 at 21:38 and and 1297.37 at 22:04 Tuesday night on global economy and ECB Thursday QE stimulus concerns and multi country volatility and Greek election Sunday. Like a nightmare gold needs to drop out of sight fast for all bearish gold investors peace of mind.
Meant to post it here…just had a third little spike.
That $10 drop midday today down to $1286, I’ve seen those in the past, the remind me of firing a test round. We will see what the night brings. I won’t be adding to JDST until I have more confirmation.
Freaking silver… it’s just flying. WTF. Close your eyes and buy the top status. So dumb.
Silver still in uptrend.
See Lara’s Silver chart & post in the gold thread on Jan 19
And my amateur silver post on Sunday:
http://elliottwavegold.com/2015/01/gold-elliott-wave-technical-analysis-16th-january-2015/#comment-1800314966
If gold to correct here it needs to put in a daily reversal candle tomorrow: A doji, bearish engulfing, dark cloud or inverted hammer.
Gold is not backing down from 1294 price area.
Lara’s count is impressive and convincing that wave iii is about to begun.
another new high….no signs of reversal papudi
Good day everyone! My sentiment for the day: With 1290-80 holding, further new highs are expecting. One of the two alternates would likely be in play. With 1266-65 holding, a break below 1232 is not yet seen…. Gold price appears to be basing off 1255 for now….
*Further new highs targeting 1303-10 is expecting….
Gold Bullish Inverse Head and Shoulders Pattern
Jan 19, 2015 – 09:22 PM GMT
By: Clive_Maund
http://bit.ly/1ul4j5Q
16 chart incredible article covers Gold, Miners, XAU, HUI, Swiss Franc, Sentiment, US Dollar, Gold COT, Hedgers, Optix, US Dollar Hedgers, Optix, and more. The State of Affairs in most things effecting gold.
According to today’s wave counts main and alt both pointing gold to go down first.
Inverse HnS have been there for some time in PM sector.
not a very good IHS and I’ve noticed everyone is calling out the H&S or IHS lately these days even when they are not symmetrical. Symmetry is important for these patterns to work well. The dip to $1141 kind of invalidates this IHS IMO.
Lara–question please.
IF (big if) daily alternate count is proven valid how long (time) do you estimate to reach wave (2) target 1131 ?
Lara in video when discussing alternate mentioned “at least a couple of weeks” until 1,131.09 which would invalidate the alternate daily wave count.
Thanks Richard.
Why can’t gold have just ended a 3rd wave instead of a 5th wave or C-wave??
IMO a 3rd wave-end or the Alternate Daily (but less deep correction) fits better with TL analysis, currently.
Today comex gold turned right at the Gann 3×1 trendline. There is major support in the 1260-70 range incl Gann 1X2. A close below that and especially <1240 would change the picture from overall bullish back to bearish. Unless that happens, viewing a correction towards 1270s as a long entry opportunity with SL <1240. Still long and strong from 1150-1170. It's the 14th week and today is not Time for a major turn on intermediate (weeks-months) time unit. Weekly and monthly candlestick pattern show reversal.
Silver also hasn't reached its final top.
“Why can’t gold be ending a 3rd wave instead of a C-wave or 5th ??”
hmm … Look like that
Thanks for the great analysis Lara. I think it is good news for investors bearish on gold.
Yes indeed.