
A trend change was expected, but price has made a slight new high. At the daily chart the two wave counts are still the same, but I am changing the labelling of this last upwards movement on the hourly chart to fit better with momentum. I have a new daily alternate wave count for you to consider.
Summary: I am still waiting for a trend change which becomes more likely as divergence on the hourly chart becomes stronger. The trend change for the first two daily wave counts is at intermediate degree, and for the third wave count only at minute degree. Before I have any confidence whatsoever that the trend change has occurred I want to see some confirmation with a breach of the orange channel on the hourly chart, followed by a new low below 1,279.16. I will have full confidence that the trend change has occurred with a clear breach of the green channel on the daily chart. If Friday’s session brings price back below the maroon trend line on the daily chart the main wave count will remain valid. If it does not I will discard the main wave count in favour of the alternates, or at least reduce the main wave count to a very low probability.
Click on charts to enlarge.
Main Daily Wave Count
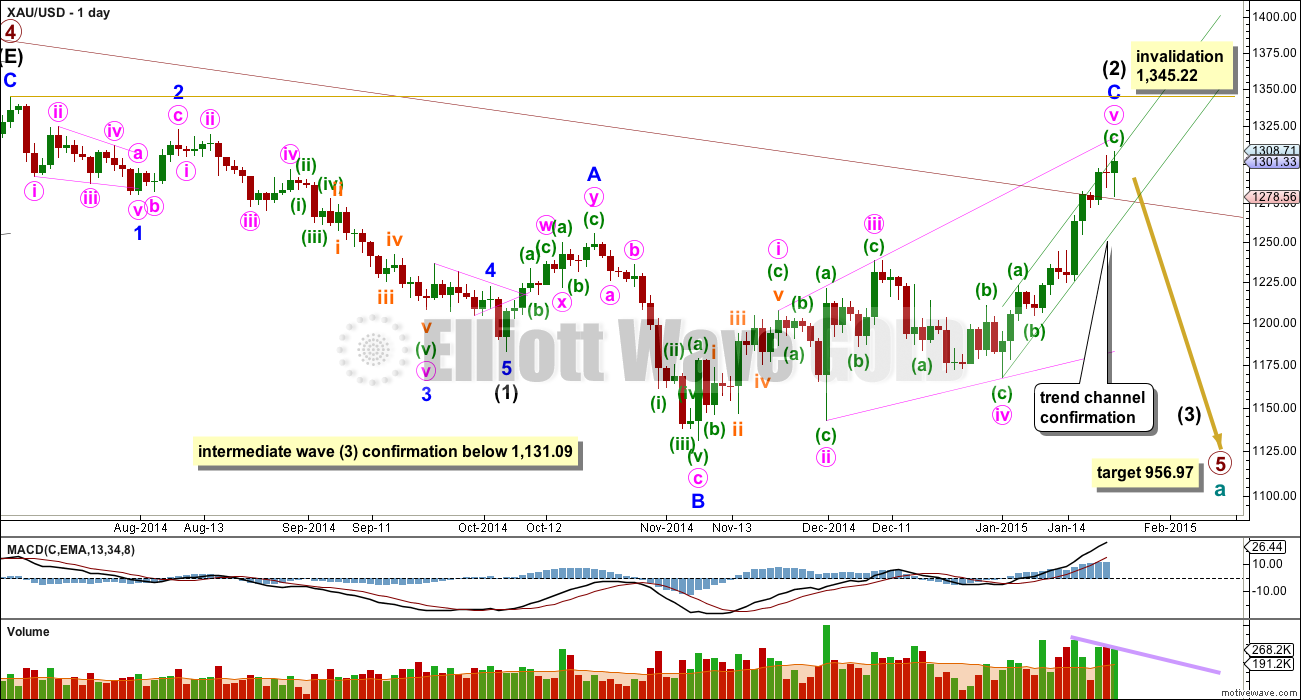
Within primary wave 5 intermediate wave (1) fits perfectly as an impulse. There is perfect alternation within intermediate wave (1): minor wave 2 is a deep zigzag lasting a Fibonacci five days and minor wave 4 is a shallow triangle lasting a Fibonacci eight days, 1.618 the duration of minor wave 2. Minor wave 3 is 9.65 longer than 1.618 the length of minor wave 1, and minor wave 5 is just 0.51 short of 0.618 the length of minor wave 1. Although I am still confident this movement is a complete impulse, the alternate wave count is also reasonable (but has a lower probability).
Intermediate wave (2) may not move beyond the start of intermediate wave (1) above 1,345.22. If this invalidation point is passed this main wave count would be invalidated and the alternate daily wave count would be confirmed.
Intermediate wave (2) is now a complete expanded flat correction. Minor wave C is longer than 1.618 the length of minor wave A, and there is no Fibonacci ratio between them. Minor wave C is now a complete expanding ending diagonal.
Within an ending diagonal all the sub waves must subdivide as zigzags. The fourth wave should overlap first wave price territory. The rule for the end of a fourth wave of a diagonal is it may not move beyond the end of the second wave.
Draw a “best fit” channel about minute wave v zigzag. When this green trend channel is clearly breached by a full daily candlestick below the lower green trend line and not touching it, then I would have a lot of confidence that there has been a trend change at intermediate wave degree. Only a new low below 1,131.09 would provide full and final price confirmation that downwards movement is intermediate wave (3), but we should be alerted to it before that price point is passed by looking at structure and momentum. Intermediate wave (3) may only subdivide as a five wave impulse, and it should show a clear strong increase in downward momentum.
Draw the maroon trend line on a weekly chart on a semi-log scale, and copy it over to a daily chart also on a semi-log scale (see this analysis for a weekly chart). This trend line is now clearly breached with two full daily candlesticks above it and (just) not touching it. This reduces the probability of this wave count substantially to about even with the alternate. If this maroon trend line is breached on the weekly chart, with one weekly candlestick above it and not touching it, then I would discard this wave count in favour of the alternate. At the end of Friday’s session we may have an answer.
The breach of this trend line should be taken as a strong warning that this wave count may not be correct.
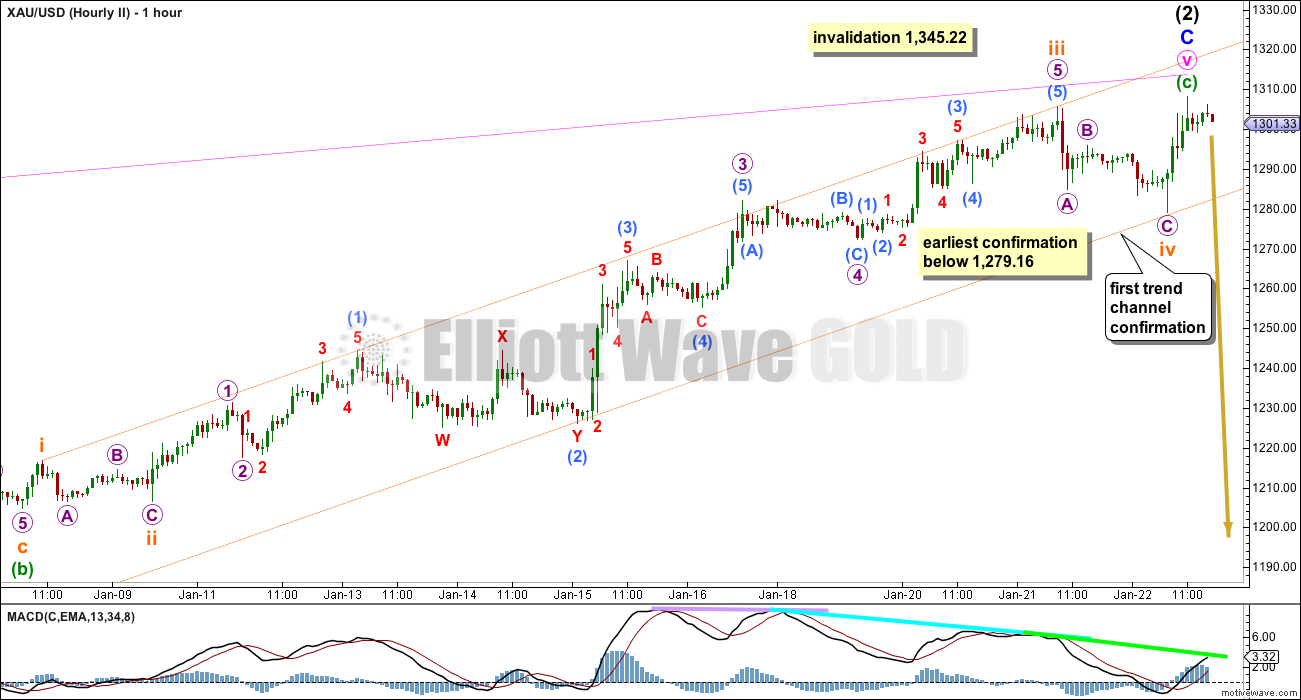
I have adjusted the wave count substantially within minuette wave (c) to fit with momentum, and to see the third wave within it extended, which is the most commonly extended actionary wave within an impulse.
There is no Fibonacci ratio between subminuette waves iii and i (but there wasn’t with my last labelling either). Subminuette wave v is now 2.79 short of 2.618 the length of subminuette wave i.
The orange channel is a best fit channel: draw the first trend line from the highs of subminuette waves i to iii, then place a parallel copy on the low of submicro wave (2) within the middle of the third wave. Micro wave 3, the middle of the third wave, slightly overshoots the upper trend line which is typical. The lower trend line now shows exactly where downwards movement during Thursday’s session found support and this tells us the trend line may be the best indicator of a trend change. Only when this trend channel is breached by at least one full hourly candlestick below it and not touching the lower orange line would I have any confidence whatsoever that the trend change has finally occurred.
A new low below 1,279.16 would now provide early price confirmation of a trend change. This is the start of the final fifth wave up. A new low below its start may not be a second wave correction, and so at that stage the final fifth wave must be over and cannot extend higher.
Thereafter, a breach of the bigger green channel on the daily chart would provide full confidence in a trend change at intermediate degree.
Alternate Daily Wave Count
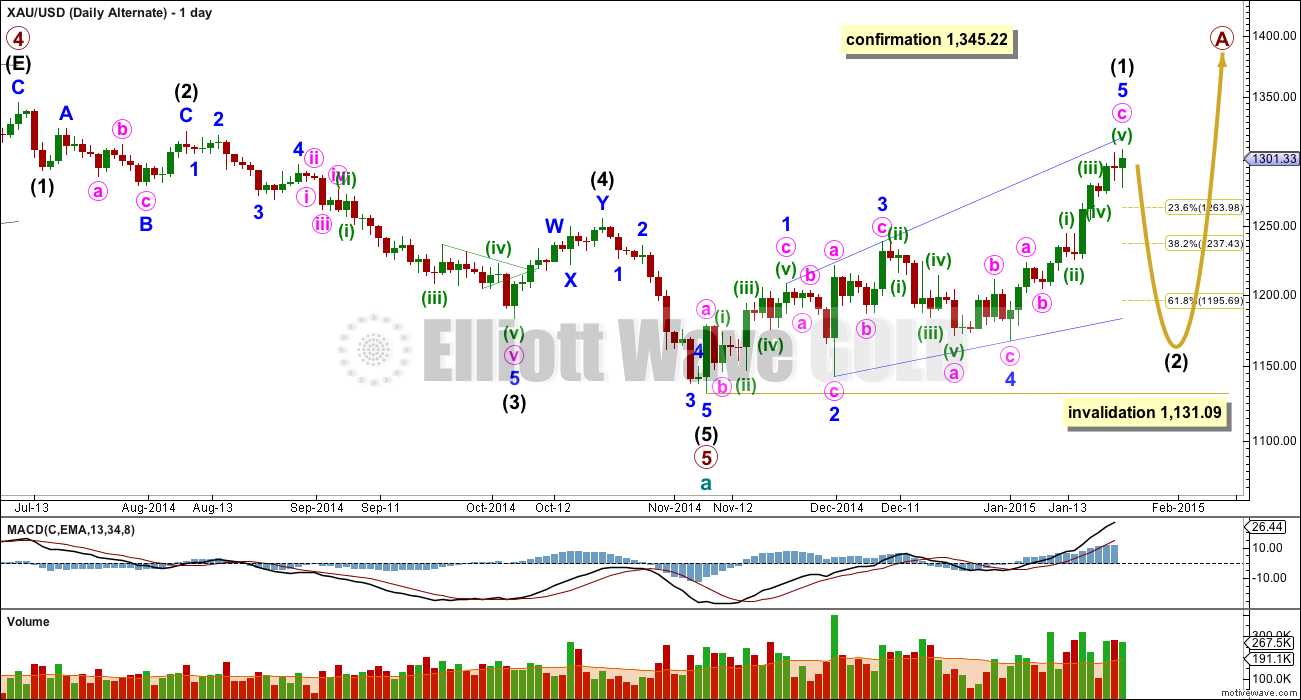
If price breaks above 1,345.22 this would be my only wave count. At this stage, despite its problems, I judge this wave count to have a about an even probability with the main daily wave count.
Intermediate wave (2) is a rare running flat. This is entirely possible just before a strong third wave, with the downwards pull of a third wave forcing minor wave C to be slightly truncated. However, within intermediate wave (2) minor wave C looks clearly like a three wave structure on the daily chart and this is a considerable problem. If you’re going to label a running flat it is essential that the subdivisions fit perfectly. This is still my main problem with this wave count.
Intermediate wave (2) is a 58% correction of intermediate wave (1), and is a running flat. Intermediate wave (4) is a 52% correction of intermediate wave (3) and is a double zigzag. There is little alternation in depth, but perfect alternation in structure.
Ratios within primary wave 5 are: intermediate wave (3) is just 1.09 longer than 2.618 the length of intermediate wave (1), and intermediate wave (5) has no Fibonacci ratio to either of intermediate waves (1) or (3).
Intermediate wave (5) still looks like a zigzag rather than an impulse, and has a corrective wave count. This also reduces the probability of this wave count.
It is entirely possible that there was a leading expanding diagonal as the first five up within primary wave A. For diagonals the contracting variety is more common than expanding, and ending diagonals are more common than leading. While a leading expanding diagonal is not rare, it is not very common either. This very slightly also reduces the probability of this wave count.
Leading diagonals are almost always followed by very deep second wave corrections, often deeper than the 0.618 Fibonacci ratio of them. This wave count expects a big deep correction downwards. It should subdivide as a clear three on the daily chart, where the main wave count now expects a clear five down.
Intermediate wave (2) may not move beyond the start of intermediate wave (1) below 1,131.09.
Second Alternate Daily Wave Count
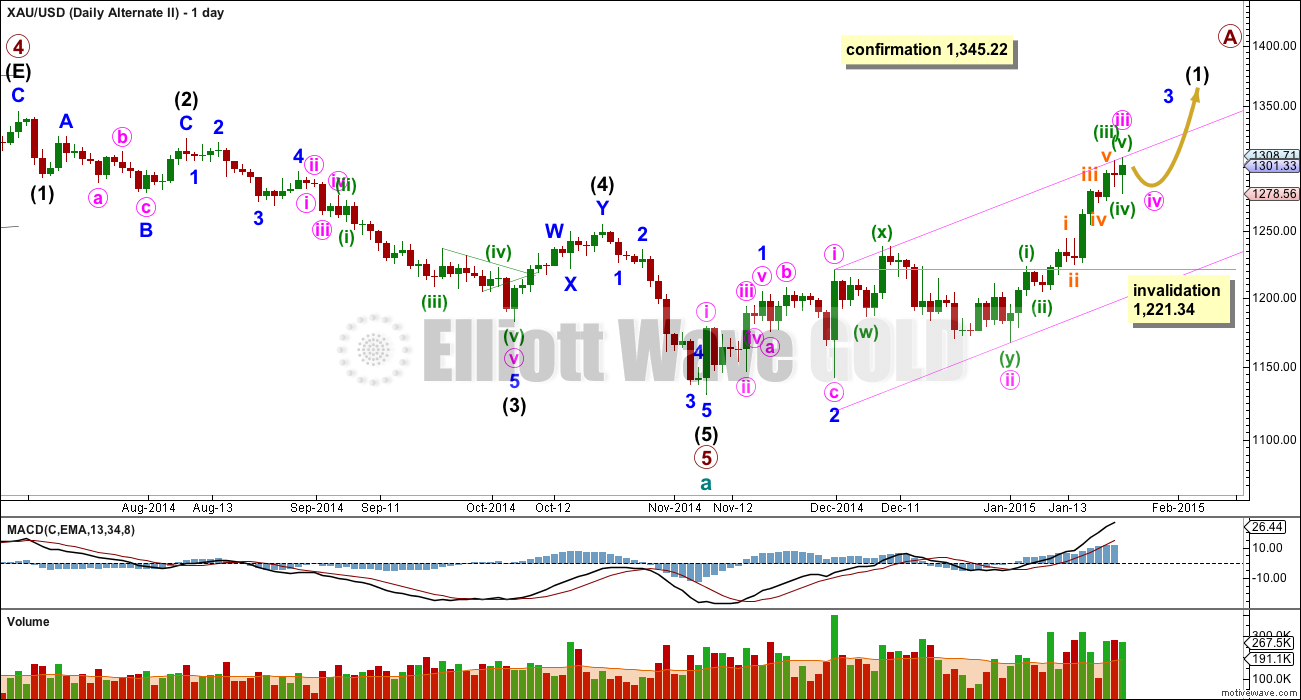
I can just see that this upwards movement could possibly be the middle of a third wave just passed. This wave count fits with momentum at the daily chart level.
If there has been a cycle degree trend change at 1,131 then the new upwards trend must begin with a five up. The first five up may be either a leading diagonal or an impulse, and an impulse is more common.
For this wave count minute wave ii is problematic: its subdivisions are not as good a fit as the first two wave counts, and it is much longer in duration that minor wave 2 one degree higher. Minute wave ii lasts 22 days where minor wave 2 lasts 9 days, which gives the wave count an odd look. But occasionally Gold does this, so it is viable.
If the middle of a third wave has passed then a small fourth wave correction should begin here or very soon. It may not move into first wave price territory below 1,221.34. If this wave count is invalidated then I will have full confidence that any downwards movement from here would be a new intermediate degree wave down.
Because minute wave ii shows so clearly on the daily chart minute wave iv should also. Minute wave ii was a deep 69% correction so minute wave iv should be shallow.
This analysis is published about 5:54 p.m. EST.
Hello Lola,
I was concerned it was EWI subscriber material and thus inappropriate for Lara site. Thank you for posting its public link.
Cheers and have a good weekend.
Today’s Gold Futures COT looks more bearish than the 8/12/2014 report….
I would think that the fact that gold tested the maroon line and that it held would be an indication that we should expect more upside in gold short term. Personally I favour the 2nd Alt count right now
Also looks like GDX complete a nice abc correction
Yesterday Lara wrote:” If Friday’s session brings price back below the maroon trend
line on the daily chart the main wave count will remain valid. If it
does not I will discard the main wave count in favour of the alternates,
or at least reduce the main wave count to a very low probability.”
I hope Lara will not discard the main wave as gold did not break the trend line but came close to it.
On Monday if gold goes down to 1283 or lower trend Line will be broken. The TL is upward sloping line and as trading hour passes the bo pt. goes up.
Gold had to go thru lot: SWZ referandum, FOMC, SWZ Franc rev, ECB QE, Greek vote and on 1/28 FOMC again.
Is there any thing else on schedule in Feb to mess up EW’s????
what effect Greek vote will have…. if they choose to drop out of eurozone.
Analysts Mixed On Impact Greek Vote Will Have On Gold –
By Neils Christensen of Kitco News
Friday January 23, 2014 11:36 AM
http://www.kitco.com/news/2015-01-23/Analysts-Mixed-On-Impact-Greek-Vote-Will-Have-On-Gold.html
Gold dropped to only $1 away from .618 target of the difference between the high this week yesterday at $1,307.71 at 11:25 am and the low of this week at 1272.22 Monday at 10:55 am.
1307.71 minus 1272.21= 35.50 x .618= 21.94 – 1307.71= 1285.77 versus low today of 1284.49 at 10:15 am. 1285.77 – 1284.49= $1.28 off .618 target. Close enough to make profits with. I admit I was looking for a match for today’s low. Is that the way you EW experts calculate your next target after a big jump or drop? Is that the basic rule to use to calculate next trading target after a big jump or drop or am I missing something? Share your secrets please!
Gold just dropped $12 in 10 minutes down to 1284.49 at 10:15 am.
Now that the feeding frenzy with bullish sentiment on high for gold ended yesterday. Gold was dropping since the close yesterday on constant slope down $10 until 10:05 am. Yesterday GLD and gold closed up but GDX and GDXJ both closed down. Miners have been know to lead gold at the major direction changes.
When looking at chart for January, gold $10 parabolic straight down drop looks like one leg hanging over a cliff and it’s a long way down. Perhaps today gold might close weak enough for the main count to still be left in the running. After yesterday’s multiple wave count choices, I’m looking forward to a Monday gold wrap up after Sunday’s Greece vote and then Lara simplifying the wave counts. Gold’s done very well in January which is one of it’s four historically strong months. Perhaps gold drops down from February onward and primary wave 5 has bottomed and climbing by Gold’s other 3 strong months August, September and November.
I was looking at the RSI indicator last night and Gold and GLD both closed at 74%, which is in the overbought territory over 70%. GDX and GDXJ are not over 70% however they dropped Thursday.
Gold has only been over 70% 3 times in the last 12 months, at the March high and then the July high and again January.
It may be just a few days before it’s time to hit the DUST trails south to the deep discount miners ETFs where Cash is King for opportunities of a lifetime and the $HUI and $XAU are below the early November lows..
Stooped right at 23.6% retrace of wave c and bounced. Could it be 4th wave of 2nd alt?
Chapstick_jr Very sharp of you to pick up on the 23.6%. Could be the 2nd alt, however I’m still praying for the main count as really prefer a much lower bottom to start large investment in miners. Is there anyway it could match up with the main count?
Richard u R not alone. Same here.
Gold at 1000- is like a lottery to me.
Gold $1,000 or lower this year ASAP would also be a Lottery for me.
Gold came pretty close to maroon TL at 1284.
Came close to the Orange bottom trend line on hourly chart.
Divergence in one hour being confirmed
price is breaking trendline and macd breaking neutralzone
yesterday price and macd both touches support trendline at the same time
Waseem, I really appreciate your terrific chart and assessment of gold activity this morning, thank you!
Do you have a preference on which daily chart will take precedent?
We got daily reversal pattern in daily chart. doji is followed by hanging man. that’s a daily reversal.
divergence is coming into play…. and if price closes round 1282 that could be shooting star in weekly. weekly reversal…
if it could happen as it is seen.
we have seen BEARISH HARMONIC PATTERN IN GOLD IN DAILY CHART..
according to which that pattern started forming from 1131 and according to that pattern gold can go to 1303-1305. and after that it can make reversal as i ti shown in chart below…
My contrary indicator is Mr. Ron Rosen’s report on gold. Once again he has posted the same EW count on PM and calling the great bull market to begin.
http://www.321gold.com/editorials/rosen/rosen012215.pdf
He writes that Gold/Silver in in Running Flat and HUI/XAU in Expanded flat.
He analyses on a long term price charts ve on daily or hourly.
For primary hour count Lara has provided earliest confirmation: 1279.16.
That seems achievable next week. That is $19 away.
Any long bear market does not end like this.
A capitulation or annihilation in PM sector is yet to come to end this bear market.
hi,
could you please consider this wave count.
So we don’t get in trouble, just checking whether there was permission to post somebody else’s copyrighted property?
It’s copyrighted material. Permission is necessary to share in a public forum.
Permission is required to share it anywhere.
That’s why I already asked the poster.
yes, but it’s a public info from their webpage: http://www.elliottwave.com/freeupdates/archives/2015/01/13/Gold-s-Sneaky-Rally-A-Quick-Insight.aspx#axzz3Pd2OpBJo
Normally copy right applies against using the material for financial benefit. Posting of material on pub forum does not constitute financial benefit. rather sharing info. Plus as long as credit is given to the author.
a=c has been surpassed and $1340ish = 1.618*a which is basically Lara’s second alt
its a variation of my main wave count. It looks like EWI don’t think Gold has finished its fall yet.
Lara you are right gold not bottomed yet.
EWI thinks gold will bottom end of 2015.
Decay on 3x ETFs is called slippage and averages 10 to 15% a year.
That is why bot PUT on NUGT recently 9 months out. Regardless of PM up or down. If it down better yet for profit. Best way to take advantage of natural slippage of PM 3xetf.
Everything is possible but making basic assumptions on gold at 1000 in 6 months that looks like about plus 90% on DUST minus 7% slippage. Why not buy DUST, go on vacation for am few months, come home and prepare to collect 83% DUST profits? I’m not a statistician but seems to me the probability for success with this approach may be as good as worrying about hourly wave patterns everyday.
Historical perspective. In Jan 2014 GDX was 22. DUST was at 50. One market letter bought DUST projecting same as you are: buy and go on vacation.
Result : DUST is at 12.
Watch for my post on how to take advantage of price decay in 3xetf of PM sector soon. That strategy u can buy and go on vacation and come out ahead.
Analysts at Elliott Wave International view the current upwards movement as a counter-trend multi-month rally that can last through the end of the year. They expect gold to make new lows below November of last year, but not any time soon.
So, the second alternate daily wave count seems more probable.
Maybe or maybe not.
Not to slam EWI, but they were too premature in calling the trend change from P4 to P5 in gold. Lara nailed it.
But it’s helpful to see and consider different analyses.
Hi,
As a subscriber of Elliottwave.com (Metal pro), I just would like to post their main wave account about Gold.This is almost similar to Lara’s main account on a daily chart.
Eventually The Gold Price Will Bottom…BUT
Avi Gilburt January 20, 2015
http://bit.ly/1yV3QyB
Click article bottom for charts GDX, GLD, YI Silver, HUI January 19th 2015
Richard, thanks for charts, I like 2nd opinions, seems Avi and Lara charts both expect lows shall we generically say first half 2015. Martin Armstrong has also been suggesting lows in first half 2015.
Big question now seems to be when does this up move end ?
Hi. JUST A VIEW: With 1280-79 holding, continuation to further new highs (1312-16-20) is expecting with a quick drop in between for 1285-83 subject to a break below 1293-92. A new low below 1279.1 is likely in which case if we are lucky, we may see gold price drop to 1270 which is the need of the hour!
I’ve got a good entry on JDST, been purchasing since last week, avg. $7.46. I will keep the position for now, seems like I have a little time to keep watching things unfold. I wrote last week that things seems to be taking longer than one would expect, maybe that is what is playing out. OI for gold futures is way way up. I expect the COT tomorrow to look extremely bearish.
The other thing I’ve been thinking is that with the drop in the euro and the SNB unpeg, it would take 4 or 5 business days for margin calls to really start kicking in, which may coincide with the potential top today. We will see. Lara and Avi are my two favorite and both are expecting the same thing which I take confidence in.
MTLSD (or anyone).
Do you know what is the time deterioration cost on DUST or JDST? If I buy today and gold continues up, I just hold, hold, hold until in maybe 3-4 months we turn down to gold 1000, is there a dollar cost to hold 3X DUST or JDUST? Like cost to hold an option. Any idea how much is the cost to hold DUST or JDST?
I think it varies depending on momentum, Like options, when it’s going your way there is less decay, but I’ve read the juniors are about 20% decay every 60 days. Not sure about dust/nugt, they seem to have less decay.
I agree with MTLSD, that it depends on momentum. There will be little decay when you catch a strong trend, like a wave 3. Higher volatility equals more decay. Just do the math, pick a timeframe and compare JNUG vs GDXJ for example to calculate the decay. You can get a quick double or triple by holding the 3x etf’s, but you can also go broke when they go against you. Best for day trades, short swing trades, and sometimes longer with a strong trend. Timing is everything.
Lara – further to important text of the article posted below by Richard B.
Analyst AVI G. wrote: “However, I am still VERY VERY skeptical about us getting a full 5 waves
up. Rather, I will now adopt the count that Garrett has been posting
for this last phase of the bottoming process, and that has us counting
it all in waves of 3. That means this rally is a b-wave, with a c-wave
down to potentially follow. Yet, I will NOT short until I see a 5 wave
move off taking us below the support box between the .764 and 1.00
extensions – 119.50-121.75. That is the major point of support which
should hold if this market is going to develop 5 waves off the low.
And, if we do, then we are only in wave iii of 3. . . . or, from the
more bearish perspective – which is my primary right now – wave iii of
(c) of b. “
i really need a chart to see that idea. It states “it all” is in 3 waves up. If I assume that refers to the rise since 1,131 then if that movement is a B wave it must follow an A wave. Which would be the prior downwards wave of the same degree which is my minor wave B (for the main wave count). Which sees a huge A-B following a tiny movement (my minor wave A). Which makes absolutely no sense.
if that makes sense, great.
Lara this is the chart that papudi is discussing.
Avi Gilburt January 22, 2015 EW GLD chart.
I also have it a few comment lower today.
http://www.gold-eagle.com/sites/default/files/gilburt012115-2.jpg
Thanks Richard. That really helps.
But… that count still makes no sense. He’s seeing the fall from the end of the triangle as a five wave movement (which can fit) but he has that five wave movement labelled “A”. But… its a five wave movement in a fifth wave position, not an A wave position. So put into the bigger picture, that makes no sense.
EW is fractal. Each labelling must fit / make sense at higher time frames / degrees and lower. It all has to fit together.
Either he’s missing some labels or… that wave count makes no sense. Or I’m missing something there.
I’ll add also that he looks like he’s seeing a leading diagonal as the first upwards movement for his A wave. He’s not supplied any detail of that. When I test that it isn’t a great fit; although the diagonal mostly fits, and would be contracting, the third wave within it would be the longest of 1-3-5. It should be shorter than 1, not longer.
Hi Chapsticks,
Is the WXY you mentioned around the ECB announcement the same as Lara’s ABC at micro degree in her main hourly above?
May I please ask, what is your Main minute-minor wave # currently?
Per my post/chart 3-hours ago in the Jan 21 thread, I still prefer a near-term correction and then higher (unless either invalidate). Do you?
Thank you.
Yes it is and I’m confused. Lara said yesterday it subdivided perfectly as a ZZ which I agreed. Now she has it labeled as ‘A’ which means it’s a 5. Either way, the outcome is the same.
As far as my count, I’ve only eliminated Lara’s main count so far.
Thanks Lara for all the updates, incl for silver, and your answers, incl about silver-gold correlation.
Avi Gilburt January 22, 2015 Elliott Wave chart for GLD
http://www.gold-eagle.com/sites/default/files/gilburt012115-2.jpg
That wave count makes no sense to me. See my comments in response to Richard above.
Last week Elliott Wave Expert Avi Gilburt had an article he thought gold would end going down to $1,000 area.
Here is a new article today January 22nd Avi expects GLD to go up some more than yesterday before dropping down deeper than November low.
Have I Changed Perspectives On GLD?
Avi Gilburt January 22, 2015 An Elliott Wave chart for GLD is attached.
http://www.gold-eagle.com/article/have-i-changed-perspectives-gld
Using different techniques, I also still look for a new low sometime later this year after this pop (unless the monthly closes >1345).