
The situation is still unclear. Price needs to break out of this sideways / downwards movement to provide clarity. This should happen within the next 24 hours.
Summary: A new high above 1,308.10 would confirm the main wave count and invalidate both alternates. This would provide earliest indication that Gold may be in a new multi-year upwards trend. Alternatively, a new low below 1,272.34 would provide confidence in both alternates and reduce the probability of the main wave count substantially. Today it is my judgement that the alternate wave counts are looking more likely than the main wave count.
Click on charts to enlarge.
Main Daily Wave Count
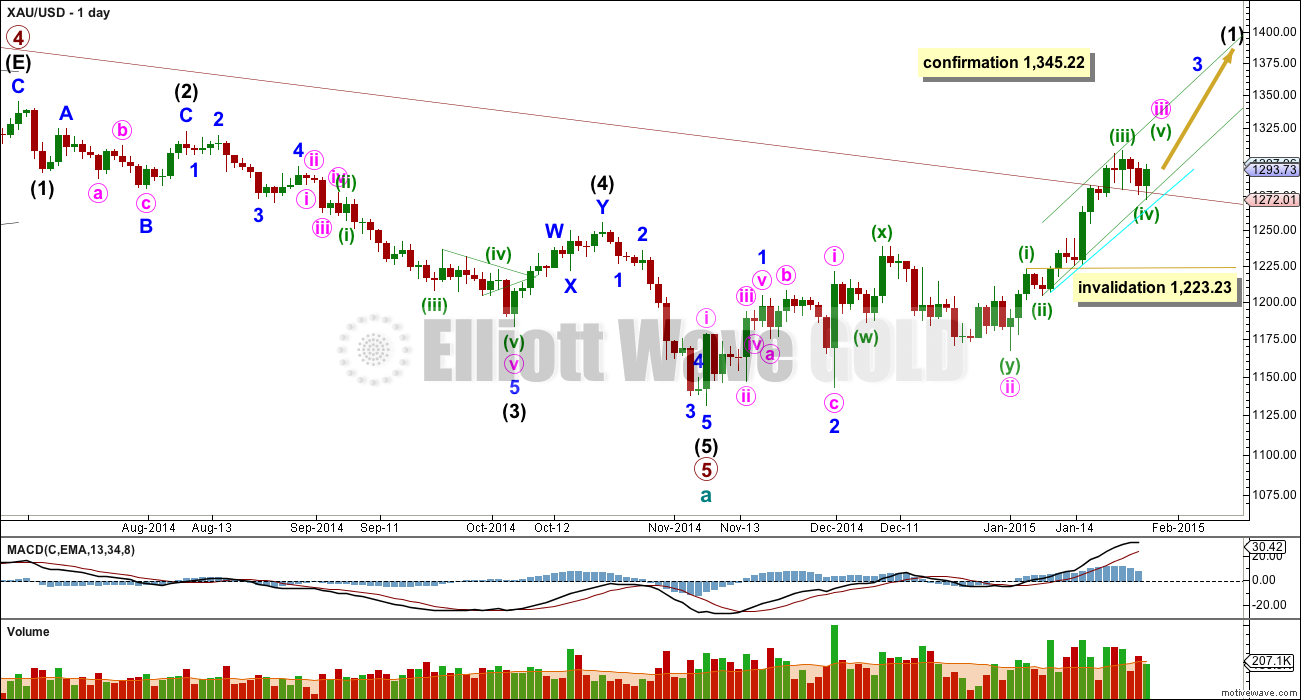
This wave count now has a close to even probability with the two alternates. Depending on what happens over the next few days I may swap them over again. The situation is unclear. Normally I have only one wave count, with occasional less likely alternates. Sometimes I have to present alternates to you with an even probability and wait for the market to tell us which is correct, and this is one of those times. Use your own technical analysis and judgement to determine which you see as more likely.
This wave count sees a five wave impulse down for cycle wave a complete, and primary wave 5 within it a completed five wave impulse. The new upwards trend at cycle degree should last one to several years and must begin on the daily chart with a clear five up. The first five up is most likely to be an impulse which is what this wave count looks at.
My biggest problem with this wave count, and the reason I will retain the second alternate, is the structure of intermediate wave (2) within primary wave 5. This is a rare running flat but the subdivisions don’t fit well. Minor wave C should be a five wave structure, but it looks like a clear three on the daily chart. If you’re going to label a running flat then its vital the subdivisions fit perfectly and this one does not. I still have a big concern with this wave count for this reason.
Intermediate wave (5) still looks like a zigzag rather than an impulse, and has a corrective wave count. This is also a problem I have with this wave count.
This wave count fits with momentum at the daily chart level. The middle of a third wave may have recently passed, and now a series of two more fourth wave corrections and fifth waves up may be required to complete minor wave 3.
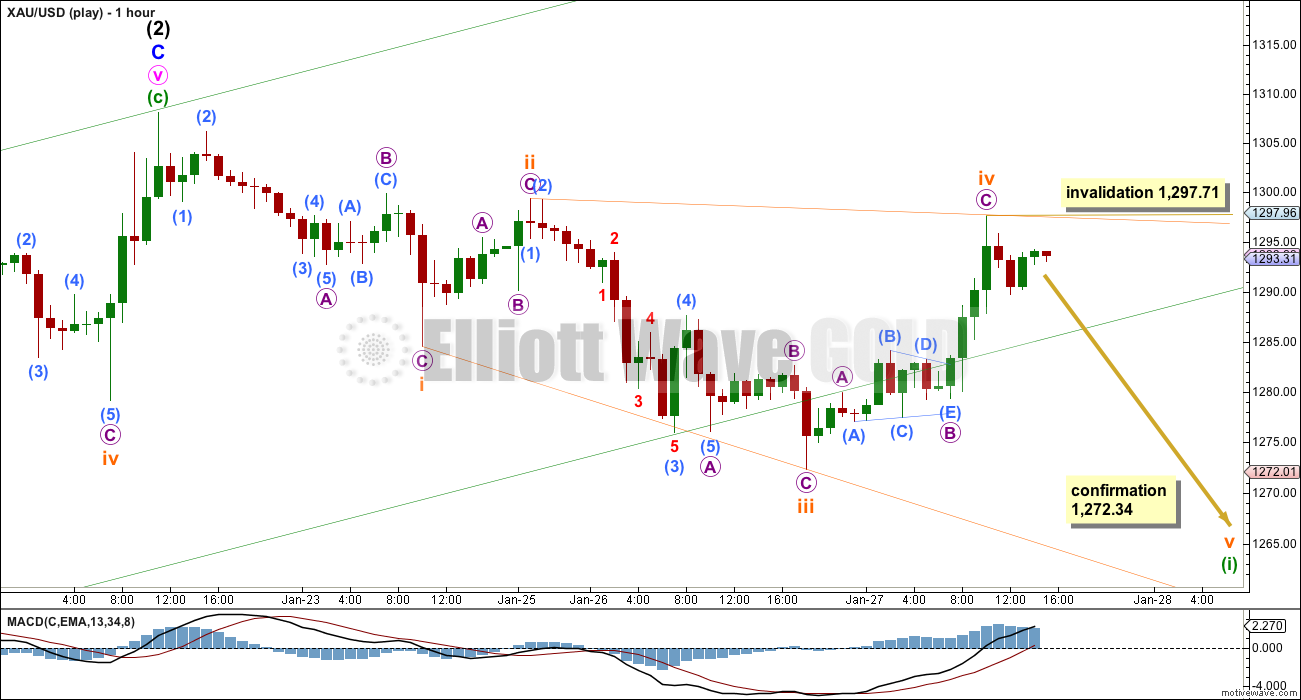
For this wave count minuette waves (i), (ii) and (iii) are seen with exactly the same subdivisions as minute waves a, b and c for the first alternate (and one degree lower for the second alternate) because they both subdivide 5-3-5. If we have one more high then this upwards movement from the last low at 1,167 (minute wave ii) will be a complete impulse. If we do not have one more high then the upwards movement from minute wave ii would be a correction, not an impulse. This is the core of the lack of clarity: is this movement finished yet or not?
I am today redrawing the green channel about minute wave iii using Elliott’s second technique. When fourth waves breach a channel drawn using the first technique, then when the fourth wave is over redraw the channel with the first trend line from the ends of minuette waves (ii) to (iv), then place a parallel copy on the end of minuette wave (iii). Minuette wave (v) may about the upper edge. It is also possible that minuette wave (v) could be a strong fifth wave typical for commodities and may overshoot the upper edge of the channel.
If it continues further then minuette wave (iv) may not move into minuette wave (i) price territory below 1,223.23.
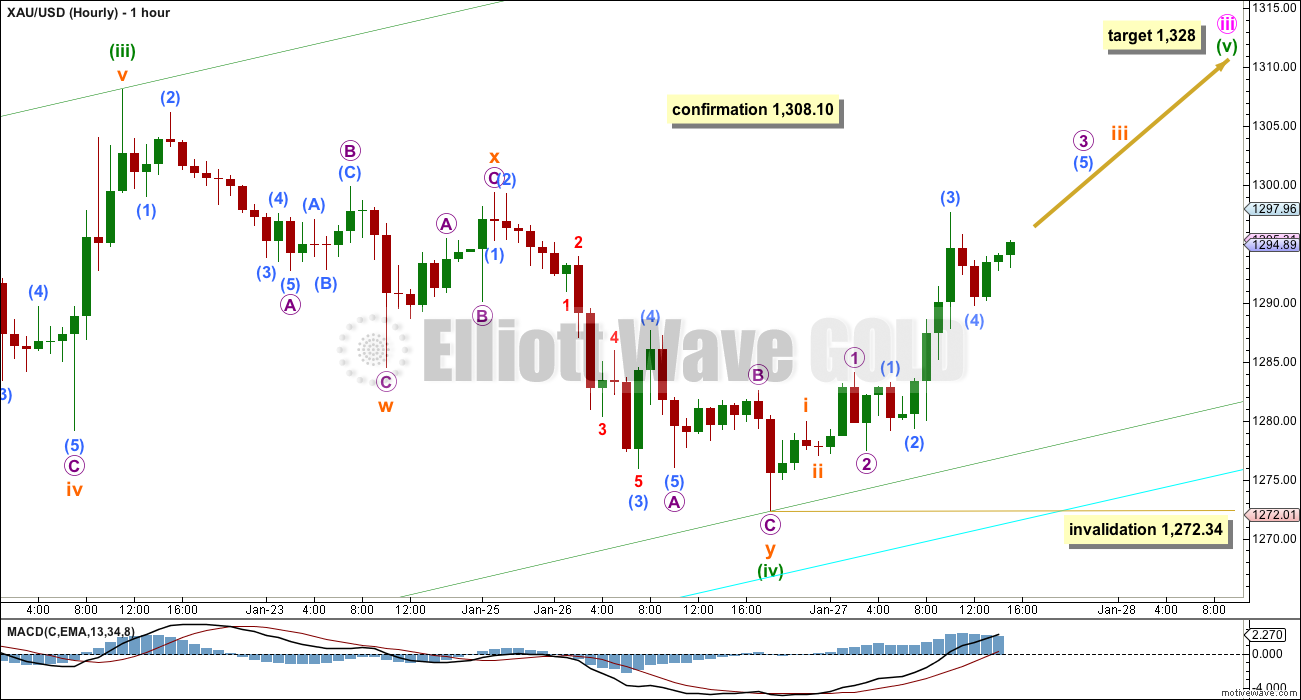
If minuette wave (iv) is over now it subdivides reasonably well as a double zigzag. Minuette wave (ii) was a shallow 33% single zigzag, and now minuette wave (iv) is a shallow 35% double zigzag. There is minimal alternation between these two waves, and this must reduce the probability of this main wave count today.
There was no Fibonacci ratio between minuette waves (i) and (iii). I would expect to see a Fibonacci ratio for minuette wave (v) to either of (i) or (iii). Because equality with the first wave is the most common ratio for a fifth wave, the target is at 1,328. If minuette wave (v) is a strong fifth wave typical of commodities this target may be too low.
Within minuette wave (v) no second wave correction may move beyond the start of its first wave below 1,272.34. If this main wave count is invalidated at the hourly chart level then I would consider the possibility that minuette wave (iv) is continuing sideways as a flat correction, and I would move the degree of labelling within it all down one degree. This is unlikely though because it would see minuette wave (iv) disproportionate to minuette wave (ii), which would give the wave count an odd look at the daily chart level.
Alternate Daily Wave Count
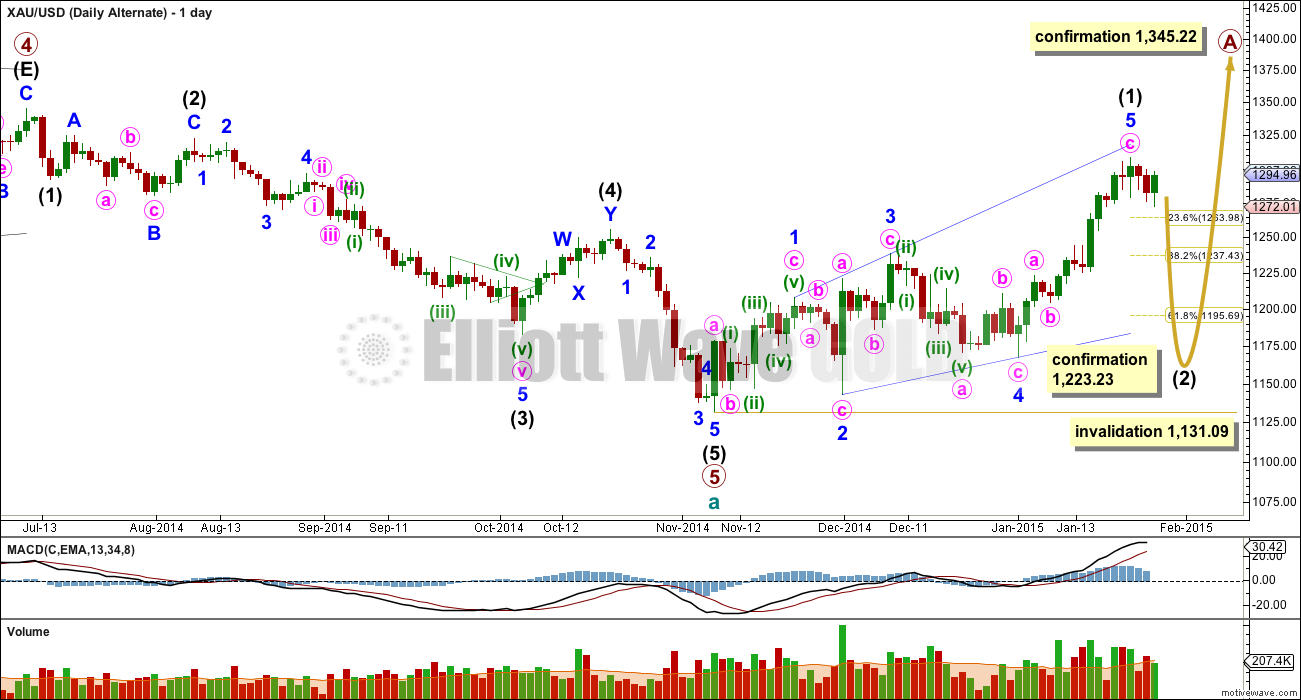
It is entirely possible that there was a leading expanding diagonal as the first five up within primary wave A. For diagonals, the contracting variety is more common than expanding and ending diagonals are more common than leading. While a leading expanding diagonal is not rare, it is not very common either. This reduces the probability of this wave count to less than the probability of the main wave count above.
Within leading diagonals the second and fourth waves must subdivide as zigzags. The first, third and fifth waves are most commonly zigzags but they may also be impulses. This wave count sees minor waves 1, 3 and 5 as zigzags.
Because minor wave 5 is a zigzag it would be over here. A-B-C and 1-2-3 (how the main wave count sees this movement) have exactly the same subdivisions. Because I am reasonably confident I have this movement for minute wave c labelled correctly on the hourly chart as a complete five wave impulse this is where the main wave count now diverges from this alternate and the second alternate below. If this upwards wave is a zigzag it must end here. If it is an impulse it needs a final fifth wave up.
Leading diagonals are almost always followed by very deep second wave corrections, often deeper than the 0.618 Fibonacci ratio. This wave count expects a big deep correction downwards, and should subdivide as a clear three on the daily chart (the second alternate below expects a clear five down).
Intermediate wave (2) may not move beyond the start of intermediate wave (1) below 1,131.09.
Second Alternate Daily Wave Count
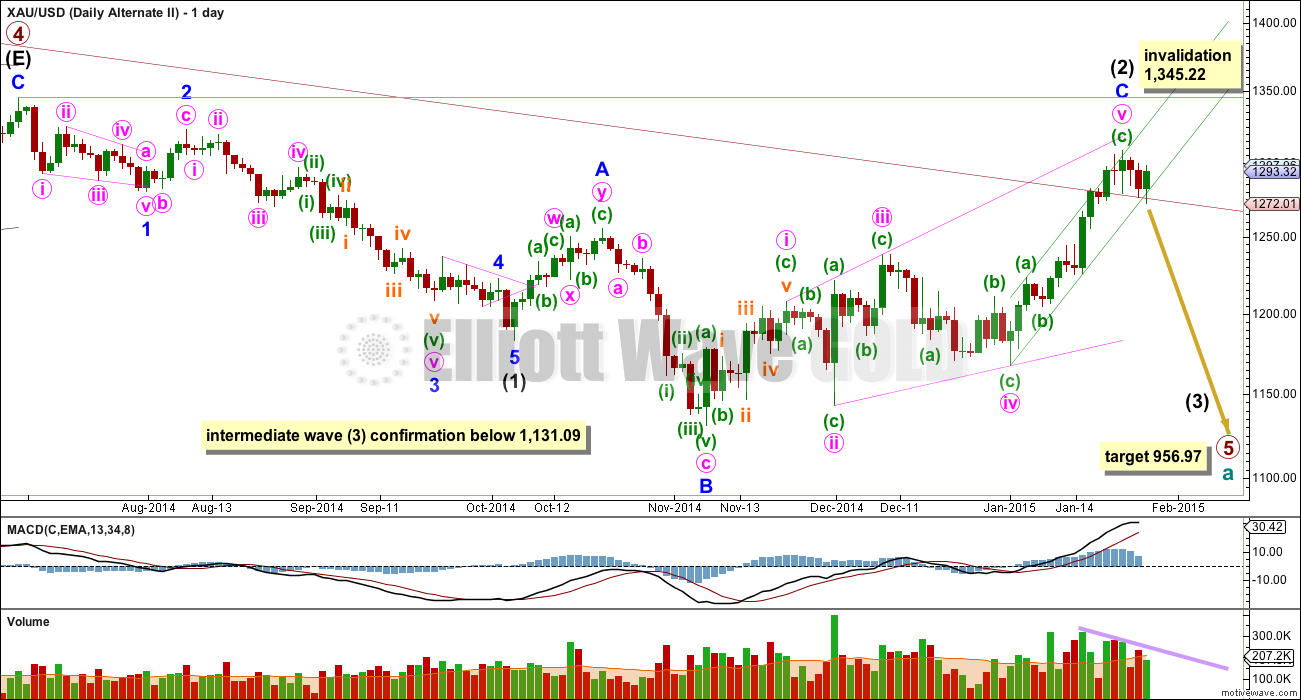
The maroon channel about cycle wave a from the weekly chart is now breached by three daily candlesticks, and is now also breached on the weekly chart by one weekly candlestick. If cycle wave a is incomplete this channel should not be breached. For this reason this wave count, despite having the best fit in terms of subdivisions, must now be relegated to a less likely alternate. It now has to prove itself if it is to be considered with any weight again. It still has not done this today.
Draw the maroon trend line on a weekly chart on a semi-log scale, and copy it over to a daily chart also on a semi-log scale (see this analysis for a weekly chart).
Within primary wave 5 intermediate wave (1) fits perfectly as an impulse. There is perfect alternation within intermediate wave (1): minor wave 2 is a deep zigzag lasting a Fibonacci five days and minor wave 4 is a shallow triangle lasting a Fibonacci eight days, 1.618 the duration of minor wave 2. Minor wave 3 is 9.65 longer than 1.618 the length of minor wave 1, and minor wave 5 is just 0.51 short of 0.618 the length of minor wave 1.
Intermediate wave (2) is now a complete expanded flat correction. Minor wave C is longer than 1.618 the length of minor wave A, and there is no Fibonacci ratio between them. Minor wave C is now a complete expanding ending diagonal.
Within an ending diagonal all the sub waves must subdivide as zigzags. The fourth wave should overlap first wave price territory. The rule for the end of a fourth wave of a diagonal is it may not move beyond the end of the second wave.
A-B-C and 1-2-3 subdivide exactly the same. For this idea the final zigzag of the ending diagonal must now be complete. If a new high is seen then minute wave v will not be a zigzag and I may discard both the alternate wave counts. But if we see a larger correction develop from here this wave count will remain valid. I will continue to publish it because the implications are important; a third wave down at intermediate degree may be beginning.
Although Gold almost always adheres perfectly to trend channels, almost always is not the same as always. This wave count is still possible. If we see a clear five down begin from here and momentum builds, we may be seeing the beginning of a third wave down.
A new low below 1,131.09 would confirm that a third wave down is underway.
At 956.97 primary wave 5 would reach equality in length with primary wave 1.
Intermediate wave (2) may not move beyond the start of intermediate wave (1) above 1,345.22. If this invalidation point is passed this wave count would be fully invalidated and finally discarded.
I have two hourly charts for you for this wave count. The low volume for today’s green candlestick supports this wave count.
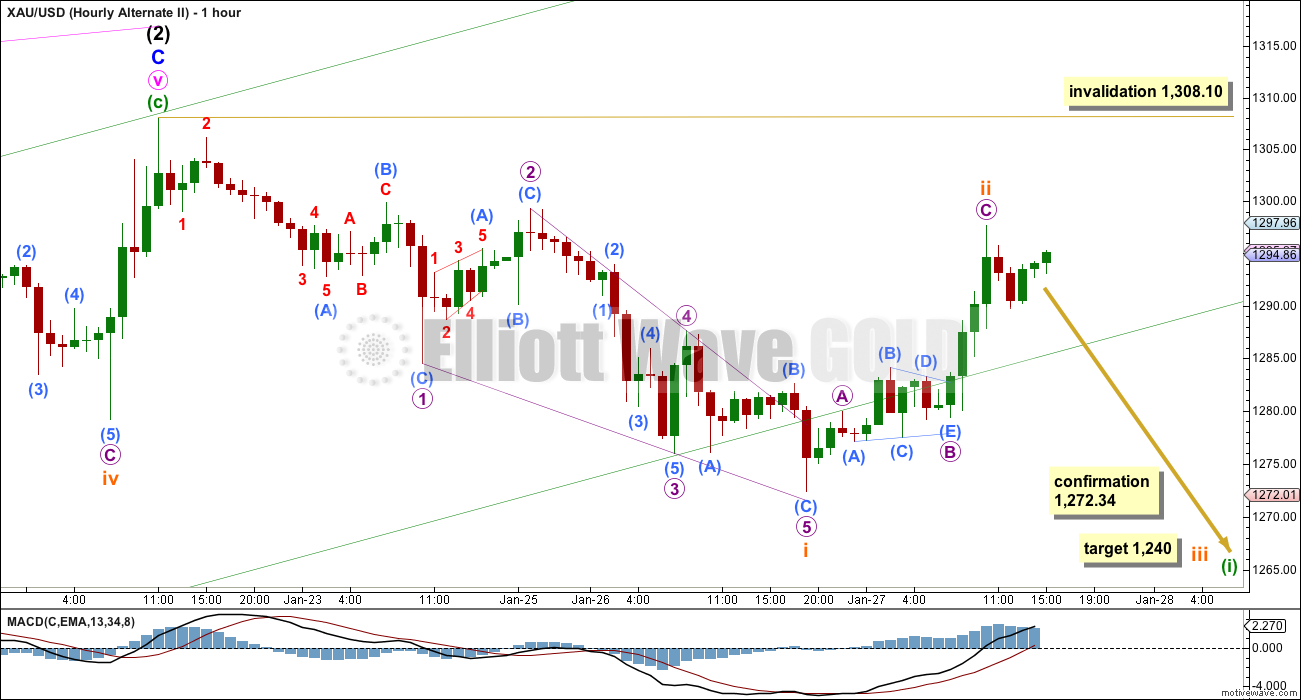
I cannot see downwards movement as a complete impulse, but it does fit as a leading contracting diagonal. The only problem with this idea is the small overshoot of the 2-4 trend line within the fifth wave for submicro wave (B). Diagonals should adhere closely to their trend lines and this one does not. This is why I have a second chart for this wave count at the hourly level for you today.
The subdivisions fit perfectly for a leading contracting diagonal, and the wave lengths fit perfectly. The trend lines converge clearly. Contracting diagonals, particularly for leading diagonals, are more likely than expanding diagonals. Although this one does not fit perfectly within its trend lines it is still more likely than the second hourly chart below.
Micro wave 2 is a .63 correction of micro wave 1, and micro wave 4 is a .50 correction of micro wave 3. Neither of these waves are within the common depth for second and fourth waves of diagonals of between .66 to .81.
If subminuette wave i is a complete leading diagonal then we should expect a very deep correction for subminuette wave ii. So far upwards movement fits nicely as a completed zigzag which is a 71% correction of subminuette wave i. Subminuette wave ii would be very likely to be over here. This wave count now should expect an increase in downwards momentum as a third wave down builds. Subminuette wave iii must move below the end of subminuette wave i below 1,272.34. This would provide confidence in this wave count.
At 1,240 subminuette wave iii would reach 1.618 the length of subminuette wave i.
It is still possible that subminuette wave ii could continue higher as a double zigzag, or my labelling of its subdivisions is wrong and it is incomplete. It may not move beyond the start of subminuette wave i above 1,308.10. If subminuette wave ii moves higher then the target must also move correspondingly higher.
Another possibility is that we may be seeing a leading expanding diagonal unfolding in a first wave position. This is a less likely structure than a contracting diagonal.
The subdivisions for this idea fit, but there is a small truncation at the end of micro wave A within subminuette wave iii.
Subminuette wave ii is a .63 correction of subminuette wave i, and subminuette wave iv is a .94 correction of subminuette wave iii. Neither of these waves is within the common depth of between .66 to .81.
Leading diagonals may not have truncated fifth waves. Subminuette wave v must make a new low below the end of subminuette wave iii below 1,272.34 for this wave count to remain valid.
Subminuette wave iv may not move beyond the end of subminuette wave ii above 1,297.71.
This analysis is published about 04:14 p.m. EST.
Miners off 4%+ GLD just won’t let go….
Interesting that a lot of demand came into the miners in the last hour of trading yesterday.
http://www.marketwatch.com/story/patient-fed-shows-no-signs-of-wavering-on-rate-hikes-2015-01-28
Gold faces biggest test in years, right now – Wednesday January 28th, 2015
http://bit.ly/1CzgZwA
EW Leader Lara, Shin your Elliott Wave Light, Show us the Path Up or Down
Did the low at 9:15 of 183.46 just invalidate the main wave count ?
see hr chart
No 1283.46 at 9:19 did not invalidate main wave count as it would have to be below 1272.34 for invalidation of main.
the multi month inverse H&S is of interest and targets $1345. I believe we get there per Lara’s main wave count IF $1308 is taken out. FOMC this afternoon should give us a pretty good idea as gold volatility usually picks up afterwards.
That will be a double top of July 2014 top at 1346.
A massive HnS may develop for next multi year bull trend.
If that happens????
FOMC 2 pm Wednesday minutes released.
I think if the Fed wants to go ahead with summer interest rate hike gold may drop at 2 pm.
Fastest instant news website, not all headlines have articles.
http://www.marketwatch.com/newsviewer
One world class gold forecaster told me tonight Wednesday miners drop or it is their last up day and then down for weeks.
Still long my 2/3 position in JDST, although today I took it in the teeth today. Waiting until 2:30 tomorrow to see what count we are in.
Gold miner GDM is targeted 733.
Lara, can we get a GDX update later this week after the FOMC meeting ? Thursday or Friday is fine for me, I’d like to see the update so I can position before the weekend. Thanks!
Will get GDX and Silver updated today. I won’t have time tomorrow, so its today or not at all this week.
You are a fabulous host!
Thanks Lara, GDX much appreciated!
Thank you Lara.
Added to my JDST position.
Expecting pullback / short term decline for a break below 1289 for 1278-77. Further downside risk 1274-73. Upside move also expecting for 1302-03, 1306-07 subject to break above 1295-95…. Looking to go long on the drop (main wave count).
The miners are looking more bullish than gold here and just got a “buy” signal on AmericanBulls today. GDX is only 1.5% away from a new high. Watch to see if GDX breaks above 23.22 tomorrow.
Fundamentally gold has been in inverse relation to USD. USD is in long term up trend and expected to rise substantially. One can not expect atleast now that USD and gold can rise together. Some thing to give here soon.
Also if one looks at the ratio of gold to oil it is very high at 28. Norm is around 15.
Additionally from jan onward gold is entering seasonality for going down. Last year March was high of the season at around 1380. This time January made it earlier. going to summer look for lower highs and lower lows like last year in this season.
This is a situation where fencepost has a lifetime of experience…one foot on each side of the fence. I am looking for hints of which foot is right.
You have a friend joining you. She may need a drink!
Lara, “Today, I will sit uncomfortably on the fence.”