
I had expected a breakout within the last 24 hours, but price continues sideways in an ever narrowing range. We still need a breakout to tell us which Elliott wave count is correct.
Summary: A new high above 1,308.10 would confirm the main wave count and invalidate both alternates. This would provide earliest indication that Gold may be in a new multi-year upwards trend. Alternatively, a new low below 1,272.34 would provide confidence in both alternates and substantially reduce the probability of the main wave count. Today, I will sit uncomfortably on the fence. Price will tell us which wave count is correct, and we need to apply patience while we wait for an answer.
Click on charts to enlarge.
Main Daily Wave Count
This wave count now has a close to even probability with the two alternates. Depending on what happens over the next few days I may swap them over again. The situation is unclear. Normally I have only one wave count, with occasional less likely alternates. Sometimes I have to present alternates to you with an even probability and wait for the market to tell us which is correct, and this is one of those times. Use your own technical analysis and judgement to determine which you see as more likely.
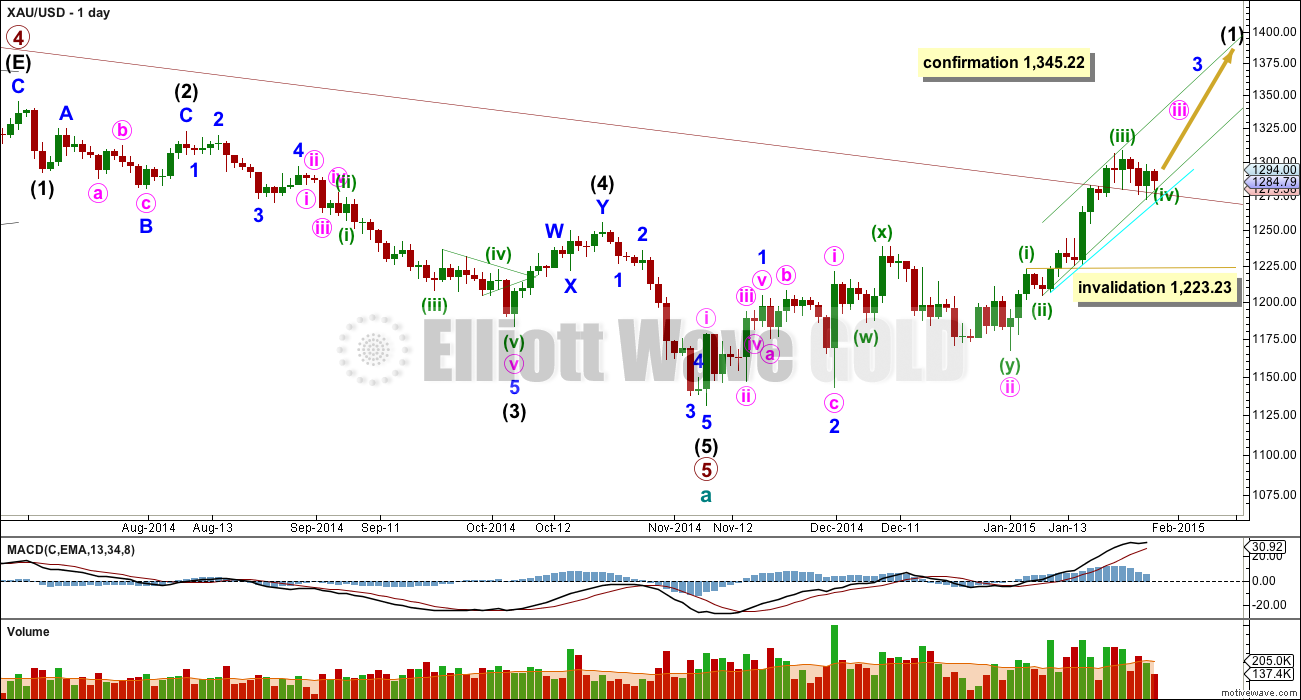
This wave count sees a five wave impulse down for cycle wave a complete, and primary wave 5 within it a completed five wave impulse. The new upwards trend at cycle degree should last one to several years and must begin on the daily chart with a clear five up. The first five up is most likely to be an impulse which is what this wave count looks at.
My biggest problem with this wave count, and the reason I will retain the second alternate, is the structure of intermediate wave (2) within primary wave 5. This is a rare running flat but the subdivisions don’t fit well. Minor wave C should be a five wave structure, but it looks like a clear three on the daily chart. If you’re going to label a running flat then its vital the subdivisions fit perfectly and this one does not. I still have a big concern with this wave count for this reason.
Intermediate wave (5) still looks like a zigzag rather than an impulse, and has a corrective wave count. This is also a problem I have with this wave count.
This wave count fits with momentum at the daily chart level. The middle of a third wave may have recently passed, and now a series of two more fourth wave corrections and fifth waves up may be required to complete minor wave 3.
For this wave count minuette waves (i), (ii) and (iii) are seen with exactly the same subdivisions as minute waves a, b and c for the first alternate (and one degree lower for the second alternate) because they both subdivide 5-3-5. If we have one more high then this upwards movement from the last low at 1,167 (minute wave ii) will be a complete impulse. If we do not have one more high then the upwards movement from minute wave ii would be a correction, not an impulse. This is the core of the lack of clarity: is this movement finished yet or not?
Leave the green channel about minute wave iii drawn using Elliott’s second technique as if minuette wave (iv) is over. Draw the channel with the first trend line from the ends of minuette waves (ii) to (iv), then place a parallel copy on the end of minuette wave (iii). Minuette wave (v) may end about the upper edge. It is also possible that minuette wave (v) could be a strong fifth wave typical for commodities and may overshoot the upper edge of the channel.
As it continues further minuette wave (iv) may not move into minuette wave (i) price territory below 1,223.23.
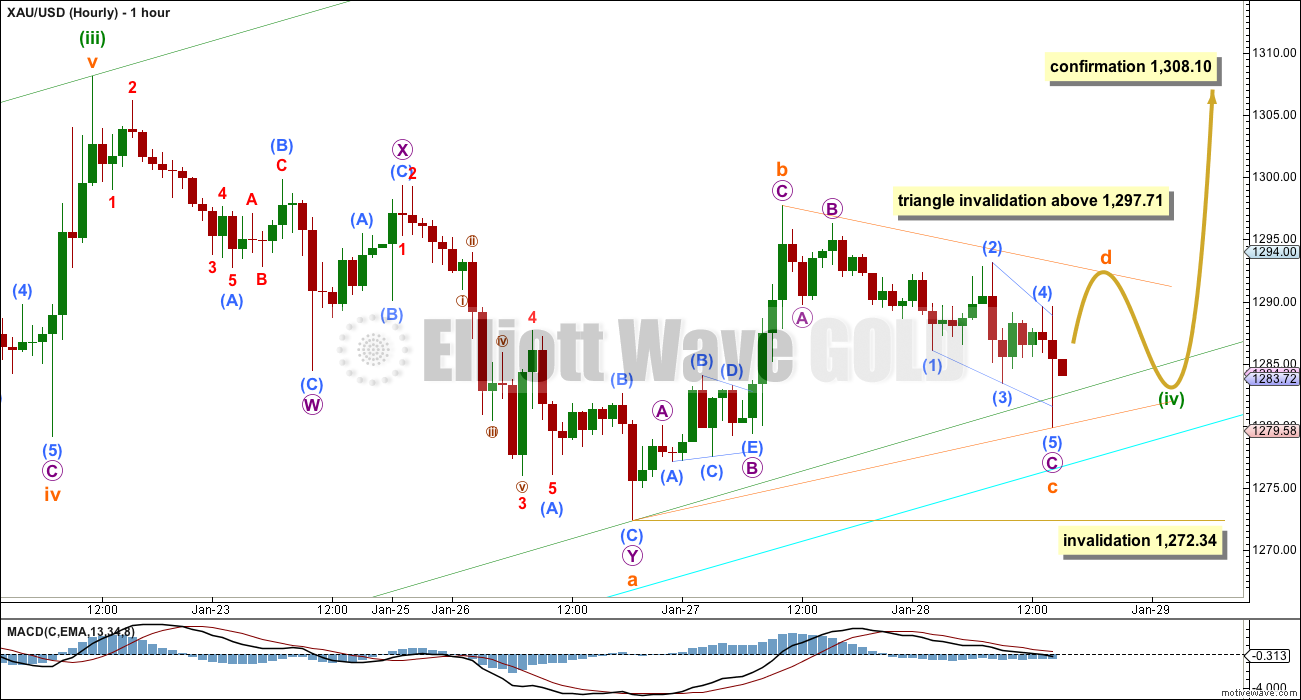
At this stage it looks like minuette wave (iv) may be moving sideways as a regular contracting triangle. The purpose of triangles is to take up time and move price sideways. They tend to severely test our patience, and this fits nicely as an explanation of the sideways chop of the last few days. This would provide good alternation with the zigzag of minuette wave (ii) and resolve the problem I had yesterday of a lack of alternation between these two waves.
Triangles are relatively time consuming corrective structures, particularly in comparison to zigzags. This wave count makes sense if minuette wave (ii) is a quick zigzag lasting only two days and minuette wave (iv) as a triangle lasting longer. It may end in another one or even four days, totalling a Fibonacci five or eight days.
Reducing volume on the daily chart supports the idea of a triangle forming.
Within the triangle subminuette wave c may not move beyond the end of subminuette wave a below 1,272.34.
Subminuette wave d may not move beyond the end of subminuette wave b above 1,297.71.
Finally, subminuette wave e is very likely to fall short of the a-c trend line, and it may not move beyond the end of subminuette wave c (wherever it ends).
Overall, if minuette wave (iv) is continuing as a triangle then we may see a continuation of this sideways movement, in an ever decreasing range, for another couple of days or maybe even three days. The breakout for this main wave count would be expected to be upwards.
Fifth waves following fourth wave triangles are often shorter and more brief than expected; they can be surprisingly short and brief indeed. I would expect if this wave count is correct the final fifth wave to end only a little above 1,308.10. It would most likely be about $34 in length, 0.618 the length of minuette wave (i). It may be over very quickly within one day.
When the sideways chop fits as a completed Elliott wave triangle, then a new high at that stage above the end of subminuette wave b at 1,297.71 would be earliest indication of an upwards breakout. Only a new high above 1,308.10 would be full confirmation of this wave count.
At this stage I cannot see how this sideways movement could fit as the start of a double combination, because there is already a multiple within the first downwards wave of subminuette wave a.
A new low below 1,272.34 would invalidate this wave count and provide a lot of confidence for the two alternates below.
Alternate Daily Wave Count
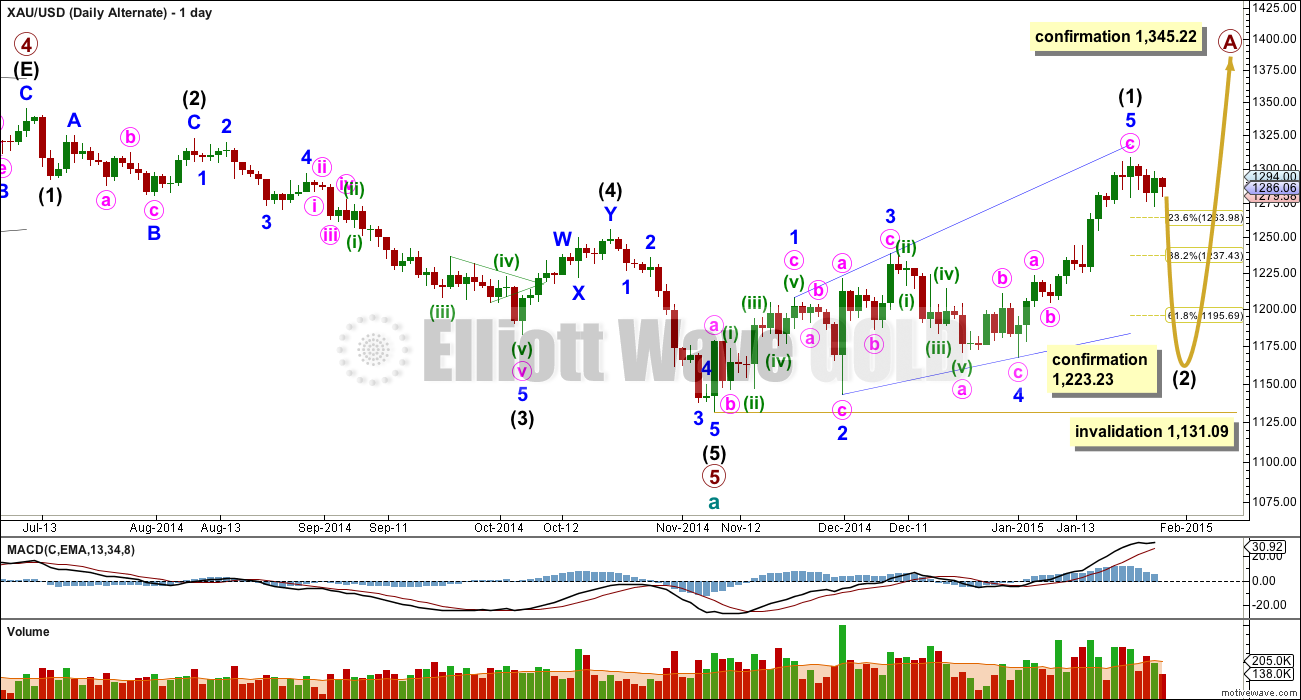
It is entirely possible that there was a leading expanding diagonal as the first five up within primary wave A. For diagonals, the contracting variety is more common than expanding and ending diagonals are more common than leading. While a leading expanding diagonal is not rare, it is not very common either. This reduces the probability of this wave count to less than the probability of the main wave count above.
Within leading diagonals the second and fourth waves must subdivide as zigzags. The first, third and fifth waves are most commonly zigzags but they may also be impulses. This wave count sees minor waves 1, 3 and 5 as zigzags.
Because minor wave 5 is a zigzag it would be over here. A-B-C and 1-2-3 (how the main wave count sees this movement) have exactly the same subdivisions. Because I am reasonably confident I have this movement for minute wave c labelled correctly on the hourly chart as a complete five wave impulse this is where the main wave count now diverges from this alternate and the second alternate below. If this upwards wave is a zigzag it must end here. If it is an impulse it needs a final fifth wave up.
Leading diagonals are almost always followed by very deep second wave corrections, often deeper than the 0.618 Fibonacci ratio. This wave count expects a big deep correction downwards, and should subdivide as a clear three on the daily chart (the second alternate below expects a clear five down).
Intermediate wave (2) may not move beyond the start of intermediate wave (1) below 1,131.09.
Second Alternate Daily Wave Count
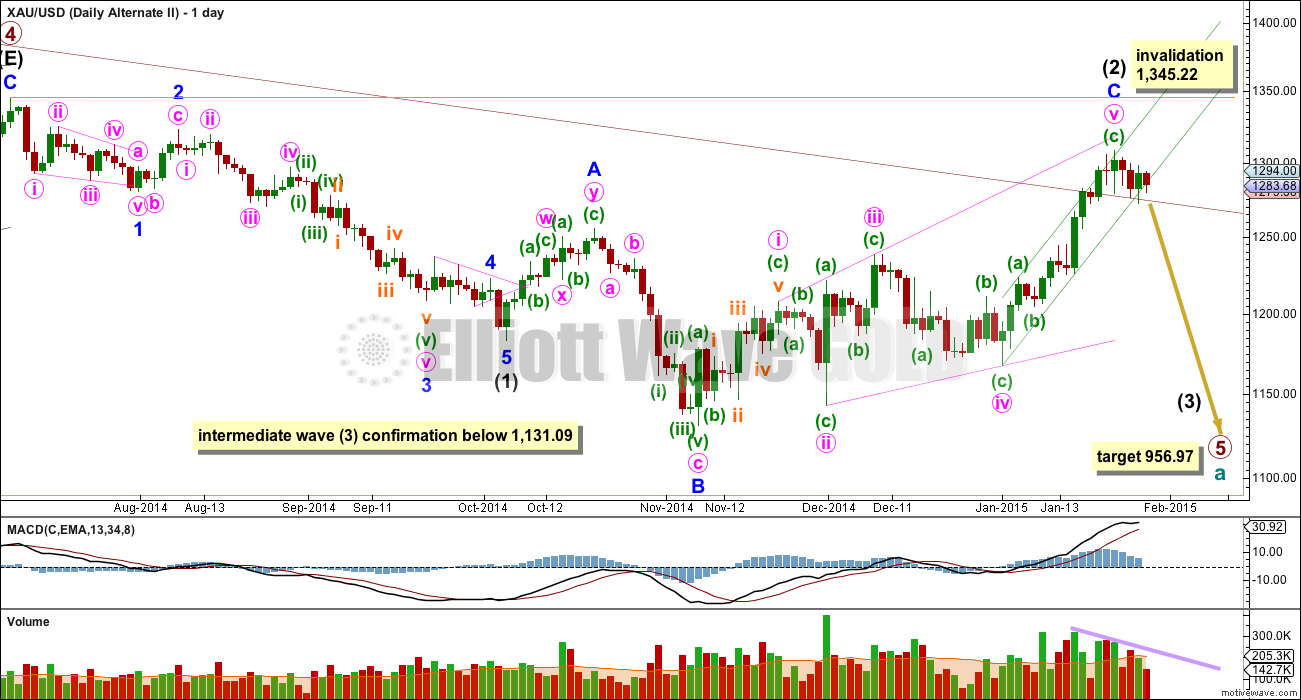
The maroon channel about cycle wave a from the weekly chart is now breached by four daily candlesticks, and is now also breached on the weekly chart by one weekly candlestick. If cycle wave a is incomplete this channel should not be breached. For this reason this wave count, despite having the best fit in terms of subdivisions, must now be relegated to a less likely alternate. It now has to prove itself if it is to be considered with any weight again. It still has not done this today.
Draw the maroon trend line on a weekly chart on a semi-log scale, and copy it over to a daily chart also on a semi-log scale (see this analysis for a weekly chart).
Within primary wave 5 intermediate wave (1) fits perfectly as an impulse. There is perfect alternation within intermediate wave (1): minor wave 2 is a deep zigzag lasting a Fibonacci five days and minor wave 4 is a shallow triangle lasting a Fibonacci eight days, 1.618 the duration of minor wave 2. Minor wave 3 is 9.65 longer than 1.618 the length of minor wave 1, and minor wave 5 is just 0.51 short of 0.618 the length of minor wave 1.
Intermediate wave (2) is now a complete expanded flat correction. Minor wave C is a complete expanding ending diagonal.
Within an ending diagonal all the sub waves must subdivide as zigzags. The fourth wave should overlap first wave price territory. The rule for the end of a fourth wave of a diagonal is it may not move beyond the end of the second wave.
A-B-C and 1-2-3 subdivide exactly the same. For this idea the final zigzag of the ending diagonal must now be complete. If a new high is seen then minute wave v will not be a zigzag and I may discard both the alternate wave counts. But if we see a larger correction develop from here this wave count will remain valid. I will continue to publish it because the implications are important; a third wave down at intermediate degree may be beginning.
Although Gold almost always adheres perfectly to trend channels, almost always is not the same as always. This wave count is still possible. If we see a clear five down begin from here and momentum builds, we may be seeing the beginning of a third wave down.
A new low below 1,131.09 would confirm that a third wave down is underway.
At 956.97 primary wave 5 would reach equality in length with primary wave 1.
Intermediate wave (2) may not move beyond the start of intermediate wave (1) above 1,345.22. If this invalidation point is passed this wave count would be fully invalidated and finally discarded.
I have two hourly charts for you for this wave count. A continuation of declining volume, including declining volume on down days, no longer supports this wave count. If a third wave down is beginning then we should see volume and momentum increasing on down days.
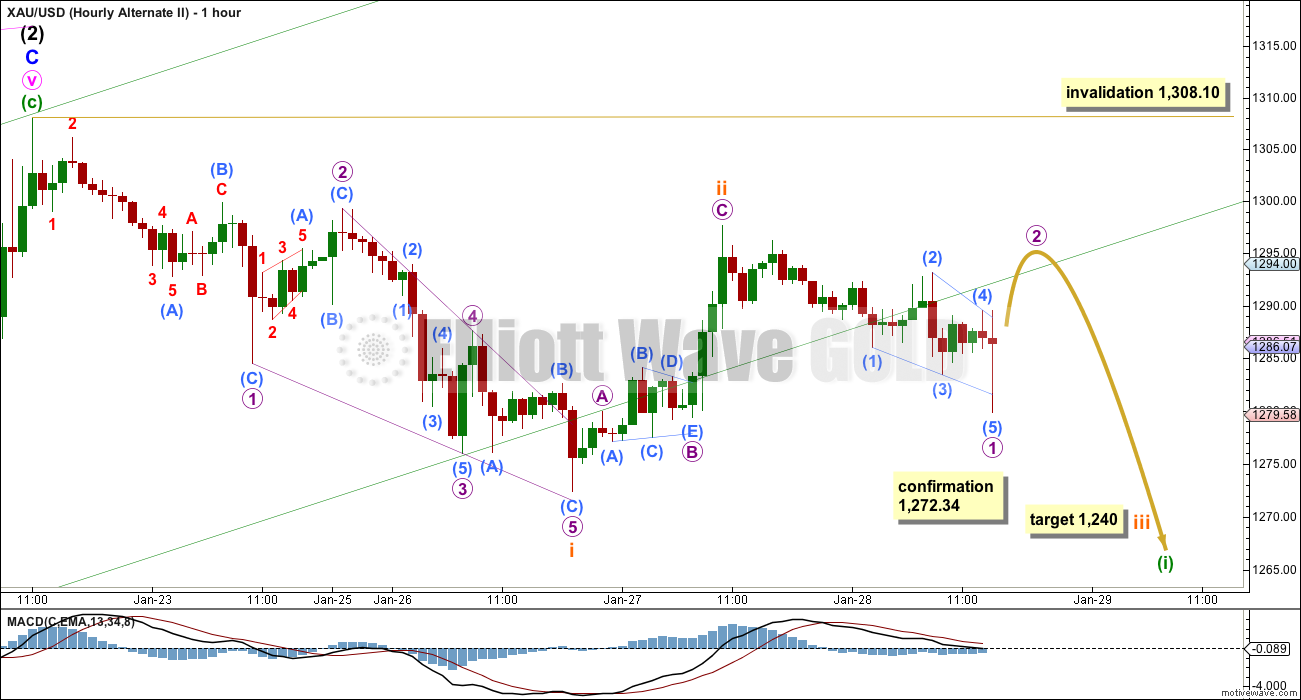
For this idea today there may now be two overlapping first and second waves. This idea would expect an imminent increase in downwards momentum.
Alternatively, subminuette wave ii may still be incomplete. It may continue higher as a double zigzag. For this reason I leave the invalidation point at 1,308.10. Second wave corrections following first wave diagonals are often very deep indeed, correcting close to 100% of the first wave. I will allow this wave count room to move because it may do so to have a typical look.
If subminuette wave iii has begun then at 1,240 it would reach 1.618 the length of subminuette wave i.
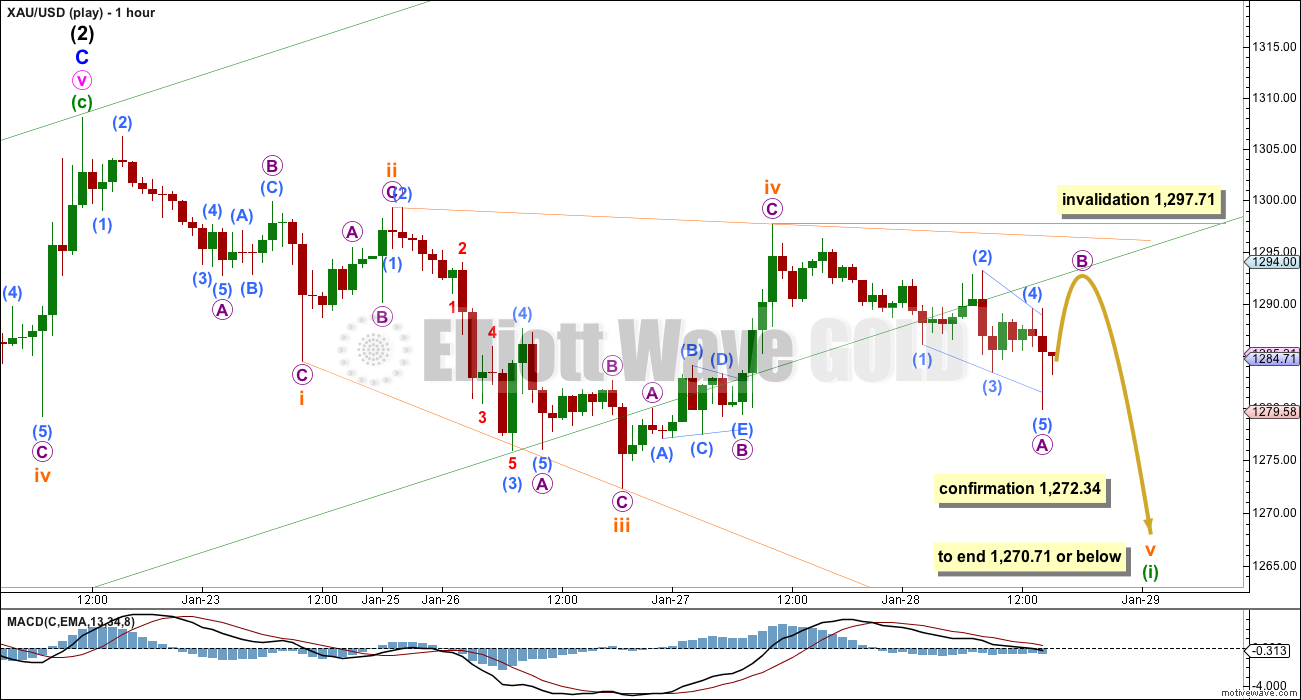
A leading expanding diagonal is also still possible for a first wave down, but these are not very common structures so this idea must have a lower probability.
The fifth wave of a leading diagonal may not be truncated. This wave count requires a new low below 1,272.34.
Fifth waves of expanding diagonals usually end short of the i-iii trend line. The fifth wave should be longer than the third wave so should reach down to 1,270.71 or below.
This analysis is published about 03:55 p.m. EST.
Usually means volatility.
29 Jan report is posted
Here is a View: An initial break below 1265 today opened up further downside to the 123x, 122x zones and Gold price easily broke below 200dma 1254; next to fall would likely be 20dma 1249-48 for lower; possibly 50/100dma…. For now, with 1251 holding, upside is curtailing
1258-69 with 1276-77 on the outside…. Let’s see how this closes today, RSI / MACD may be helpful here to position one’s trades //// @AL: with a low range close today, continuation to the downside ought to follow. I would expect an upside move though.
I am just wondering regarding a new low below 1131.09 confirming continuation of primary wave 5; is a long way off with the lower band currently sitting at 1181….This should be interesting.
GDXJ lower target RS $23.98 to 22.68, not sure why chart cuts off right side?
https://www.dropbox.com/s/i5nw4tmyf6q83au/GDXJ%20HOURLY%2029%20JAN.png?dl=0
I am again posting this chart. because this could happen
started from 1131 in daily chart.
moved to 1236 and retraced 61.8 to 1167 then moved 1.27 to exactly 1307…… now should move 1.618 or 2.1618
Bearish ABCD pattern
That would be Daily alternate with confirmation at $1,345.22 (1.618)
The above pattern is Harmonic pattern
only if it is extended bearish abcd then it can move to 1.618 if its classic it can move to 1.27
Waseem, please excuse the obvious — but WHAT chart. I see none included in your post. Thank you.
i hope you get it now
thank you Waseem for sharing this with us.
Heading down fast, looks like we are heading to 956!!!
Vote???? Today which alt wave will be the main wave?
Primary wave is invalidated already.
Thanks.
I vote for the second alternate. Its my preferred choice, but this is instinct only and not a judgement based on probability.
Based on probability I’d have to say the two alternates are even.
I don’t like to pick a winner, I prefer price to tell us which one is right. A new low below 1,131.09 would tell us primary wave 5 is continuing.
I vote for second alternate as well. And I applaud the integrity you have in representing the other probable counts.
on DUST looks to me like we just complete iii, I think buying back in the low 9’s would be a good play
I like the second ALT on gold
Are you are saying it is the hourly Alt II ?
If we just completed iii then we would retrace back up in iv.
You like buying in low 9’s that would be well above 1,300 gold. Are you suggesting the gold will correct back up above $1,300 to retrace wave iv?
I don’t understand how that is possible.
sorry Richard, meant on JDST
I sold my DUST too soon and want to get back in best wave.
at 11:00 am which chart are we in (hourly alt II) or (play)
which wave are we in at 11:00 AM and the target?
Not sure which way is next up or down and which wave (ii) or (iii) and target to switch direction?
Are we right now heading down to 1255 before correcting up?
WOW! This is heading for a break below 1255 in double quick time! lol…. 🙂
Do you think this is just a pullback after which gold will rally? Or do you see a further downwards continuation?
Bob b
I tried to replicate the Kimble chart below.
It is a line daily 15 year chart with parabola.
Interesting. Why the parabola? Seems to fit well and shows the back test. Is it because a straight trend line wouldn’t work?
At the opening JNUG traded at the HnS neckline and is slightly above it.
Once it breaks below I will be in JDST.
JNUG chart is posted below.
Sold a portion of Jdst in premarket to take some profits. I’m expecting GDXJ to bounce after the open and gold to recover some considering futures expire today.
Great trade!!!
Sold another jdst portion at $9.7, bought JNUG to hedge the rest of my JDST.
Richard
I am answering my own question below. I suspect now that Gold has dropped below the two trend lines the alternate ii will become the primary wave. She may declare int (2) C wave complete very soon.
Everyone was too bullish gold. I think first alternate becomes primary count. 2nd wave correction will deep causing everyone to think this was a bear market rally and get too bearish. It’s hard to ignore the strength from $1131-$1308 and it was deeper than it should have been. Nonetheless, we should see a deep correction below $1200.
Correct Lara called deep correction in alt i wave to 1223. AND then back up to 1340ish?
Thanks for your great comment.
Name me anybody not who is not bullish now cause of that rally?
the most analysts talking about a trend change now and see all what will come to the downside as corrective.
Thats the reason why i think we will make new lows. The Cot-report
The 1300er levels would never have been met if the SNB did not had shock the markets.
The COT report was the game changer at 1307.
Readers should revisit the last Mondays discussions on COT report. Commercial shorts 420000 is huge. I like some to show us stat that huge in recent time that is from 2013 to todate.
When you say gold will make new low means below 1130?????
Any idea how high GOLD will correct up from overnight low Thursday AM as it broke below 1272.34 at 4:46 am and hit 1,272.01? Good thing I bought DUST before the close!
Gold broke below 1272.34 at 4:46 am and hit 1,272.01 providing confidence in both Lara’s Daily Alternates and confirmation of the last two hourly charts and likely the top GDX chart. Price is clarifying the wave counts.
This action invalidated the main wave. There are two alternate waves.
Which wave will be main wave now?
I’m trying to post chart so it shows the full text
http://bit.ly/1CAbwWm
https://www.dropbox.com/s/ip5g86pa9c3evim/GDX%204%20HOUR.png?dl=0
Lara just posted her new GDX Analysis
GDX Chart done after close Wednesday Jan 28th, Lara look what I found!
Author’s reply » I don’t normally chart the miners on shorter timeframes, as I don’t really trade them that much and only use them to help with gold, but here is a 4hour chart on GDX after today.. either we topped or we have one final wave up before we top:
http://bit.ly/1CAbwWm
Gold did nothing today and is stretching everything out count wise.. breaking 1270 would be a good hint that it has topped.. otherwise there should be a last wave up to complete in the blue box – chart from today still counts.
Thanks Richard!
I think GDX exhibits truncations readily. Either that, or its impulses don’t always look correct. That third wave has a cursory count of 7 which is corrective /OR/ the second wave ended with a truncation /OR/ the second wave was a combination (doesn’t look like it though).
Ugh. GDX. It’s not easy that one.
Lara, can you reproduce these trend lines for a precise look? Looks like strong resistance and possible backtest here. A breakdown or breakout here could be key.
From Kimble Charting
Hi Bob.
I’m really REALLY accurate with my trend lines. When we trade (with my husband, we’re a team) we use a lot of trend line analysis. We anchor the lines very accurately on specific price points.
I’ve played with my monthly chart trying different price points (highs and lows) and I’m not able to replicate either of those trend lines.
They look to be drawn somewhat randomly actually.
*edit: just got it. Okay, will add to the monthly chart.
Bob thanks for reposting that chart. I found it yesterday and really liked it so added to Lara’s site.
As usual great stuff by Lara!…. Further pullback / downturn / short term decline is expecting…. With an inside day H 1294.60 / L 1280.1 range, can expect impulsive range breakout for a break below 1276…. Upside currently limited to 1295-99 with 1306-07 on the outside…. Playing the downside, upside move eventually expecting.
Early clue what to expect in PM sector???
Today after FOMC min released PM sector changed course. Below is a chart of intraday 2hour GDXJ top HnS in the making. Price has not broken the neckline.
Watch tomorrow’s trading. JNUG HnS was spotted earlier in the day.
Papudi, you should change your handle to ICHnS. It seems to be your thing.
That’s the best looking H&S you’ve posted here. Nice symmetry which is important to the pattern. Lara’s main wave count is reducing in probability by the hour which means I would favor the leading expanding diagonal count. However the aqua trendline needs to be breached and so far it’s found support there, but not bouncing big.
Thanks. It appears miners will gap down at the opening below the neckline.
Chapstic_jr
HnS pattern has some advance warning if one can spot the right shoulder. It is the most preferred patten for me.
Gold Futures expiration tomorrow.
Is that Good or bad for Gold prices??
Text of the Federal Reserve’s statement Wednesday
Associated Press
Wednesday January 28, 2015 9:24 AM
http://www.kitco.com/news/2015-01-28/Text-of-the-Federal-Reserve-s-statement-Wednesday.html