
A new low below 1,272.34 has provided the breakout we were waiting for. This invalidates the main Elliott wave count and confirms the Elliott wave alternate counts.
Summary: The short term target for this third wave is 1,240. I expect a red candlestick for Monday’s session to this target. When this third wave is done a following fourth wave correction should show up on the daily chart and may not move above 1,272.34.
Click on charts to enlarge.
Main Daily Wave Count
At this stage I judge this main wave count to have an even probability with the alternate below. I will let the structure of downwards movement, and momentum, tell us which wave count is correct over the next few weeks. At this stage they both expect more downwards movement so there is no divergence in the expected direction.
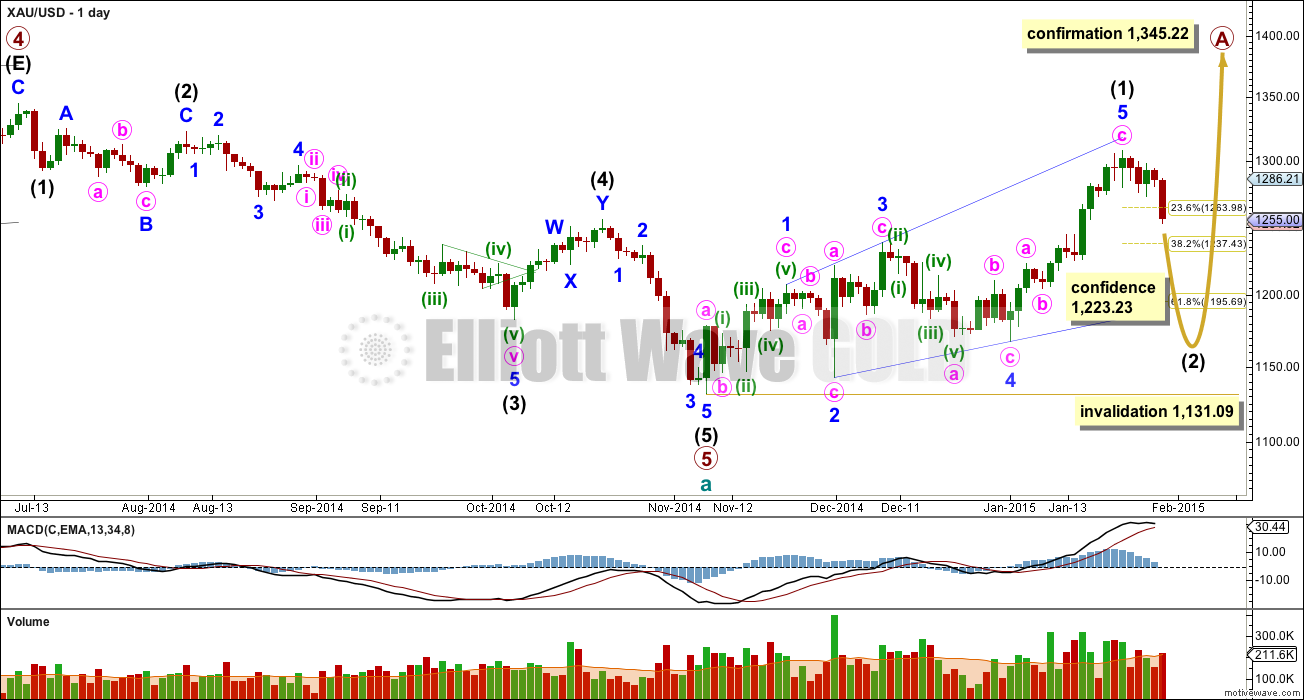
This wave count sees a five wave impulse down for cycle wave a complete, and primary wave 5 within it a completed five wave impulse. The new upwards trend at cycle degree should last one to several years and must begin on the daily chart with a clear five up.
It is entirely possible that there was a leading expanding diagonal as the first five up within primary wave A. For diagonals, the contracting variety is more common than expanding and ending diagonals are more common than leading. While a leading expanding diagonal is not rare, it is not very common either.
Within leading diagonals the second and fourth waves must subdivide as zigzags. The first, third and fifth waves are most commonly zigzags but they may also be impulses. This wave count sees minor waves 1, 3 and 5 as zigzags.
Leading diagonals are almost always followed by very deep second wave corrections, often deeper than the 0.618 Fibonacci ratio. This wave count expects a big deep correction downwards, and should subdivide as a clear three on the daily chart (the alternate below expects a clear five down).
My biggest problem with this wave count, and the reason I will retain the alternate, is the structure of intermediate wave (2) within primary wave 5. This is a rare running flat but the subdivisions don’t fit well. Minor wave C should be a five wave structure, but it looks like a clear three on the daily chart. If you’re going to label a running flat then its vital the subdivisions fit perfectly and this one does not. This problem is very significant and this is why I judge the two wave counts to be about even in probability..
Intermediate wave (5) still looks like a zigzag rather than an impulse, and has a corrective wave count. This is also a problem I have with this wave count.
Intermediate wave (2) is most likely to subdivide as a zigzag, which subdivides 5-3-5. When this 5-3-5 is complete then how high the following movement will tell us which wave count is correct.
Intermediate wave (2) of this new cycle degree trend may not move beyond the start of intermediate wave (1) below 1,131.09.
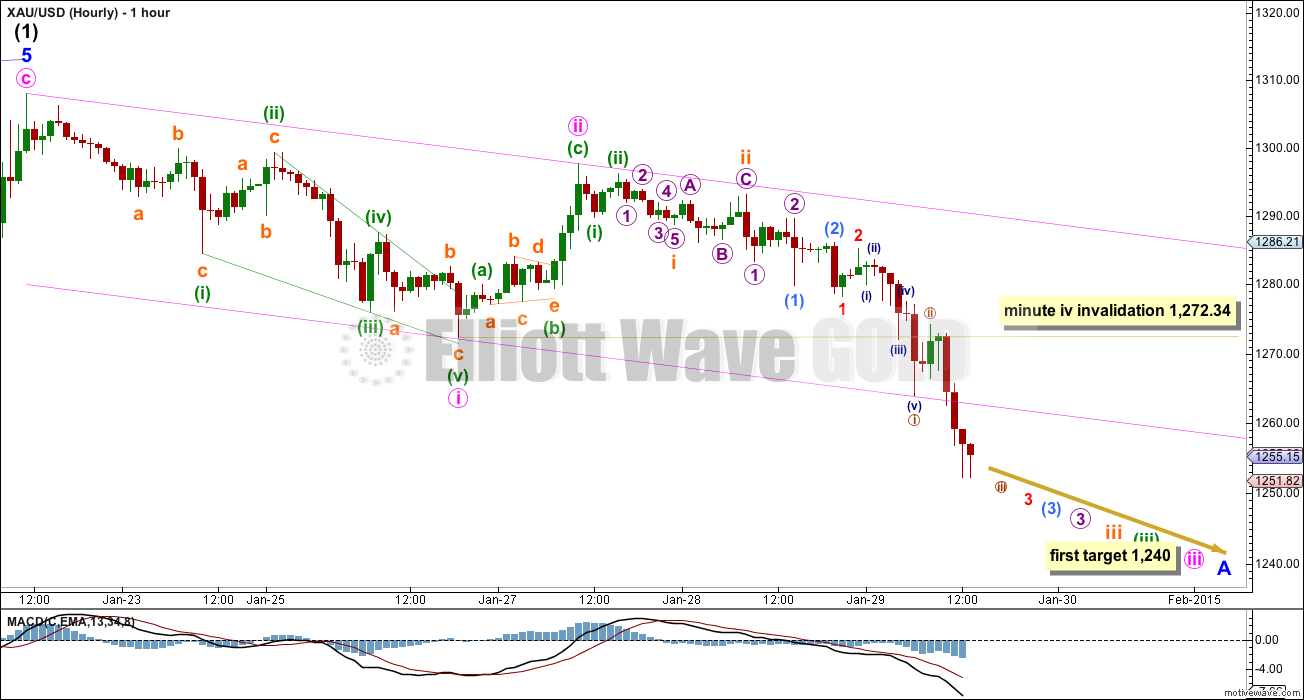
A third wave down is drawing to a close. A series of fourth and fifth waves are required to complete minute wave iii.
At 1,240 minute wave iii would reach 1.618 the length of minute wave i. The following upwards correction for minute wave iv should be shallow and should show up on the daily chart as one or more green candlesticks or doji. It may not move into minute wave i price territory above 1,272.34.
Draw a base channel about minute waves i and ii. Now that this channel is breached to the downside we may see the lower pink trend line provide resistance to upwards movement.
Minute wave iii should now show a slowing of momentum, and may end in another session.
This main hourly wave count expects minor wave A to subdivide as a five wave structure so that intermediate wave (2) is a zigzag. However, this is not the only possible structure for intermediate wave (2). When this current five wave impulse is complete I must have an alternate hourly wave count looking at the possibility that minor wave A may be a completed zigzag and intermediate wave (2) may be a flat, combination or double zigzag.
Alternate Daily Wave Count
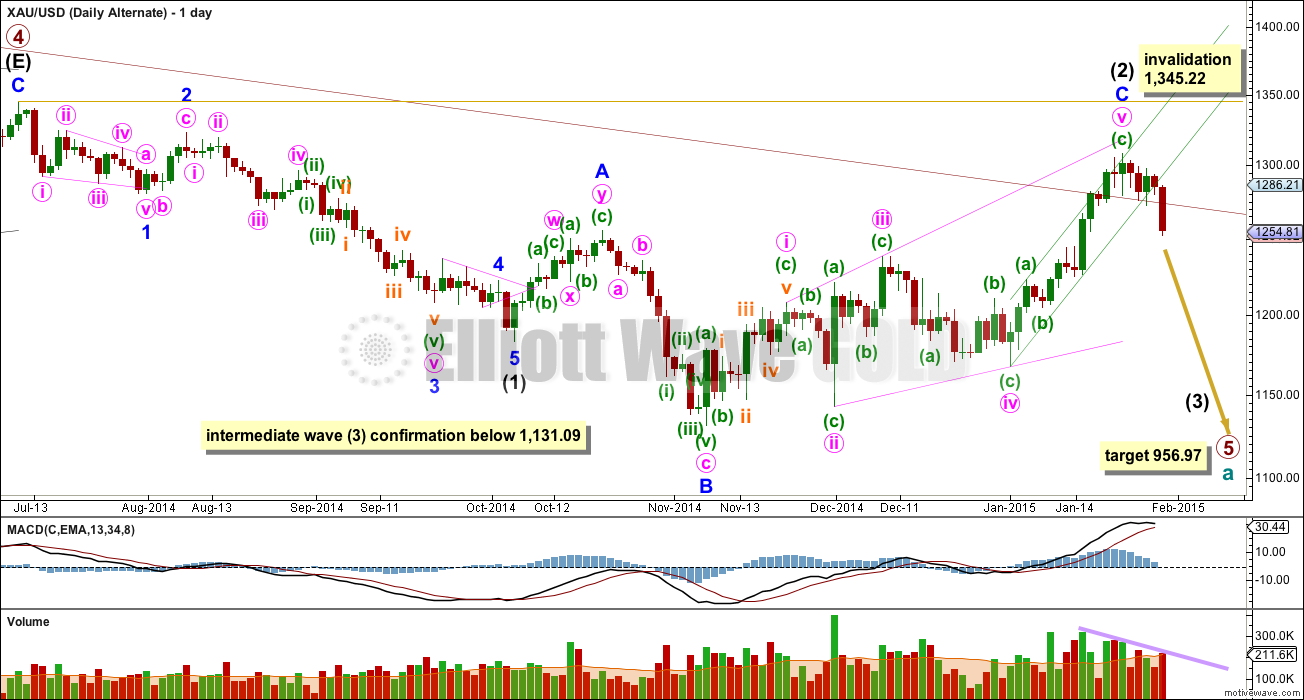
The maroon channel about cycle wave a from the weekly chart is now breached by four daily candlesticks, and is now also breached on the weekly chart by one weekly candlestick. If cycle wave a is incomplete this channel should not be breached. For this reason this wave count, despite having the best fit in terms of subdivisions, only has an even probability with the main wave count. It will prove itself if we see a clear five down with increasing momentum on the daily chart.
Draw the maroon trend line on a weekly chart on a semi-log scale, and copy it over to a daily chart also on a semi-log scale (see this analysis for a weekly chart).
Within primary wave 5 intermediate wave (1) fits perfectly as an impulse. There is perfect alternation within intermediate wave (1): minor wave 2 is a deep zigzag lasting a Fibonacci five days and minor wave 4 is a shallow triangle lasting a Fibonacci eight days, 1.618 the duration of minor wave 2. Minor wave 3 is 9.65 longer than 1.618 the length of minor wave 1, and minor wave 5 is just 0.51 short of 0.618 the length of minor wave 1.
Intermediate wave (2) is now a complete expanded flat correction. Minor wave C is a complete expanding ending diagonal. Expanded flats are very common, and ending expanding diagonals are more common than leading expanding diagonals. This wave count has more common structures than the main wave count, and a better fit.
Within an ending diagonal all the sub waves must subdivide as zigzags. The fourth wave should overlap first wave price territory. The rule for the end of a fourth wave of a diagonal is it may not move beyond the end of the second wave.
Although Gold almost always adheres perfectly to trend channels, almost always is not the same as always. This wave count is still possible. The trend channel breach is a strong warning that this wave count may be wrong and we need to heed that warning with caution at this stage.
A new low below 1,131.09 would confirm that a third wave down is underway.
When the first 5-3-5 down is complete on the daily chart this wave count would see it as 1-2-3 and the main wave count would see it as A-B-C. The following upwards movement will tell us which wave count is correct. If it moves back into price territory of the first 5 down then it can’t be a fourth wave correction so the main wave count would be correct. If it remains below the price territory of the first five down then it would be a fourth wave correction and this alternate would be correct. This divergence will not begin for a few weeks yet, most likely.
At 956.97 primary wave 5 would reach equality in length with primary wave 1.
Intermediate wave (2) may not move beyond the start of intermediate wave (1) above 1,345.22. If this invalidation point is passed this wave count would be fully invalidated.
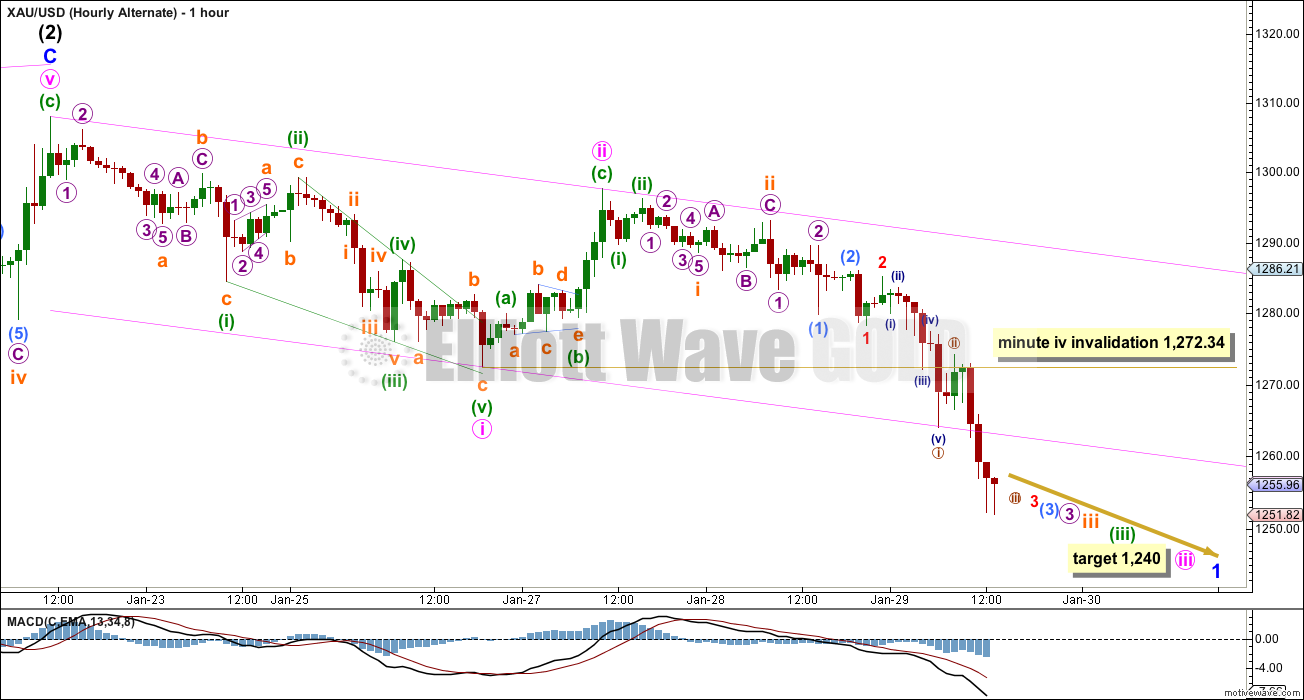
The subdivisions on the hourly chart are identical for both wave counts today.
This wave count requires a five down to complete for minor wave 1. Intermediate wave (3) may only subdivide as a five wave impulse and minor wave 1 is very likely to be a simple impulse.
This analysis is published about 02:37 p.m. EST.
Lara’s Friday analysis is out now.
papudi when the right should on your GDXJ chart get hit at $28 area does gold go down? Left shoulder is at 28.11 and right shoulder high today was 27.81.
Or is this just a Mega Safe Haven day so don’t dare invest in 3X bear ETFs?
Yes it is SH day. Wait for the turn from the RS before entering. RS could go to 2811.
Better wait for turn for small bite and more once BO below the NL. That’s the plan.
I am flat.
it looks like it completed a 38.2 retrace of the close at 1158…. the trend is your friend ….im going with the flow right now and thats up
The COT became SIGNIFICANTLY more bearish last week (reported as of Tuesday close)…wow.
Perhaps just end of month covering, drop on Monday…Lara said red candle on Monday
Lara, what about previous main bullish count from 1/28?
miners have started acting like this is a support level now..
wave iv could have ended at $1253, but not sure it would have right look.
Chapstick_jr
Lara wrote below: The hourly chart was wrong. This can’t be a fourth wave correction, but the third wave didn’t complete.
I will wait for today’ss report. Flat land now.
wave iv on the way up to complete wave v near $1330
Gold Logs Biggest Month Gain In Years, India, Russia Demand Up; Oil Pops January 30, 2015, 2:51 P.M. ET
http://bit.ly/1vguTTP
Russia spending more than $6 billion to buy about a third of the world’s total 461 tons. …
Oil spiked up…
Gold is still making new highs as now 1279.10 at 1:30 pm.
Looks like gold isn’t finished for today yet.
Safest bet is wait for Lara, however she is traveling today and no video.
Lara said at the beginning of last night’s video
The end of week report I will prepare for you toward’s New York’s close for Friday. I will make sure that the text I prepare for will be thorough.
I’m thinking now would be a good time to add to JDST again.
Next week should be interesting. Gold Is this just a bounce wave iv??
But GDXJ is putting a right shoulder on toppy HnS. Just like in EW waves with in waves Patterns also have HnS with in HnS.
$1275-$1280 is big resistance and we are there now
IMO gold looks like it is in the 4th wave of a leading expanding diagonal within minor 1 of intermediate 3. That would likely take gold back into the 1280s again. Any noticeable flaws in my thinking? Is this going against any Elliott rules?
Are we still heading for 1240 soon or is that invalidated also and just the daily count remains and who know what next target is? Is everyone selling their DUST/JDST? I sold some and thinking of selling the rest now as this gold rally may continue.
I am expecting Gold and Miners to head south to 1240 or lower. I am 2/3 in my JDST position.
It doesn’t appear that wave iii is complete yet. It was possible that it was complete yesterday at 1252ish, but since we moved up into wave i territory, then that tells me that wave iii still has more downside before the wave iv shallow correction.
Quite possible is done at GLD = 120.38 and the we are ii retrace 62% 123 then iii down
So the invalidation point of 1272.34 already applies and not later on ????
Yes, $1308-$1253 has to be labeled w since there’s only 3 down from $1308.
Yes. The hourly chart was wrong. This can’t be a fourth wave correction, but the third wave didn’t complete.
The daily charts are the same, so the invalidation point now moves up to 1,308.10. This movement looks like a big second wave correction.
As soon as counts get confirmed, they get invalidated just as fast
Gold is in a rally since 10:00 am and I am looking to buy DUST and JDST how high can it go today? Gold now at 1269.50 and see minute iv invalidation at 1272.34 is that that peak for right now or later?
Lara mentioned in video that we should see shallow corrections and the pink trend line about 1260 may be resistance. Gold is now at 1270.40 and we are now even close to minute iii yet???
If you trust the wave count, now is the time to get into DUST/JDST
Minute iv nearly into minute I territory
Sold my JNUG at $32.90, and added 2 positions to JDST at $8.70,
On daily chart Lara has FIB marked.
R these from low of 1130 to high 1307? Must be?
So 38% a normal pull back comes in around 1237. Lara’s 1240 for wave iii.
Also Primary wave indicating that gold has bottomed and once moves above 1345 it will be technically in bull market.
Lara’s target 1240ish is a back test of breakout from gold’s inverse HnS neckline around 1240 to 1238??
Is there a news about reverse split of JNUG/JDST/DUST/NUGT????
Any One???
One of them did one about a month ago.
You end up with the same value of your investment even though the share price and number of shares change.
There may be something with an exchange where they don’t trade penny stocks so if one drops that low the company just does a reverse split to solve that issue.
JNUG got down to $1.60 or so, and did a 1 for 10 reverse split on Dec. 23rd.
They post split announcements here for those 3x etf’s. Nothing currently pending.
http://www.direxioninvestments.com/about/news
Why are you asking? What do you want to know?
Minute iii could have ended at $1252ish and now in minute iv. The longer we stay above $1252, the greater the probability. It’s possible $1240 will be where Minor A finishes although I could see it ending lower than that.
This is how I’m playing it. Sold 2 positions of JDST today, and bought JNUG for a bounce. I won’t be holding the JNUG at the end of the day tomorrow, looking to reposition my JDST tomorrow.
In case you didn’t see, margin requirements on silver were raised. That’s likely going to put more pressure on silver in the coming months.
Per chartists a break out from a RL is most likely tested called back test.
A BO from a HnS BT is around 1238 1240.
The chart is shown above.
correct, but the neckline looks like it will be near $1220 in the next 1-3 days when Minor A ends. A perfect spot for a Minor B bounce. A might also add this is near wave v = wave i.
The main question people want to know is why are you posting a chart from Jan 12th? A current chart is always useful.
I am sorry . I made mistake posting a wrong chart. AND could not delete the chart.
There are two charts. the current chart is below this one.
Click on :See More: a note below the post.
on your own comment: go to “Edit”, then click at top right-hand corner of the comment accross from the header line. Have to hover over the corner for the ” – v ” type symbols to show. the inverted triangle is the delete symbol. Will let you delete your own comment. Not sure what happens to any reply though.
Then can re-post correctly.
Hope that helps.
Lara, silver does often move more aggressively than gold but this move by silver seemed exceptionally strong as compared to gold and gdx.
In your experience does this extra strong move by silver tell / indicate anything about this market?
Silver just shows that today was an overnight big movement and day and silver exagerates what gold does.
Today was a change in direction as well.
Both alts have the same short term target. Both hour charts show waves to be all 3’s impulse down. Thats why Lara is targeting 1240 by Monday.
This trade should be short term.
Friday the NYSE is open and gold trades. It is just that Lara expects target of 1240 to be hit Monday. That is my understanding. “The short term target for this third wave is 1,240. I expect a red candlestick for Monday’s session to this target.”
Is this Friday not a trading day for Gold?