
Downwards movement did not continue as expected. A new high above 1,272.34 invalidated the Elliott wave count at the hourly chart level.
Summary: In the short term I expect upwards movement to end about 1,281 – 1,287. This upwards movement is a deep second wave correction, and it should be followed by a strong third wave down which may be confirmed with a new low below 1,266.26. The invalidation point is at 1,308.10. The trend at intermediate degree remains down.
*Note: I can publish text and charts only today, and for the next session on Monday. I am travelling and my current internet connection is not strong enough to upload video. I have said everything I intend to say in the text below.
Click on charts to enlarge.
Main Daily Wave Count
At this stage I judge this main wave count to have an even probability with the alternate below. I will let the structure of downwards movement, and momentum, tell us which wave count is correct over the next few weeks. At this stage they both expect more downwards movement so there is no divergence in the expected direction.
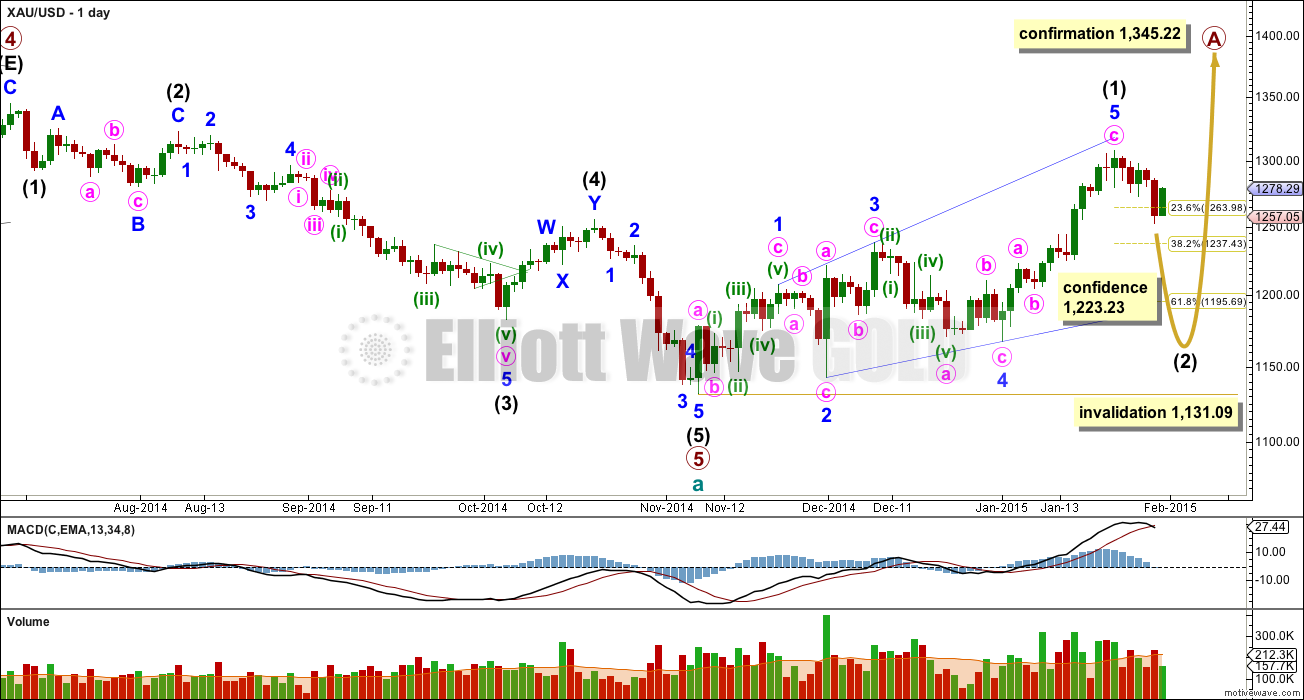
This wave count sees a five wave impulse down for cycle wave a complete, and primary wave 5 within it a completed five wave impulse. The new upwards trend at cycle degree should last one to several years and must begin on the daily chart with a clear five up.
The first five up may be a complete leading expanding diagonal. After paying closer attention over the last several days to the frequency of leading diagonals I am revising my prior stance that they aren’t common. I’m seeing quite a few, and a few of them are expanding. The structure of intermediate wave (1) as a leading expanding diagonal does not pose a problem to this wave count.
Within leading diagonals the second and fourth waves must subdivide as zigzags. The first, third and fifth waves are most commonly zigzags but they may also be impulses. This wave count sees minor waves 1, 3 and 5 as zigzags.
Leading diagonals are almost always followed by very deep second wave corrections, often deeper than the 0.618 Fibonacci ratio. This wave count expects a big deep correction downwards, and should subdivide as a clear three on the daily chart (the alternate below expects a clear five down).
My biggest problem with this wave count, and the reason I will retain the alternate, is the structure of intermediate wave (2) within primary wave 5. This is a rare running flat but the subdivisions don’t fit well. Minor wave C should be a five wave structure, but it looks like a clear three on the daily chart. If you’re going to label a running flat then it’s vital the subdivisions fit perfectly and this one does not. This problem is very significant and this is why I judge the two wave counts to be about even in probability.
Intermediate wave (5) looks like a zigzag rather than an impulse, and has a corrective wave count. This is also a problem I have with this wave count.
Intermediate wave (2) is most likely to subdivide as a zigzag, which subdivides 5-3-5. When this 5-3-5 is complete then how high the following movement goes will tell us which wave count is correct.
Intermediate wave (2) of this new cycle degree trend may not move beyond the start of intermediate wave (1) below 1,131.09.
Volume for Friday’s session is low, supporting the idea that Friday’s upwards movement is a correction and not the start of a new upwards trend.
This upwards movement is too deep to be a fourth wave correction. It is showing up clearly on the daily chart. This looks like a deep second wave correction.
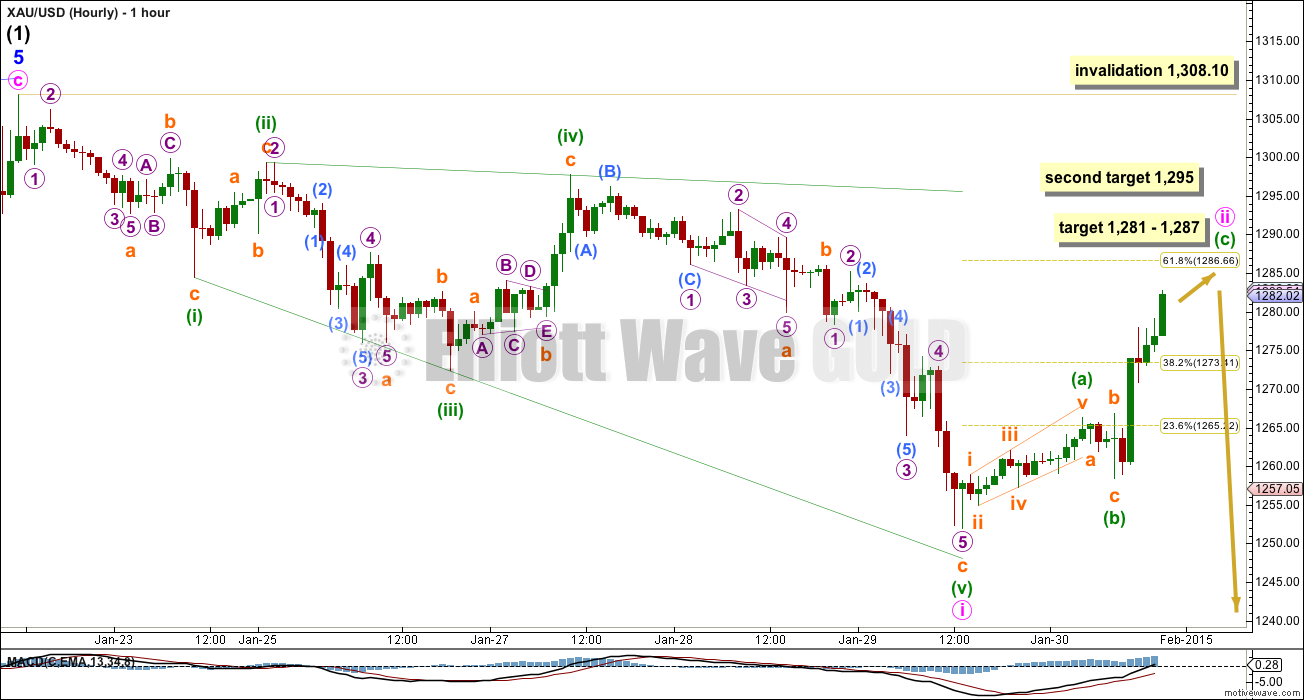
I have tried to see if minute wave i could be an impulse, but it does not fit. It does fit perfectly as a leading expanding diagonal. This is being followed by a typically deep second wave correction.
At 1,281 minuette wave (c) would reach 1.618 the length of minuette wave (a). This is somewhat close to the 0.618 Fibonacci ratio of minute wave i at 1,287. This gives a rather wide target zone of $6. I favour the upper edge of this zone because I would expect minute wave ii to be a deep correction.
If upwards movement keeps going above the 0.618 Fibonacci ratio then the next likely place for it to end may be at 1,295 where minuette wave (c) would reach 2.618 the length of minuette wave (a). I will consider this target because second wave corrections following a leading diagonal in a first wave position are often very deep.
Minute wave ii may not move beyond the start of minute wave i above 1,308.10. If this invalidation point were to be breached the wave count would change significantly at the daily chart level. I would revive the idea that recent downward movement was a fourth wave correction, and a fifth wave up would be unfolding. However, this does not have the “right look” on the daily chart anymore and so I don’t want to publish it again.
Alternate Daily Wave Count

The maroon channel about cycle wave a from the weekly chart is now breached by four daily candlesticks, and is now also breached on the weekly chart by one weekly candlestick. If cycle wave a is incomplete this channel should not be breached. For this reason this wave count, despite having the best fit in terms of subdivisions, only has an even probability with the main wave count. It will prove itself if we see a clear five down with increasing momentum on the daily chart.
Draw the maroon trend line on a weekly chart on a semi-log scale, and copy it over to a daily chart also on a semi-log scale (see this analysis for a weekly chart).
Within primary wave 5 intermediate wave (1) fits perfectly as an impulse. There is perfect alternation within intermediate wave (1): minor wave 2 is a deep zigzag lasting a Fibonacci five days and minor wave 4 is a shallow triangle lasting a Fibonacci eight days, 1.618 the duration of minor wave 2. Minor wave 3 is 9.65 longer than 1.618 the length of minor wave 1, and minor wave 5 is just 0.51 short of 0.618 the length of minor wave 1.
Intermediate wave (2) is now a complete expanded flat correction. Minor wave C is a complete expanding ending diagonal. Expanded flats are very common structures.
This wave count has more common structures than the main wave count, and it has a better fit.
Within an ending diagonal all the sub waves must subdivide as zigzags. The fourth wave should overlap first wave price territory. The rule for the end of a fourth wave of a diagonal is it may not move beyond the end of the second wave.
Although Gold almost always adheres perfectly to trend channels, almost always is not the same as always. This wave count is still possible. The trend channel breach is a strong warning that this wave count may be wrong and we need to heed that warning with caution at this stage.
A new low below 1,131.09 would confirm that a third wave down is underway.
When the first 5-3-5 down is complete on the daily chart this wave count would see it as 1-2-3 and the main wave count would see it as A-B-C. The following upwards movement will tell us which wave count is correct. If it moves back into price territory of the first 5 down then it can’t be a fourth wave correction so the main wave count would be correct. If it remains below the price territory of the first five down then it would be a fourth wave correction and this alternate would be correct. This divergence will not begin for at least a couple of weeks.
At 956.97 primary wave 5 would reach equality in length with primary wave 1.
Intermediate wave (2) may not move beyond the start of intermediate wave (1) above 1,345.22. If this invalidation point is passed this wave count would be fully invalidated.
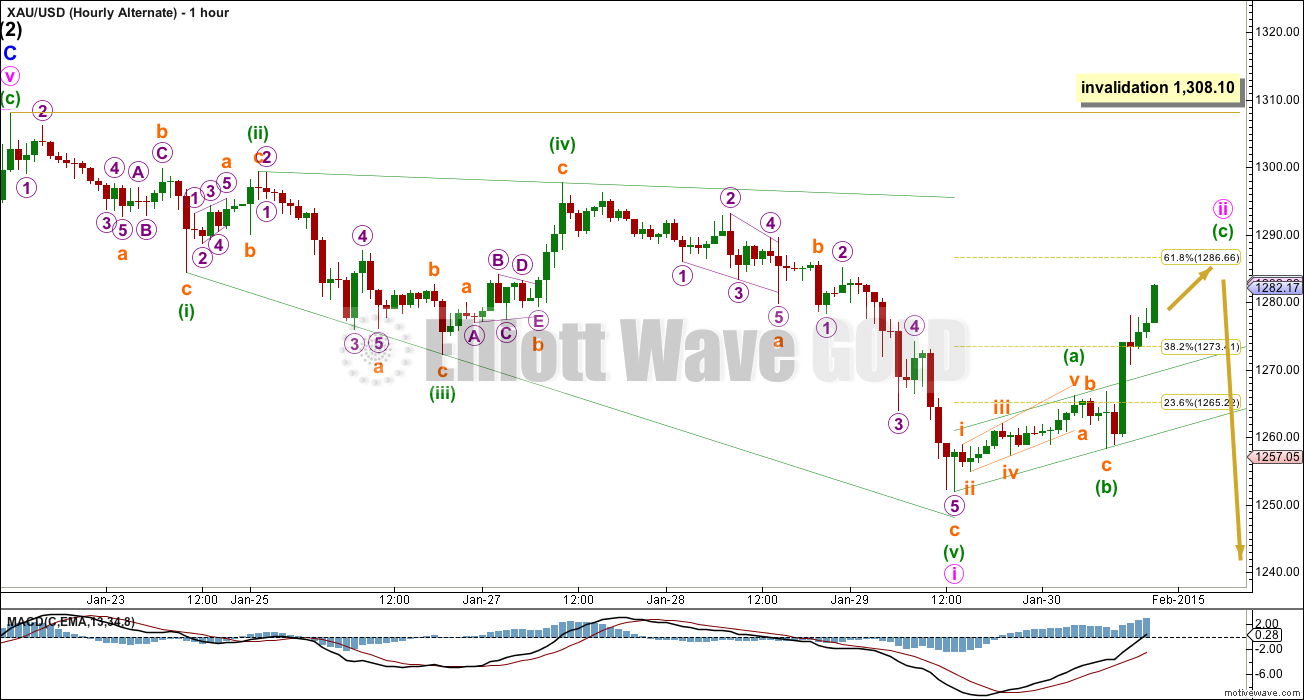
I expected to publish an alternate idea at the hourly chart level, but the downwards wave labelled minuette wave (v) does not subdivide at all as an impulse, and fits only as a zigzag. This means that at this stage a complete leading diagonal for a first wave is the only wave count I can see fitting at the hourly chart level.
The subdivisions, invalidation point and targets are the same for both hourly wave counts again today.
I will be expecting a third wave down to begin once this second wave correction is complete. The confirmation point for a third wave may be at 1,266.26, the high of minuette wave (a). Once the upwards zigzag of minute wave ii is completed, then a new low back into minuette wave (a) price territory would eliminate the possibility that a new upward impulse is unfolding, because downwards movement would then be back in first wave price territory. A new low below 1,266.26 confirms that the upwards movement labelled minute wave ii is a three wave structure which would have to be complete.
If my analysis of minute wave i as a diagonal is correct, then downwards movement is a five and upwards movement is a three. This supports the idea that the trend is now down.
This analysis is published about 03:30 p.m. EST.
JNUG HnS
If Gold goes to 1229 this HnS should work out.
looks like we’re backtesting the trend lines now
I sold my JDST and DUST as Lara just commented below that correction up is not over yet.
“My target is 1,299. …Look at that channel on my hourly alternate, it bounced right on that lower trend line.”
Richard time to buy nugt/jnug???
Is something wrong with the forecast?
ISM U.S. Manufacturing Index Drops To 53.5 In January
and US stocks are down and oil it up.
Gold has been going up since the open.
Gold just broke above trend channel today for 15, 10, 5, 3, 2, and 1 minutes.
Did gold just top at 1278.88 as 12:06 pm?
I certainly hope so.
Waiting for gold to drop below 1,266.26 to confirm Lara’s third wave down.
It almost did this morning when it bounced at 1,266.54 at 9:17 am.
Hopefully that isn’t a problem and gold will drop below it today.
JDST has dropped 6.03% and DUST 1.40% as of 11:53 at gold at 1273 come on Gold drop down to 1,240 today so I can sell before a bounce.
I should of sold at the open and bought it back when gold hit 1276.
Sorry Richard, I do think its a problem. I’m looking at that downwards move and it won’t subdivide as a five, it’s a three. I don’t think this second wave correction is over, it looks like it’s going to continue for another day. My target is 1,299. I think it’s going to be VERY deep and scary, making us think price will keep going up and up… right before the third wave down begins. That’s what second waves do…. if my wave count is right!
Look at that channel on my hourly alternate, it bounced right on that lower trend line.
Looking at volume for Gold and Silver, it’s now highest on down days. Particularly 28th Jan for Silver. This supports the idea that we’ve had a trend change and the trend is now down.
Kitco says low was 1265.50
Lara is awesome. Gold is doing what is called for.
May Be May Be today or tomorrow gold will take out the 1266. Then the 3rd wave alt i wave will get confirmed. AND then will have clear picture.
Lara reported above: “I will be expecting a third wave down to begin once this second wave
correction is complete. The confirmation point for a third wave may be
at 1,266.26, the high of minuette wave (a).”
Thanks, but I don’t think the correction is over yet. New target 1,299.
CORRECTION: The COT chart I posted 2 days ago was incorrect for the Feb numbers. I added another chart that goes all the way back to 2010 because I wanted to get a few years of the bull market in there, and I added the POG (based on every tuesday close). After the correction, the 10 week divergence is the highest it has ever been since Jan 2010 by far. Should be a fun couple of weeks!
MTLSD
Good chart thanks for including gold price behind the data.
Hope gold will give Lara a clear picture soon by taking out the 1223.level.
Forgive me for getting off topic but why is no one mentioning the inverse head & shoulders with a target of 1349 for gold?
On another forum I came across this comment by the writer explaining EW rules and making projection for gold.
“Most often when you see EW guys getting beaten for incorrect calls, its
mostly because they didn’t stick to the rules. I have seen some shocking
counts and practices online, but to preserve dignity I won’t name names
Lara.
What to make of his comment and picking on Lara?
Yet another article regarding COT data suggesting Lara’s count is exactly on the right track. EW is not meant to be a trading tool and never has. It should only supplement all other tools as Lara has suggested over and over again.
I think it’s only fair you disclose who made the comment so we can review their track record. Nobody is ever perfect and I think Lara sticks to the rules pretty well.
http://safehaven.com/article/36553/gold-and-silver-probability-for-a-lower-low-has-increased
I agree with you .EW provides road map and then use yr TA to trade.
On forum names are not real.
Why is he paying for Lara’s service???…hmmmm
We cannot evaluate this comment without at least the specific chart in question and preferably the rule suspected to have been broken. With that data, we could have a very educational discussion.
agreed and there was no reason for papudi to post this without supporting chart/documentation
what is the forum? can you elaborate so we can attest to its authenticity? the comment they made seems very unprofessional. truth is in the count, and we all are all “trying” to read “IT.” If someone really thinks he knows IT unequivocally so as to be so ignorant his ego must be his own downfall.
I only trade gold ETF’s because I have Lara’s analysis.
Without Lara’s anaylsis I wouldn’t trade gold investments.
With Lara I count my blessings daily to be lucky enough to have found in my opinion the best Elliiott Wave analyst and the most honest analysis and the most detailed forecasts all based on her looking after helping me as much as she can. I have come across many EW forecasters and every time it reassures me to stay with Lara.
I think that’s very unprofessional. Apart from that, I’m not concerned. The internetz is a bit of a wild west, and people say all kinds of horrible things. If I let it get to me I’d be a mess, so I have to learn to brush it off.
I’d only take it seriously if I knew what rule I was supposed to have broken.
I have in the past suspected that within diagonals sometimes third waves may be the longest, which would mean I may have broken rules regarding the wave lengths within diagonals. It may be that one. I’m more careful now about that.
Sorry Lara I should not have posted this. But I was disturbed the comment.
You are the best I know of.
Good day.
Gold to oil ratio is at high at 28. How do u short gold and long oil without futures contract?
That should be a safe hedge trade. Norm is 16.
Gold complex facing strong resistance. Chart by Alphahunt on Stocktwits.
Here is one of the charts I create with COT data. I calculate the divergence between the Swaps and the MM net positions each week, and sum it on a 10-week rolling basis. It helps me see the extremes where each side is quickly taking positions in volume. If you look at any of the peaks, Gold turns south and deep at each one. Notice the last time we saw a divergence this steep over 10 weeks was the Feb 28th, 2012 COT report.
Edit: And the last 2 times that the MM Net Long position represented more than 34% of open interest were Feb 2012, and Oct 2012.
Pull up a gold chart. Either this time is different, or gold is about to get hammered.
MTLSD, could you please elaborate on your statement. “Pull up a gold chart. Either this time is different, or gold is about to get hammered.”
Note the dates at the bottom that align with all the peaks, then look at a chart of gold for the same dates. Gold has sold off in all cases.
Nice chart. Thanks for sharing.
Nice sharing. What is MM net? Where do u get swap data?
Feb 12 top was primary wave (2) C and Oct 12 top was primary wave (2) E completed.
May be this time with these extreme COT int wave (2) C is about to end. Confirmation may come with deep correction beyond 1223.
Those are the dates bear trend in gold began and no one was calling bear trend at the time.
MM = Managed Money (Large Specs)
Go to http://www.cftc.com, click on Market Reports, then Commitment of Traders (COT). There is a like to Historical Compressed files, where you can download excel versions for the past few years.
MTLSD, thanks for this!
papudi, from what I gather MM is managed money.
http://www.cftc.gov/dea/options/other_lof.htm
MTLSD, would it be fair to say that MM should be taken as a contrarian indicator, and siding with Swaps dealers is the way to go? On this report from Jan 27th I see that MM long position open interest is 28.9%. Just wanted to check, as you mentioned it to be more than 34%?
Gold looks like it peaked at ii red circle 1,284.83 double top Friday night and next gold heads down to lower target on hourly chart pointing at 1,240 area (not noted as exact number), which is same as previous target 1,240.
I bought DUST $12,22 and JDST $8.21 at the Friday close. Daily chart hasn’t changed.
“Summary: In the short term I expect upwards movement to end about 1,281 – 1,287. This upwards movement is a deep second wave correction, and it should be followed by a strong third wave down which may be confirmed with a new low below 1,266.26.”
I’m playing it the same way Richard. Sold my JDST earlier in the week at 9.06 and 9.70, bought back today maybe too early at 8.70, I thought we would turn after the gap filled. But overall, a great month.
My other position is TVIX right now, playing an SP drop next week. In at just over $3.
COT looks horrible with GOFO positive…could be a rough couple weeks.
“Great month” wish I can say that. I am still adjusting to trade with daily EW count and getting on the wrong side every day.
I have been caught on the wrong side many days so I am using small positions and cutting my losses fast if on the wrong side then being careful to buy at what I think may be the best time. Do smaller trades until you are better at it before big trades and also if you use a 3X ETF cut your losses rather than let them accumulate for days waiting to be the right way.
Since November low, gold trading has been difficult. The best time will be when gold has bottomed thern starts up. Those months are lots easier to trade. Since November it seems we are trading a lot of correction waves that are difficult for almost everyone. Use the best indicators also to help you in and out of trades in addition to Lara analysis.
Lara video suggest narrow corrections and maybe upper resistance at pink trend line at about 1260 so I was caught off guard when gold decided to go up all day. I bought early then sold it all and then bought baok the minute of the day. Glad your month was great.
the very last GOFO report Jan 30th, and now discontinued.
one less indicator to use.. any thought why they ditched it?
Lara wrote: ” then the next likely place for it to end may be at 1,295 where minuette
wave (c) would reach 2.618 the length of minuette wave (a)”
Thats why I did not stay with DUST/JDST. Monday will be the day to capture the next deep correction.
Wave iii target should be 1240 that is deep correction.
Am I reading it correct?
You may be right all around. However because Lara gave two targets and 1295 is the 2nd target which may or may not get hit or it could get hit before the Monday open. We don’t know yet when is the best time to capture the next deep correction. It may have been at 4 pm Friday or this Sunday or even before open Monday only time will tell. I just went with the 1st target and a small investment because the weekend and a 2nd target.
COT data supports the count and I told you wave iv down doesn’t have the right look on daily which means $1308 should hold. $1296 or 78.6% retrace should contain correction. Not sure there’s anything more to say…
Richard or Chapstick_jr
What is yr take on today’s report??
This deep correction was wave ii. Next expect deep correction down???
COT rise higher than last weeks highest level.
Commercial shorts 425773 vs 422000.
Net shorts Commercial 228110. Must be highest.
Is top near here some where????
http://www.321gold.com/cot_gold.html
Lara thanks for providing this analysis with the extra details and before the weekend and month close. Have a great vacation. Maybe the next photo on your website will be a photo or a ‘selfie’ from your trip.
LOL. I don’t do selfies… but I am getting a GoPro camera to put on the nose of my surfboard soon… maybe I’ll share some waves with you all.
This time I’m up in the Far North of NZ. Very pretty white sand silica beaches… and surf!