
A green candlestick was expected for Tuesday’s session, but the quick sharp second wave correction did not happen.
Summary: The trend remains up. It should reach at least to 1,262.94 and it may get there next week. I don’t expect to see a correction on the daily chart now until minuette wave (b) arrives, which may be in another couple of days time.
Click on charts to enlarge
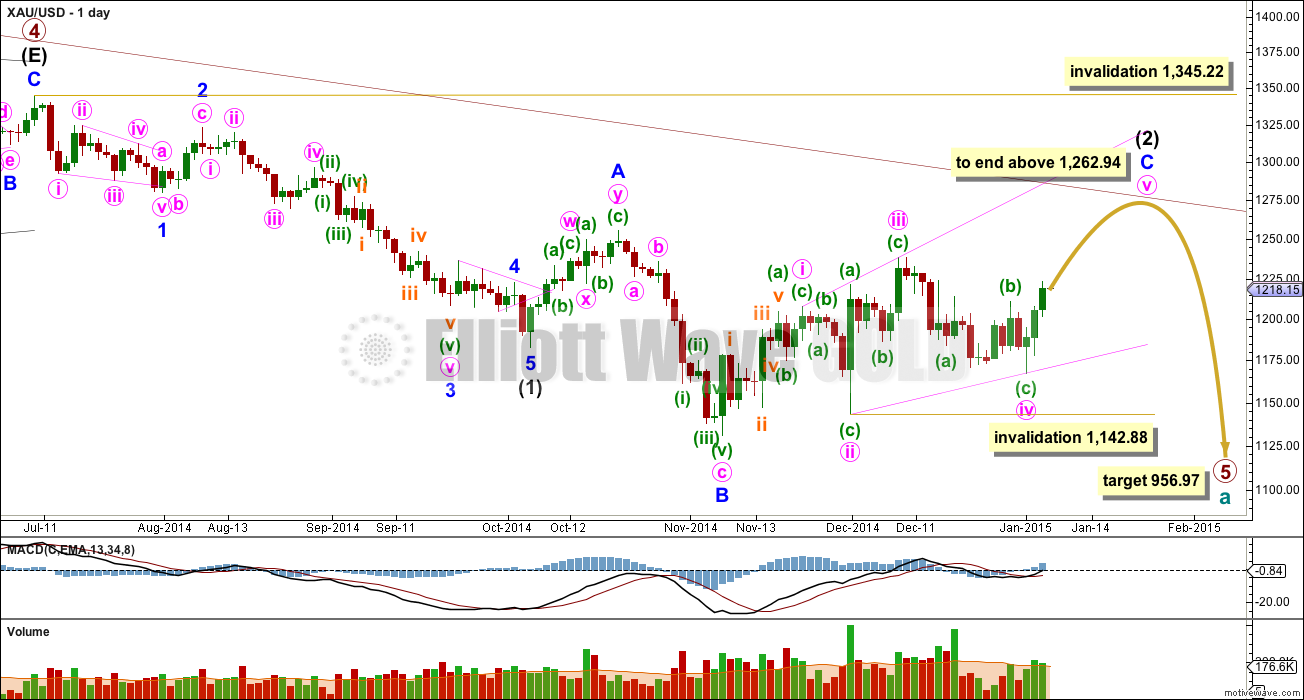
Primary wave 4 is complete and primary wave 5 is unfolding. Primary wave 5 may only subdivide as an impulse or an ending diagonal. So far it looks most likely to be an impulse.
Within primary wave 5 intermediate wave (1) fits perfectly as an impulse. There is perfect alternation within intermediate wave (1): minor wave 2 is a deep zigzag lasting a Fibonacci five days and minor wave 4 is a shallow triangle lasting a Fibonacci eight days, 1.618 the duration of minor wave 2. Minor wave 3 is 9.65 longer than 1.618 the length of minor wave 1, and minor wave 5 is just 0.51 short of 0.618 the length of minor wave 1. I am confident this movement is one complete impulse.
Intermediate wave (2) is an incomplete expanded flat correction. Within it minor wave A is a double zigzag. The downwards wave labelled minor wave B has a corrective count of seven and subdivides perfectly as a zigzag. Minor wave B is a 172% correction of minor wave A. This is longer than the maximum common length for a B wave within a flat correction at 138%, but within the allowable range of twice the length of minor wave A. Minor wave C may not exhibit a Fibonacci ratio to minor wave A. Minor wave C is extremely likely to move at least slightly above the end of minor wave A at 1,255.40 to avoid a truncation and a very rare running flat correction. It may end when price touches the upper edge of the maroon channel, copied over here from the weekly chart. To see how to draw this channel click here.
To see a prior example of an expanded flat correction for Gold on the daily chart, and an explanation of this structure, click here.
Intermediate wave (1) lasted a Fibonacci 13 weeks. If intermediate wave (2) exhibits a Fibonacci duration it may be 13 weeks to be even with intermediate wave (1). Intermediate wave (2) is beginning its 13th week. It is barely possible it could end at the end of this week, it looks like it may need longer than this. It may end next week.
So far within minor wave C the highest volume is on four up days. This supports the idea that at this stage the trend remains up. Even for the last 11 trading days the highest volume is in four up days.
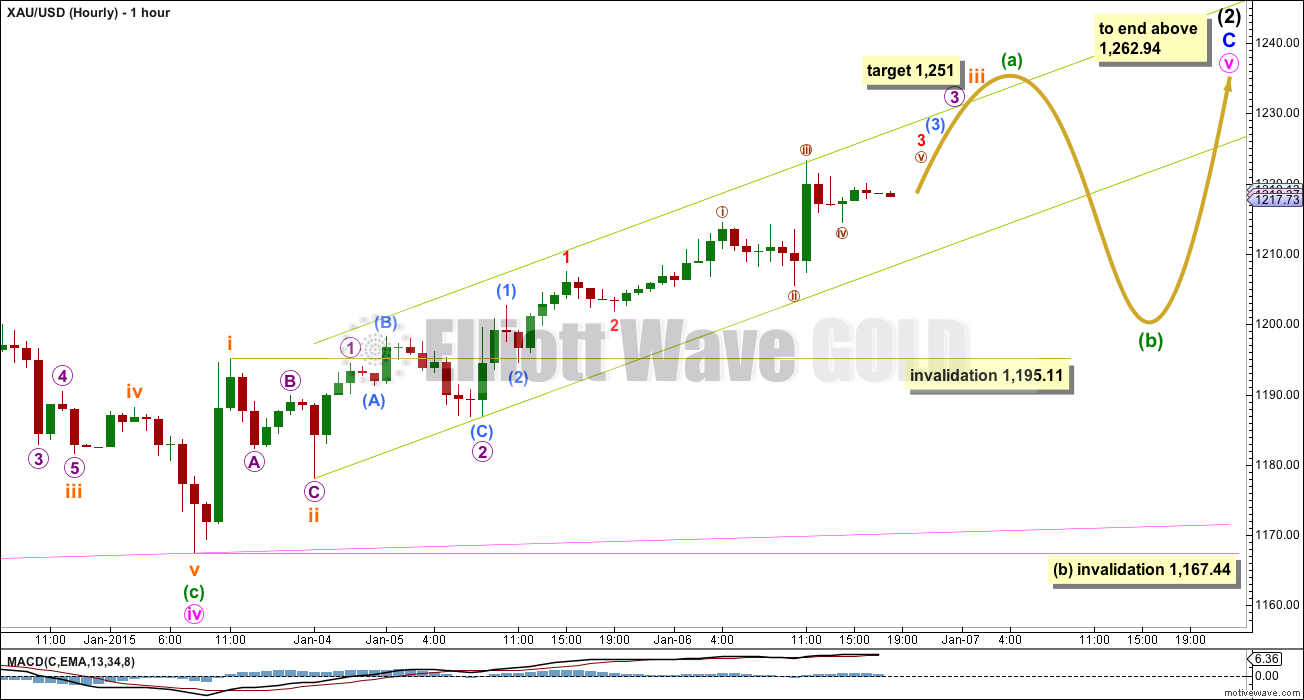
Minor wave C may be either an impulse or an ending diagonal. At this stage an impulse looks very unlikely because there is too much overlapping. An ending diagonal looks more likely, and it may be in the early stages of the final fifth wave. The diagonal is expanding and the trend lines clearly diverge. Expect the final fifth wave of expanding diagonals to fall short of the i-iii trend line. Minute wave v should be longer than equality with minute wave iii which would be achieved at 1,262.94. This would also see minor wave C end above the end of minor wave A at 1,255.40 avoiding a truncation and a very rare running flat.
Within an ending diagonal all the sub waves must subdivide as zigzags. The fourth wave should overlap first wave price territory. The rule for the end of a fourth wave of a diagonal is it may not move beyond the end of the second wave at 1,142.88.
Intermediate wave (2) may not move beyond the start of intermediate wave (1) above 1,345.22. I have confidence this price point will not be passed because the structure of primary wave 5 is incomplete because downwards movement from the end of the triangle of primary wave 4 does not fit well as either a complete impulse nor an ending diagonal. If it is seen as a complete impulse there would be inadequate alternation between the single zigzag of the second wave and the double zigzag of the fourth wave correction, and there would be no Fibonacci ratios between the first, third and fifth waves within it.
I have considered the possibility that minor wave C ended at the high labelled minute wave iii at 1,238.38. If it did, it would have to be an ending diagonal which does not fit because the third and fifth waves within it do not subdivide as zigzags and instead subdivide as impulses. For this reason I do not think minor wave C is over yet and should continue higher.
Yesterday’s wave count was wrong because subminuette waves i and ii were more likely already over.
Subminuette wave iii would reach 2.618 the length of subminuette wave i at 1,251. When subminuette wave iii is over subminuette wave iv to follow may not move into subminuette wave i price territory below 1,195.11. However, because subminuette wave ii did not show up on the daily chart as a red candlestick or doji, I would not expect subminuette wave iv to show up either. I expect most likely more green candlesticks for another one or two days to the end of minuette wave (a).
When I know where subminuette waves iii and iv within minuette wave (a) have ended then I will use subminuette wave degree to calculate a target for minuette wave (a) to end. I cannot do that yet. I may be able to do that tomorrow.
Draw a best fit parallel channel about this upwards movement. Expect corrections to continue to find support along the lower trend line. A strong fifth wave up may be able to break above the trend line.
When minuette wave (a) is over then I would expect a time consuming correction for minuette wave (b) to show up on the daily chart and last at least two or three days. It may be very choppy and overlapping. It may not move beyond the start of minuette wave (a) below 1,167.44, but it should find very strong support at the pink ii-iv trend line, if it even gets down that low. It could be a sideways consolidation phase.
This analysis is published about 6:22 p.m. EST.
Astrologically, I’m thinking we have been hinging on the cusps of some major cycles recently. I have mid-April 2015 as a guide post and that is with the H.New year chart of USA that I am using which shows more/sideways to bearish weakness in price of oil and at least 1 year imminent bear market overall , with oil (pearls, milk = consumer staples?, and silver staying low). I did some calculations and have $42 as the low for Oil at this time we are in. There is a major cycle change in Gold which really starts being evident staring mid-July 2015. The real 2nd recent Bull Market in gold will coming in mid- jan2016 as per Vedic astrology when Jupiter and Rahu conjunct. From somewhere in July 2015 you can start to see the bull move. Pranam and Namaste.
Pjay
“There is a major cycle change in Gold which really starts being evident staring mid-July 2015”
Until this major cycle change is gold moving down? If yes, how low does gold go?
Davey, Richard – I’m following Laura’s analysis and feel that the low may be in when we hit wave 5 as she has it on the daily. How long it lasts – I think the low/consolidation grind could end in late July 2015 when Jupiter enters Leo (as per sidereal astrology).
I was excited for a little while. Gold was up from the FOMC meeting and an hour later GDX was up at about 3 pm. However even with that boost gold was still $3 below yesterday close and gold and GDX deflated down to the close with a red candlestick and breaking and closing below the support of the lower trend line of hourly chart. Hopefully the Gold Bull Rally party continues up to 1,262.94 or beyond next week. Then I can hit the DUSTy trails south until the beginning of Spring Rally.
Lara stated there will be green candle for next two days. It may have been delayed by a day.
Gold is trading at 1210 now at 4:37P EST.
Unless wave count changed gold could launch into a move up in next 24 hours according to Lara.
Gold is hitting all day against the resistance the down trending line on daily chart. It breached briefly yesterday to high of 1223.
Once it clears 1250 is the target . HOPE!!!!
Gold up after FOMC news released 2:00 pm EST
I have a strange feeling this whole move is an ABC up for wave 1. of an ending diagonal. Just a suspicion at this point.
Wave “4” (if that’s what we’re calling it) has moved out of the trend line and is showing lack of strength and gdx failed to make an impluse; rather an ABC structure also. Anyone else suspicious?
FOMC minutes 2:00 pm Today and latest data on US employment, due later in the day.
FOMC minutes 2:00 pm Today and latest data on US employment, due later in the day.
Minutes Federal Reserve Open Market Committee FOMC 2014 preview | ForexLive
Chapstics or any one What happens if price point moves below 1210.78 Wave i? Would that mean gold is in wave iv and it is already below previous wave i high of 1214.42? Count gets changed?
Papudi, I think that the last hourly Lara’s wave count is invalided. I do not know what count she has now.
I think that wave a of C is finished to 1222,96 and now we are in wave b. I have a target for this b wave to area 1201-1202 ( 38,2% of wave a ) but it is possible 61,8% or more…….invalidation point is to 1167,00.
VERY IMPORTANT: this is just my opinion
and I’M LEARNING
im not sure you can count a complete 5 waves up which means we are in subminuette iv. However, need to see subminuette v start very soon so it’s not disproportionate with ii. I’m not concerned it’s below trendline
If we are in subminuette iv, can I ask you how you count subminuette iii ?
I reanalyzed it and im wrong.
What you think about this?…….would be possible….
if sub micro iii) end to 1200,43 or 1198,63 then submicro iv) and submicro i), do not have overlap
That’s been my thought the whole time but I haven’t checked subdivisions on 5 min chart. There are some waves which definitely need to be checked
Fed minutes today. Just a little more volatility, please
Hi Lara & Members,
what you think about this labeling?
Thanks to all !
Maybe this is better……wave 5 is 0,618% of wave 1
Your fourth wave is a running flat… try something without running flats.
Just for fun – not trading advice. Possible scenario for GDXJ. It’s going to get choppy, but still going up. I think GDX and GDXJ are impulse moves up, as opposed to gold’s ending diagonal, and I think the up move for GDX and GDXJ may end when gold ends minuette a up. Then GDX and GDXJ may complete a wave 1 down while gold completes its minuette wave b down. As gold goes back up to new highs to complete minuette wave c and Intermediate wave 2, GDX and GDXJ will go up to complete a wave 2 with lower highs. Then we are off to the races to the downside.
Bob B
Very interesting. Would you clarify a few issues please?
(1) Are you seeing the high for GDX/GDXJ at gold (a) or (c) ?
(2) What is your target high price for GDX/GDXJ (during this move when gold (2) is complete) ?
I’m suggesting that the high for GDX and GDXJ may be when gold hits the minuette (a), green, in Lara’s chart. Then after gold moves down for minuette (b), green, and moves back up to complete minuette (c), green, minute 5, minor c, and Intermediate (2), GDX and GDXJ will also move down, then move back up, but only to a lower high. This will create a divergence with gold, which often occurs at trend changes.
Bob, yes, certainly possible GDXJ could top out when gold hits (a)
Trying to understand your chart, what are you seeing as possible top price for GDXJ ?
31 to 34. If GDXJ gets to 31 and gold has more room on the upside before completing (a), then 34 is possible.
Very interesting, thanks.
Hi Lara, could you please explain how all the minute waves in minor wave 2 are dividing into 3 waves? Is this one of the features of an ending diagonal?
Minor (blue) 2 is on the daily chart, top left hand corner, and its a zigzag subdividing 5-3-5.
So… I’m guessing you are meaning intermediate (2) (black)?
This is minor wave C within intermediate (2). See Frost and Prechter, “Elliott Wave Principle” 10th edition, pages 87 – 88: “waves 1, 2, 3, 4 and 5 of an ending diagonal… always subdivide into zigzags”.
Lara – Thanks. You did warn that the correction will not appear on daily chart as red candle or a doji. Thats what happen.
As I understand gold in pure impulse wave v, 3 (3) and iii. All impulse waves combined. You expect the target of 1251 to reach in one to two days????
With the $8 pullback from today’s high so far, hourly wave count will get adjusted again. Can’t be in a third of a third of a third due to overlap of waves i & iv now
Lara changed the wave i at 1210. So the pull back did not overlap wave i. Am I correct?
I know. This is really frustrating. I expected another two green candlesticks. This red candlestick means I have to change the hourly wave count again. Its not a small fourth wave correction, I think this is the second wave correction I expected two days ago. Ugh.
The one thing I am pretty sure of is that the trend is up at minor and intermediate degree at this time.
Its the smaller movements on the way up that I’m struggling with in these last few days.
Lara, is there a reason why you feel that subminuette wave iii should reach 2.618% of i before correcting? Just wondering because we are right at 1.618% now. Thanks
Matt- good question. Subminuette wave i (1167 to 1195) 28 and current
subminuette wave iii is already (1178 to 1223) 45. That is 45/28= 1.607.
Lara answered this question in the second half of the video.
Sorry Matt I did not get the answer. She repeated the statement. Can u reply what is the reason?
Thanks.
It fitted with the higher target of 1,262.94 nicely. And because subminuette wave i was so short.
But I’m changing the wave count now… again! I’m struggling at the moment with these smaller subdivisions on the hourly chart. But the thing I am sure of is that the trend is up at minor and intermediate degree.