
Price moved lower as expected. A small candlestick, which may end as a doji for Thursday’s session, fits the Elliott wave count nicely.
Summary: Gold is within a consolidation phase which should continue for at least another two days, and maybe another six days or slightly longer. The breakout when it comes should be upwards. If it gets that low look for minuette wave (b) to find very strong support at the lower pink ii-iv trend line on the daily chart. The invalidation point is at 1,167.44.
Click on charts to enlarge
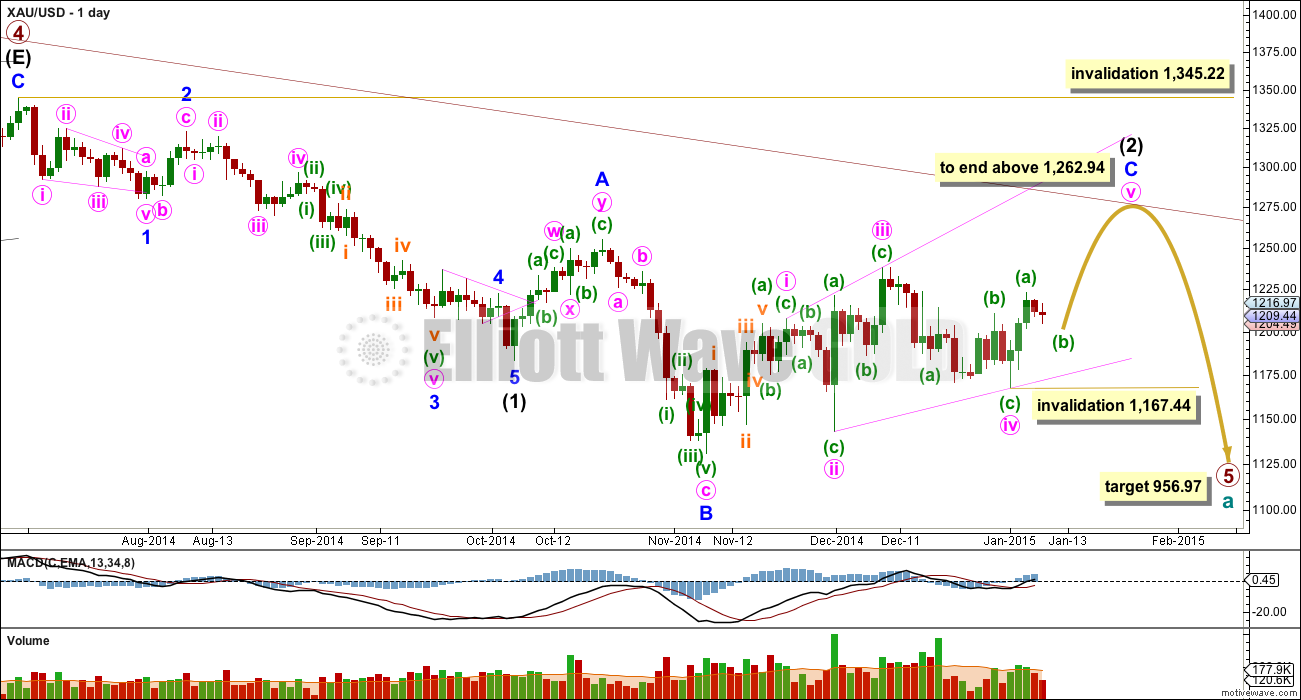
Primary wave 4 is complete and primary wave 5 is unfolding. Primary wave 5 may only subdivide as an impulse or an ending diagonal. So far it looks most likely to be an impulse.
Within primary wave 5 intermediate wave (1) fits perfectly as an impulse. There is perfect alternation within intermediate wave (1): minor wave 2 is a deep zigzag lasting a Fibonacci five days and minor wave 4 is a shallow triangle lasting a Fibonacci eight days, 1.618 the duration of minor wave 2. Minor wave 3 is 9.65 longer than 1.618 the length of minor wave 1, and minor wave 5 is just 0.51 short of 0.618 the length of minor wave 1. I am confident this movement is one complete impulse.
Intermediate wave (2) is an incomplete expanded flat correction. Within it minor wave A is a double zigzag. The downwards wave labelled minor wave B has a corrective count of seven and subdivides perfectly as a zigzag. Minor wave B is a 172% correction of minor wave A. This is longer than the maximum common length for a B wave within a flat correction at 138%, but within the allowable range of twice the length of minor wave A. Minor wave C may not exhibit a Fibonacci ratio to minor wave A. Minor wave C is extremely likely to move at least slightly above the end of minor wave A at 1,255.40 to avoid a truncation and a very rare running flat correction. It may end when price touches the upper edge of the maroon channel, copied over here from the weekly chart. To see how to draw this channel click here.
To see a prior example of an expanded flat correction for Gold on the daily chart, and an explanation of this structure, click here.
Intermediate wave (1) lasted a Fibonacci 13 weeks. It looks like intermediate wave (2) will not end this week, and may last a little longer than a Fibonacci 13 weeks. I would expect it to now last another one or two weeks in total.
So far within minor wave C the highest volume is on three up days. This supports the idea that at this stage the trend remains up. Even for the last 11 trading days the highest volume is in four up days.
Minor wave C may be either an impulse or an ending diagonal. With all the overlapping within it, an ending diagonal looks more likely, and it is now within the final fifth wave up. The diagonal is expanding and the trend lines clearly diverge. Expect the final fifth wave of expanding diagonals to fall short of the i-iii trend line. Minute wave v should be longer than equality with minute wave iii which would be achieved at 1,262.94. This would also see minor wave C end above the end of minor wave A at 1,255.40 avoiding a truncation and a very rare running flat.
Within an ending diagonal all the sub waves must subdivide as zigzags. The fourth wave should overlap first wave price territory. The rule for the end of a fourth wave of a diagonal is it may not move beyond the end of the second wave at 1,142.88.
Intermediate wave (2) may not move beyond the start of intermediate wave (1) above 1,345.22. I have confidence this price point will not be passed because the structure of primary wave 5 is incomplete because downwards movement from the end of the triangle of primary wave 4 does not fit well as either a complete impulse nor an ending diagonal. If it is seen as a complete impulse there would be inadequate alternation between the single zigzag of the second wave and the double zigzag of the fourth wave correction, and there would be no Fibonacci ratios between the first, third and fifth waves within it.
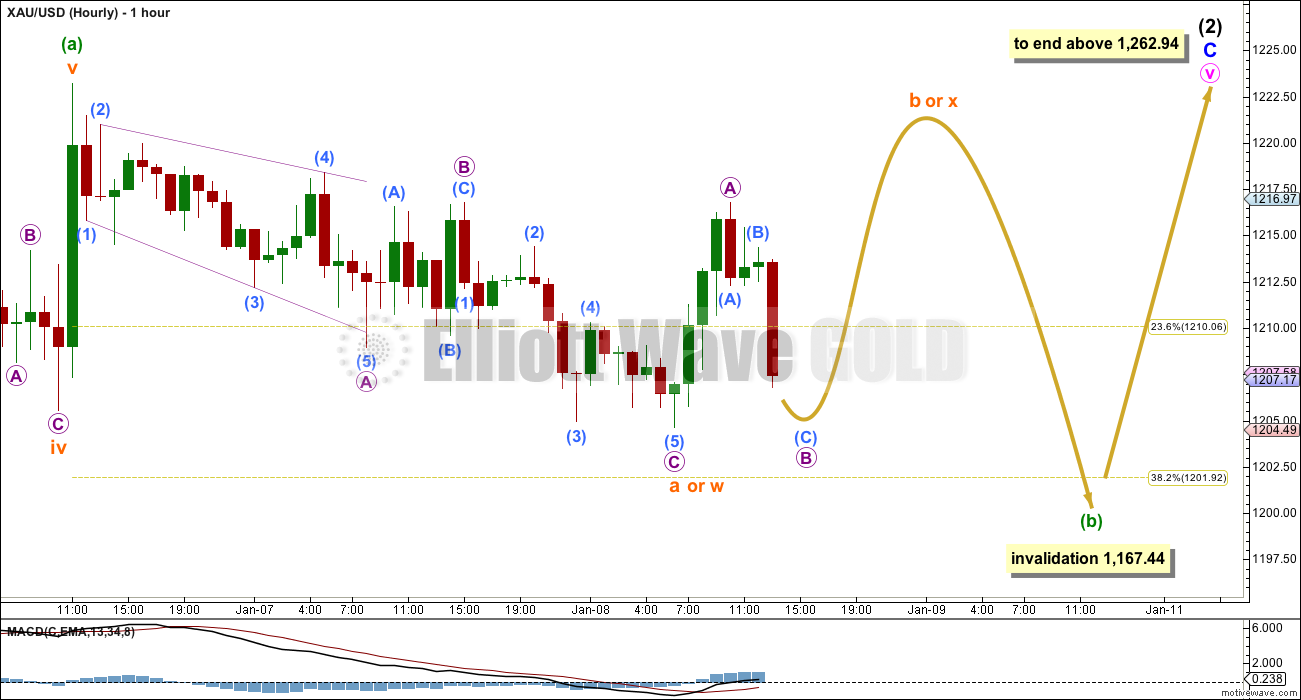
I am moving the degree of labelling within minuette wave (b) all down one degree today. It is too early for this correction to be over.
So far within this ending diagonal of minor wave C on the daily chart within its zigzags the B waves have lasted (in order) 1 day, 1 day, 4 days, 8 days. This final zigzag upward for minute wave v is expected to be longer in length than the prior upwards wave of minute wave iii, because the diagonal is expanding. Because this wave should be longer in length it is also very likely to be longer in duration.
I would expect minuette wave (b) to be four days minimum, and quite likely eight days or longer, although that does seem too time consuming. My analysis over the next few days will focus on seeing if this B wave could be complete… or not. I am confident that when it is over the breakout will be upwards.
Of all Elliott waves it is B waves which exhibit the greatest variety in form and structure. They can be quick sharp zigzags (which can even fool us into thinking they’re impulses; for a great example of this look at minor wave B to the low on the daily chart) or more often they are very time consuming overlapping sideways affairs which are difficult to analyse and are typical consolidation phases.
So far within minuette wave (b) there is a complete 5-3-5 downwards. This may be only subminuette wave a a bigger flat correction, or it may be wave w as the first structure in a double combination.
If minuette wave (b) is unfolding as a flat correction then subminuette wave b within it may make a new price extreme above the start of subminuette wave a at 1,223.23, and it is actually quite likely to do so as the most common type of flat is an expanded flat where B is 105% minimum the length of A, which would be achieved in this case at 1,224.16.
If minuette wave (b) is unfolding as a combination then the first structure in the double would be a completed zigzag labelled subminuette wave w. The purpose of combinations (and double flats and triangles) is to take up time and move price sideways. Fitting this purpose subminuette wave x may make a new high above the start of subminuette wave w at 1,223.23.
It is also possible that mineutte wave (b) could be unfolding as a triangle. For 40% of triangles their B waves move beyond the start of their A waves, and these are termed running triangles.
There is no upper invalidation point for these reasons.
Minuette wave (b) may not move beyond the start of minuette wave (a) below 1,167.44. If it does move as low as the pink ii-iv trend line of the big diagonal which you see on the daily chart, expect downwards movement to find very strong support there. Diagonals almost always adhere very well to their trend lines, only the smallest intra hour overshoot would be allowed and that would be unusual.
Because the first movement subdivides so nicely as a three minuette wave (b) is most likely to be a sideways overlapping movement, rather than a quick sharp zigzag.
This analysis is published about 2:17 p.m. EST.
Take your 3X ETF profits daily and especially before a weekend with a 3X ETF to protect your profits then reevaluate your next buy. I will give gold time to drop. No rush and no risk as have no investment right now. Just look for a very, very low, safe entry today or next week to position myself for the rest of this short term journey up.
Gold is now in a B corrective wave, they are the most difficult to forecast and difficult to trade so I won’t do any 3X ETF during this B consolidation wave as can morph into 13 possible structures so only looking to buy GDX dirt cheap so I can have high probability of making money at short term peak, instead of losing money by surprise twists and turns daily or overnight during this unpredictable B wave. I’ll use a 3X ETF in an established trend instead of for catching falling knives in B waves where the cuts can go 3 times deeper. Been there, done that.
Good plan. 3xetf should be only when Lara declares that 2 C is complete.
Please remind us when u get in to those. Thanks.
Thanks for the good advice.
Re,
Thanks for the good advice..
Re,
Minuette wave (b) seems fit perfectly as triangle…does anybody like it?
Sold the GDX I bought low yesterday, at a profit this morning. Now will wait for gold and GDX to drop in “sideways, overlapping” consolidation at least 2 days up to 6 days, while staying above very strong support trend line at about 1175. Make sure I’ve bought GDX back lower for break out rally up and sell it near next GDX target of 22.26 wave (iii) then wait for GDX wave (iv) drop then buy above invalidation of 19.03 and hold until gold peak wave v C (2) about 1262.94 or beyond and GDX short term rally peak target area of 23.45-23.50 wave (v).
Basically buy reasonable quantity low, sell high without expecting perfection and combining my own detailed study and summary of EW forecast along with the top technical indicators to enter and exit wave bottoms and tops such as DMI, momentum, Parabolic SAR, Ichimoku Wave, and MACD or stochastics RSI and pmbull.com live gold in multiple time frames such as 1 hour, 15, 5, and 1 minute to watch for direction change and buy and sell times at wave bottoms and tops, along with a live quote of the ETF I am looking to buy on yahoo or google finance.
I use 4 monitors and have up 30 websites to optimize my transactions along with reviewing kitco.com for the biggest upcoming news that could assist in the timing of gold changes in EW direction, such as the Fed FOMC meetings and US non-farm payroll news that could be times gold changes momentum all based on Elliott Wave of course.
Hi Richard, 1215 is giving solid support so far.
Scott, it may look solid, however it is only 2 hours after high of the day and it already dropped $6 from high. That is temporary support. Lara mentioned 2 to 6 days of consolidation,which will be a real correction.
Yesterday gold closed at 1,208.90.
I expect that won’t even be solid support.
Lara will give new projections and diagrams before the close. Then I make plans to buy GDX back low probably lower than it’s low yesterday as days of stagnation can depress gold miners price.
No rush to buy with days of consolidation ahead.
Hi Richard, I went Thoughly over Lara’s Analysis for for gold and GDX to get all of the nuances. there’s many different scenarios still open, most of them down.
I like to day trade. I was looking to perhaps get your opinion of the next move…I say the odds are down, you feel down in the next 6 days.
Thanks for the advice.
I don’t mind taking risk.
Too bad it going to 1262 first
An impulse down to 1203 would be fine with me…
Hi Lara Gold wave is unfolding as your analysis has predicted.
I have question on SPX wave. I just watched your Dec 4 video on SPX.
Very interesting.
Is wave iv of SPX over yet?
The wave count has changed somewhat since 4th December for S&P.
I’m expecting right now the S&P should be moving in a third wave within a third wave up to new highs.
Today’s downwards move looks like another second wave correction on the S&P. So it’s ready for a third wave up at three degrees now… if my wave count there is right.
To be honest, I’m struggling with the S&P at the moment.
Thanks Lara. I appreciate your reply.