
In the short term upwards movement was expected from yesterday’s analysis on the hourly chart. The Elliott wave count remains exactly the same.
Summary: Gold is within a consolidation phase which should continue for at least one more day, and most likely longer. The structure of minuette wave (b) is incomplete, and should continue overall sideways. In the very short term this upwards movement may end about 1,226. Thereafter, either a five wave structure down or another three wave corrective structure sideways should unfold.
Click on charts to enlarge
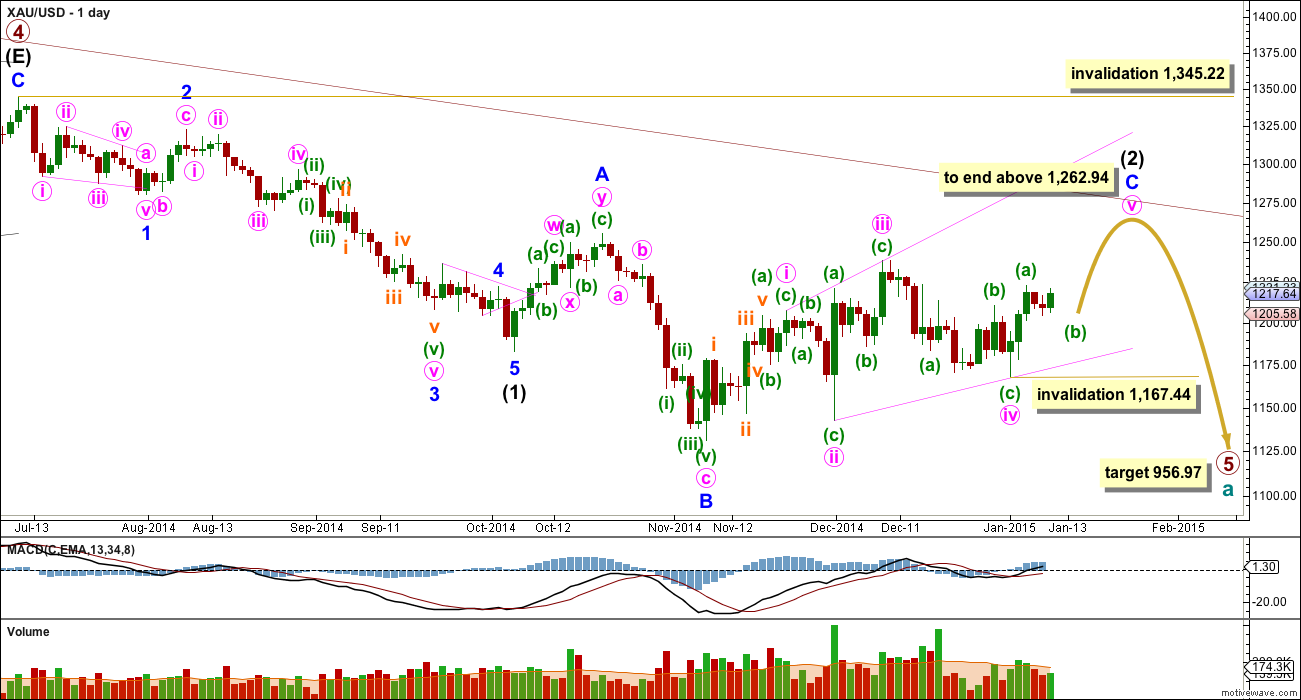
Primary wave 4 is complete and primary wave 5 is unfolding. Primary wave 5 may only subdivide as an impulse or an ending diagonal. So far it looks most likely to be an impulse.
Within primary wave 5 intermediate wave (1) fits perfectly as an impulse. There is perfect alternation within intermediate wave (1): minor wave 2 is a deep zigzag lasting a Fibonacci five days and minor wave 4 is a shallow triangle lasting a Fibonacci eight days, 1.618 the duration of minor wave 2. Minor wave 3 is 9.65 longer than 1.618 the length of minor wave 1, and minor wave 5 is just 0.51 short of 0.618 the length of minor wave 1. I am confident this movement is one complete impulse.
Intermediate wave (2) is an incomplete expanded flat correction. Within it minor wave A is a double zigzag. The downwards wave labelled minor wave B has a corrective count of seven and subdivides perfectly as a zigzag. Minor wave B is a 172% correction of minor wave A. This is longer than the maximum common length for a B wave within a flat correction at 138%, but within the allowable range of twice the length of minor wave A. Minor wave C may not exhibit a Fibonacci ratio to minor wave A. Minor wave C is extremely likely to move at least slightly above the end of minor wave A at 1,255.40 to avoid a truncation and a very rare running flat correction. It may end when price touches the upper edge of the maroon channel, copied over here from the weekly chart. To see how to draw this channel click here.
To see a prior example of an expanded flat correction for Gold on the daily chart, and an explanation of this structure, click here.
Intermediate wave (1) lasted a Fibonacci 13 weeks. Intermediate wave (2) needs at least one more week to complete. If it can do this in just one more week then it will be close enough to even in duration with intermediate wave (1).
So far within minor wave C the highest volume is on three up days. This supports the idea that at this stage the trend remains up. Even for the last 12 trading days the highest volume is in four up days.
Minor wave C may be either an impulse or an ending diagonal. With all the overlapping within it, an ending diagonal looks more likely, and it is now within the final fifth wave up. The diagonal is expanding and the trend lines clearly diverge. Expect the final fifth wave of expanding diagonals to fall short of the i-iii trend line. Minute wave v should be longer than equality with minute wave iii which would be achieved at 1,262.94. This would also see minor wave C end above the end of minor wave A at 1,255.40 avoiding a truncation and a very rare running flat.
Within an ending diagonal all the sub waves must subdivide as zigzags. The fourth wave should overlap first wave price territory. The rule for the end of a fourth wave of a diagonal is it may not move beyond the end of the second wave.
Intermediate wave (2) may not move beyond the start of intermediate wave (1) above 1,345.22. I have confidence this price point will not be passed because the structure of primary wave 5 is incomplete because downwards movement from the end of the triangle of primary wave 4 does not fit well as either a complete impulse nor an ending diagonal. If it is seen as a complete impulse there would be inadequate alternation between the single zigzag of the second wave and the double zigzag of the fourth wave correction, and there would be no Fibonacci ratios between the first, third and fifth waves within it.
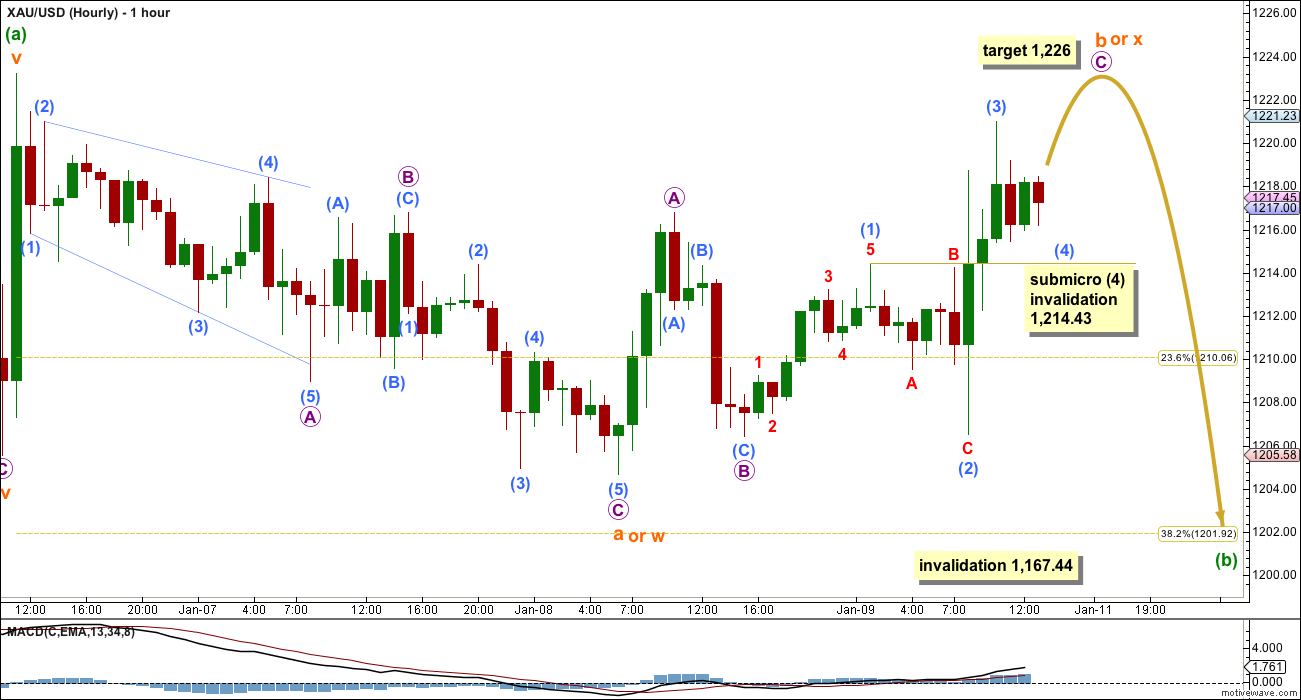
There are still three groups of corrective structures that minuette wave (b) may be unfolding as: a flat, a triangle or a combination.
If minuette wave (b) is to be a very common flat correction, then the most common type is an expanded flat. This would require subminuette wave b to be a minimum of 105% the length of subminuette wave a at 1,224.16 or above. Thereafter, subminuette wave c downwards must unfold as a five wave structure and would most likely be 1.618 or 2.618 the length of subminuette wave a, depending on the length of subminuette wave b.
If minuette wave (b) is to be a triangle then within it subminuette wave b upwards is completing as a zigzag. It may move beyond the start of subminuette wave a at 1,223.23, and 40% of triangles do this. This is termed a “running” triangle. Thereafter, sideways movement in an ever decreasing range would complete the most common type of triangle, a contracting triangle.
If minuette wave (b) is to be a combination then within it the first structure would be labelled subminuette wave w, and this is a zigzag. Subminuette wave x upwards is an incomplete zigzag in the opposite direction, and it may end beyond the start of subminuette wave w at 1,223.23. Thereafter, a second corrective structure would unfold sideways and may be either a flat or a triangle.
The only corrective structures that I think can be eliminated for minuette wave (b) at this stage are all structures within the zigzag family: single, double and the very rare triple zigzags. This leaves the sideways moving types of structures.
Within this upwards zigzag of subminuette wave b or x at 1,226 micro wave C would reach 1.618 the length of micro wave A. At this stage it looks like submicro wave (4) may be completing as a small contracting triangle which may not move back into submicro wave (1) price territory below 1,214.43.
When price has made a new high (whether or not the target is met) then a subsequent new low below 1,214.43 may not be a fourth wave correction and so at that stage the upwards wave of micro wave C would have to be over. This would provide price confirmation that subminuette wave b or x is over and the next movement for subminuette wave c or y would have begun.
Minuette wave (b) may not move beyond the start of minuette wave (a) below 1,167.44. However, it should not get too close to this point as I am expecting it to be a sideways correction, not a quick sharp downwards movement. If it manages to get down that low it should find very strong support at the pink ii-iv diagonal trend line which you can see on the daily chart, because diagonals almost always adhere very well to their trend lines.
So far within this big diagonal of minor wave C (on the daily chart) within its zigzags minuette waves (b) have lasted (in order) one day, one day, four days and eight days. Because this final upwards zigzag of minute wave v should be longer in length than the last upwards zigzag of minute wave iii, it is likely to also be longer in duration. This means that within it minuette wave (b) is likely to be longer in duration also, and so it should be longer than four days. It may last as long as eight days in total.
This analysis is published about 2:08 p.m. EST.
Lara, what’s the probability % for the alternate? Ty
Any initial thoughts, Lara, on the current move? Is a large move down for (b) still probable? Thanks
Yes Lara. Any little hints before your analysis would be much appreciated. Thanks.
Looks to me like we might be in wave iii of 5 of C of 2 now.
We could make the 1262 target in the next couple of days…
I am not so certain that we have even started that b wave down. Gold has held above 1214.43, so this may just be in a smaller 5th wave up to maybe end somewhere in the 1230s. When that ends, then gold may make a more healthy drop. However, let’s see what Lara says.
Matt, you were right price confirmation wasn’t in yet and subminuette wave b or x, wasn’t over yet and gold just spiked up 6 dollars in 2 minutes at 1:21 and 1:22 pm today up to 1235.16.
We are in wave v circle of C of (2). However we are still completing subminuette wave c or y down to finish minuette (b) which may be today or in several days. Then we have a breakout up in minuette (c) to end v circle C (2) at 1262.94+. Friday Lara wrote, “Intermediate wave (2) needs at least one more week to complete.”
As per finishing minuette (b) Friday Lara wrote. :When price has made a new high (whether or not the target is met) then a subsequent new low below 1,214.43 may not be a fourth wave correction and so at that stage the upwards wave of micro wave C would have to be over. This would provide price confirmation that subminuette wave b or x is over and the next movement for subminuette wave c or y would have begun.”
We still don’t have that price confirmation yet as of 1:45 pm Monday.
Hello Lara… I joined your service on 1st Jan or 31st Dec Late Night. Withing 2 weeks of your service I have regained all my losses from last year. Rather I am in profit now. Your 1262 call made me keep buying the dips. I am selling my LONGs today. I have never seen this kind of profits in 3 years of my trade. It will take weeks to digest it. I am so Happy.
Thanks SS
Contgrates for amazing trades. Must have traded futures cont????
.
May be a wise move selling JNUG now. Lara is projecting another drop may be in a decreasing range down to likely low stay above strong support at 1,175. Then Minor wave C begins with a breakout to the outside and may end above 1,262.94 maybe in about 1 week from now. Lara clarifies more daily before close.
Thats great!
Remember though, sometimes I’m wrong. When that happens you want to avoid huge losses by good money management, and good risk management.
My aim is to be right more often than wrong, obviously. But it’s humanly impossible to be right all the time.
If you’re managing to interpret my analysis into profitable trades, you may like to share your strategies and what you’re doing as you do it with other members. I know a few others may be struggling with this.
I am not able to legally offer investment advice; I cannot say “buy here” or “sell here” or “put your stop here”. And I don’t want to, because every traders style is different. What I am doing with this service is offering analysis and teaching you all how to do Elliott wave.
The expectation is members will incorporate my EW analysis with their own technical analysis, and make a decision with their own judgement accordingly.
Back from Lunch. I had made mistakes all the rookie makes. Learnt hard way. Few things which I have learnt and suites me is 1) More the trade, chances are high to make error. 2) Swing Trade Vs Daily Trade 3) ALWAYS ALWAYS HAVE STOP LOSS. I traded JNUG and NUGT in last 2 weeks.
But again I would have sold JNUG and NUGT after seeing 10% profit. Your call encouraged me to keep it for 2 weeks. So I owe this to you.
Lara what is the min retrace for this ‘b’ wave?
thanks
Lara thanks for posting US Oil update.
is 1202 still expected???
Hi Lara, will you still be doing Silver update sometimes please? Just a gentle reminder it’s been a while since the last silver update… Or i suppose that means no change since your last post??
Thing is, silver like gold is pushing up against the Bollinger Bands and TL resistance which can indicate a possible retracement next.
Thanks a bunch.
On Jan 8th post Lara wrote: My analysis over the next few days will focus on seeing if this B wave could be complete… or not.
Wonderful!!! I am looking forward to completion of this wave (b) or wave Y.
Lara great insight you have. Amazingly accurate!!!! WOW.
At 4:16 gold rocketed to 124. Monday should be choppy and down for completion of wave (b) or wave Y?
Congrate!!!
Agreed, amazingly accurate IF gold drops $20+ on Monday before rocketing higher.
Yep. Still need the last part of the prediction before any accuracy can be judged at all.
Strange to see gold rallying almost the whole day today when this is a consolidation wave. I sold my GDX too early today and my brother asked at noon about buying DUST. I decided not to as this is a B wave and trend not established and also Friday before the weekend so decided not to. That was a good decision as DUST was almost at day low then and then dropped $1.54 to it’s low of the day at the close with GOLD pennies from the high and GDX at it’s high of the day.
Gold may drop beginning of next week and consolidate for 1 to 3 days for another opportunity to buy low again before break out up.
post it when time to buy DUST or JDST. I bot some DZZ near closing. For few points and next wk sell it.
Although it is risky. Buying Dust around closing would have been a trade. Monday now gold will head down before opening and DUST /JDST will open with gap up.. If gold had made it Lara’s target before market close I would have bot the shorts.
papudi
Buying DUST at Friday close wasn’t a sure thing. since Friday close gold has gone up $10 as of Monday 1 am. B correction waves are difficult to forecast and dangerous to trade. The trend is up and betting against that with DUST over the weekend on a B wave is something I will avoid. If I buy DUST I prefer market hours and also prefer wave that is not B wave. I’ve been burnt during B waves and now play them safe. Lara may still be correct and Monday gold may crash dive to maybe $1,200 area. I’m happy to wait to buy GDX cheap for the next rally with very low risk.
Yes, agreed.
“The 1×1 Gann angle line from the 2012 high at 1230 looks to be a critical upside pivot with strength above needed to confirm the start of a more important push higher in the metal. A minor turn window is seen on Thursday.”
– Published by FXCM Research last
Wednesday 7 am EST
http://www.dailyfx.com/forex/technical/article/forex_strategy_corner/2015/01/07/PT_JAN_7.html
That nailed both the turn up and the target. I closed out some long gold contracts at
1230.0 earlier today.
Coulda shorted gold from 1230 but it’s too short-term for my preference and the risk:reward is poor at 1:1… gold could drop $30 to 1200 but strength above 1230 would target 1250-60.
Further, before shorting I like to see silver weaker than gold because that’s usually how it is (usually), but not the case yet.
There’s always another trade later. I also may add a few gold and maybe silver too from lower target if hit. This week now there are better setups like Aud/Usd.
Good luck.
I agree. I did not bite on DUST. Decided to wait for market hour than take a chance. Lara also writes about Capital B wave. Is this same as wave (b) on hour chart? Please explain?
papudi
No they are very different.
Capital B wave is on hourly chart and is Minor wave B that started at the October high and already ended at the November low and the B part of minor waves A,B,C that makes up intermediate wave 2.
Wave (b) is minuette wave (b) which started at low of the day January 8th at 6:20 am at 1,204.69. Minuette (b) wave we are in now and may bottom at a low today or up to 4 more days somewhere between 1214.42 and 1,167.44.
Minuette wave (b) may end at 1,210 or 1,202 or above 1,175. I will wait for Lara update or a very low price before I buy GDX for the multi day run up in minor wave C to end this short term rally at least at 1,262.94.
Richard here is a trade completed by a member on another forum on Jan 7:
I sold my 4000 shares of JNUG this morning at $38 from $23. May wait for
a pullback and buy again or just might wait it out for a move into
JDST.
Nice trade in less than two weeks!!!!!
papudi
That was an amazing JNUG trade. $60,000 in about 6 days, like winning a lottery. Actually you would of did even better selling it today, however this minuette wave (b) is unpredictable. Always wise to take profits when in doubt and wait for surer times on a 3X ETF trade.
papudi
My mistake, I see you mentioned that trade was by someone else on another forum. Next time should be one of us. LOL
Time is coming closer. For us that is.