
I had expected a downwards day for Tuesday which is what has happened. The depth of this downwards movement may be surprising, but it fits the wave count nicely.
Summary: It is most likely the correction is incomplete. I expect upwards movement to 1,243 to complete a green candlestick for Wednesday’s session. This would be confirmed with a new high above 1,236.90. Alternatively, it is just possible (highly unlikely) that a strong fifth wave down has begun. This possibility will increase in probability if we see a new low below 1,203.88 in the short term. A possible target for the fifth wave to end may be at 1,146.
Click on charts to enlarge.
Main Daily Wave Count
At this stage I judge this main wave count to have an even probability with the alternate below. I will let the structure of downwards movement, and momentum, tell us which wave count is correct over the next few weeks. At this stage they both expect more downwards movement so there is no divergence in the expected direction.
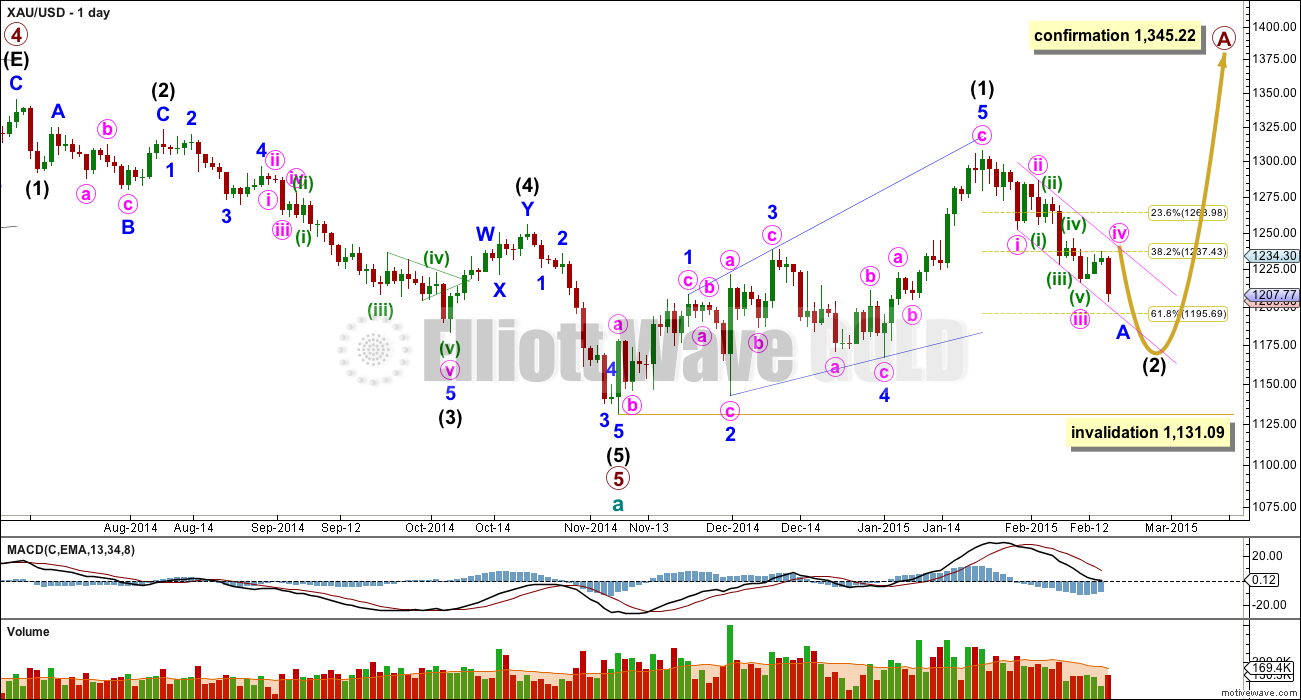
This wave count sees a five wave impulse down for cycle wave a complete, and primary wave 5 within it a completed five wave impulse. The new upwards trend at cycle degree should last one to several years and must begin on the daily chart with a clear five up.
The first five up may be a complete leading expanding diagonal. Within leading diagonals the second and fourth waves must subdivide as zigzags. The first, third and fifth waves are most commonly zigzags but they may also be impulses. This wave count sees minor waves 1, 3 and 5 as zigzags.
Leading diagonals are almost always followed by deep second wave corrections, sometimes deeper than the 0.618 Fibonacci ratio. This wave count expects a big deep correction downwards, and it should subdivide as a clear three on the daily chart (the alternate below expects a five down).
My biggest problem with this wave count, and the reason I will retain the alternate, is the structure of intermediate wave (2) within primary wave 5. This is a rare running flat but the subdivisions don’t fit well. Minor wave C should be a five wave structure, but it looks like a clear three on the daily chart. If you’re going to label a running flat then it’s vital the subdivisions fit perfectly and this one does not. This problem is very significant and this is why I judge the two wave counts to be about even in probability.
Intermediate wave (5) looks like a zigzag rather than an impulse, and has a corrective wave count. This is also a problem I have with this wave count.
Intermediate wave (2) is most likely to subdivide as a zigzag, which subdivides 5-3-5 at minor degree. When this 5-3-5 is complete then how high the following movement goes will tell us which wave count is correct.
It is possible to move the degree of labelling within intermediate wave (2) all up one degree and see it as over. However, I will not publish this idea as it is extremely unlikely and publishing it would give it undue weight. That would see intermediate wave (2) as far too brief and too shallow in comparison to intermediate wave (1). Only if price breaks above 1,251.97 will I seriously consider this idea.
Intermediate wave (2) of this new cycle degree trend may not move beyond the start of intermediate wave (1) below 1,131.09.
From January 23rd onwards, since the expected trend change, volume is highest on down days. This supports the idea that we may have seen a trend change and the trend is now down. Volume for Silver is even clearer, with a big spike on the down day there for 29th January.
The two hourly charts below work for both daily wave counts.
Main Hourly Wave Count
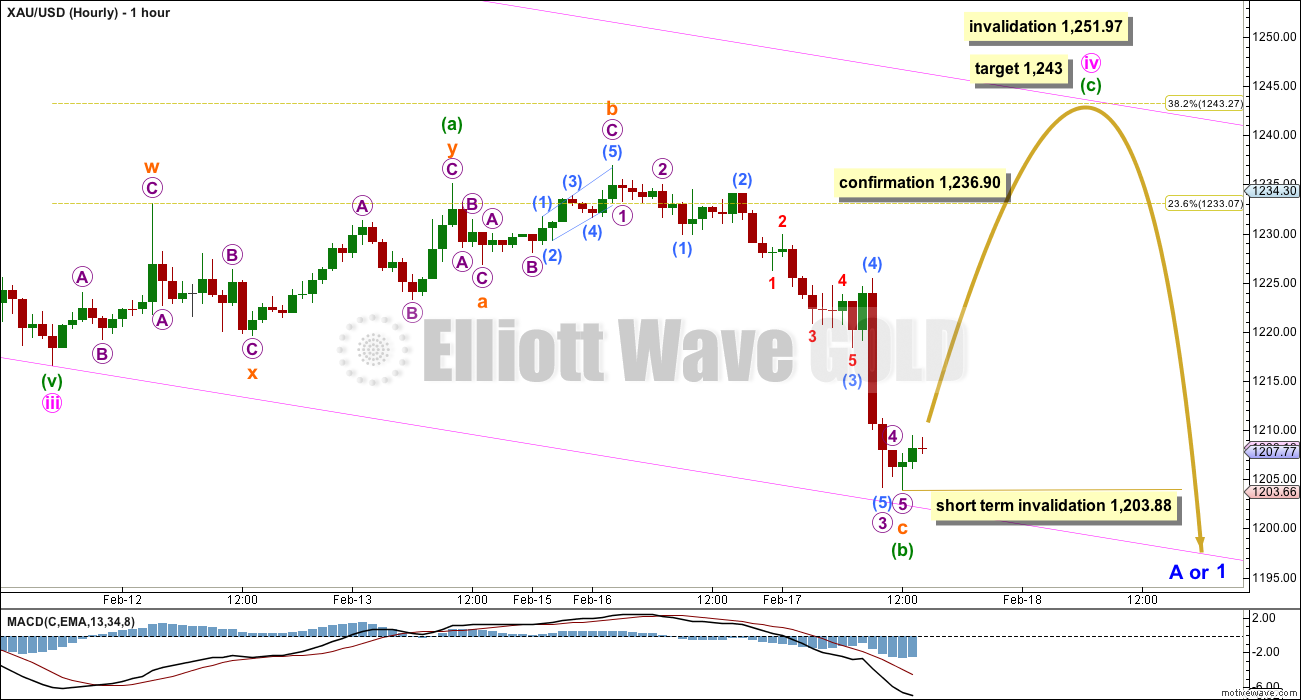
My initial perception of the strong downwards movement for Tuesday was my prior analysis of minute wave iv must have been wrong, that it must be over and the new downwards movement must be the fifth wave to follow it. However, I have tried to see a complete corrective structure within minute wave iv and the only option which I find fits is a very rare triple zigzag. This has a very low probability and it outlined as an alternate below.
What is much more likely is minute wave iv is incomplete and Tuesday was a downwards day as expected for minuette wave (b).
Minute wave ii was a deep 0.61 double zigzag. I would expect to see alternation between minute waves ii and iv, so minute wave iv is unlikely to be a zigzag (or multiple zigzag). Minute wave iv is most likely to be a flat, triangle or combination. All these structures may include a new low for minuette wave (b) or (x) within minute wave iv.
At this stage it looks like minute wave iv may be unfolding as a very common expanded flat correction. Within it minuette wave (a) subdivides perfectly as a three, a double zigzag. Minuette wave (b) is a 169% correction of minuette wave (a). This is deeper than the maximum common length of 138% but it is still entirely viable, I have seen quite a few expanded flats with deep B waves.
Minuette wave (b) fits nicely as an expanded flat: subminuette wave b is a 122% correction of subminuette wave a, and subminuette wave c is 1.67 short of 4.236 the length of subminuette wave a.
I do not expect to see a Fibonacci ratio between minuette waves (a) and (c): if minuette wave (c) were to reach only 1.618 the length of minuette wave (a) it would be truncated and minute wave iv would be a very rare running flat; if minuette wave (c) were to reach 2.618 the length of minuette wave (a) that would take price above the invalidation point.
I expect minuette wave (c) to end about the 0.382 Fibonacci ratio of minute wave iii at 1,243. This would give the expanded flat correction of minute wave iv a typical look.
Minuette wave (c) must subdivide as a five wave structure, either an impulse or ending diagonal. It is most likely to be a simple impulse.
Minute wave iv should find resistance at the upper edge of the pink channel copied over from the daily chart. It may end here.
A new high above 1,236.90 would invalidate the alternate hourly wave count below and provide confidence in the target.
The only part of this wave count that I am uncertain about today is the lower invalidation point. Because I can see subminuette wave c as a complete five wave structure, and because it is so very long in relation to subminuette wave a, it is most likely to be over here. However, I can also see current upwards movement as a continuation of micro wave 4, and I am concerned that we may see one final low for micro wave 5 to complete minuette wave (b).
If minuette wave (b) is complete at 1,203.88 then within minuette wave (c) no second wave correction may move below its start at 1,203.88.
Minute wave iv may not move into minute wave i price territory above 1,251.97.
If minuette wave (c) manages to complete in one day then minute wave iv may end in a total Fibonacci five days, 1.618 the duration of minute wave iii which lasted a Fibonacci three days. This will be my expectation still.
Alternate Hourly Wave Count
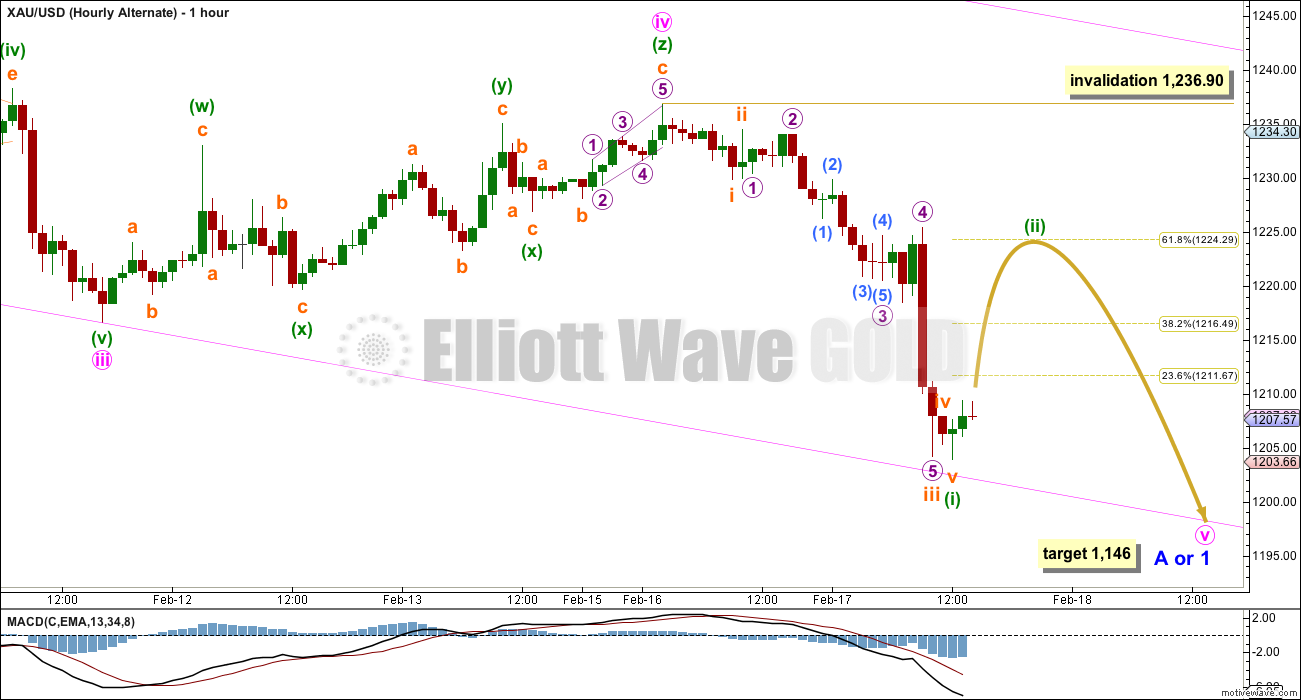
I have tried to see minute wave iv as a completed corrective structure, and in this process I have eliminated all possibilities except a very rare triple zigzag.
Minute wave iv does not fit as a simple A-B-C flat or single zigzag. It will not fit as a double zigzag. It is not a combination, and no three within it has a B wave which is deep enough for a B wave of a flat correction. It is quite obviously not a triangle.
Triple zigzags are very rare indeed. The rarity of this structure makes the probability of this wave count very low.
If minute wave iv is a triple zigzag then there is very little alternation between the deep double zigzag of minute wave ii and the shallow triple for minute wave iv. This would be highly unusual for Gold and further reduces the already low probability of this wave count.
If minute wave iv is over then at 1,146 minute wave v would reach 1.618 the length of minute wave i.
Within minute wave v minuette wave (i) subdivides perfectly as a completed five wave impulse. This would be expected to be followed by a deep second wave correction for minuette wave (ii), to most likely end about the 0.618 Fibonacci ratio at 1,224.
Minuette wave (ii) may not move beyond the start of minuette wave (i) above 1,236.90.
Alternate Daily Wave Count
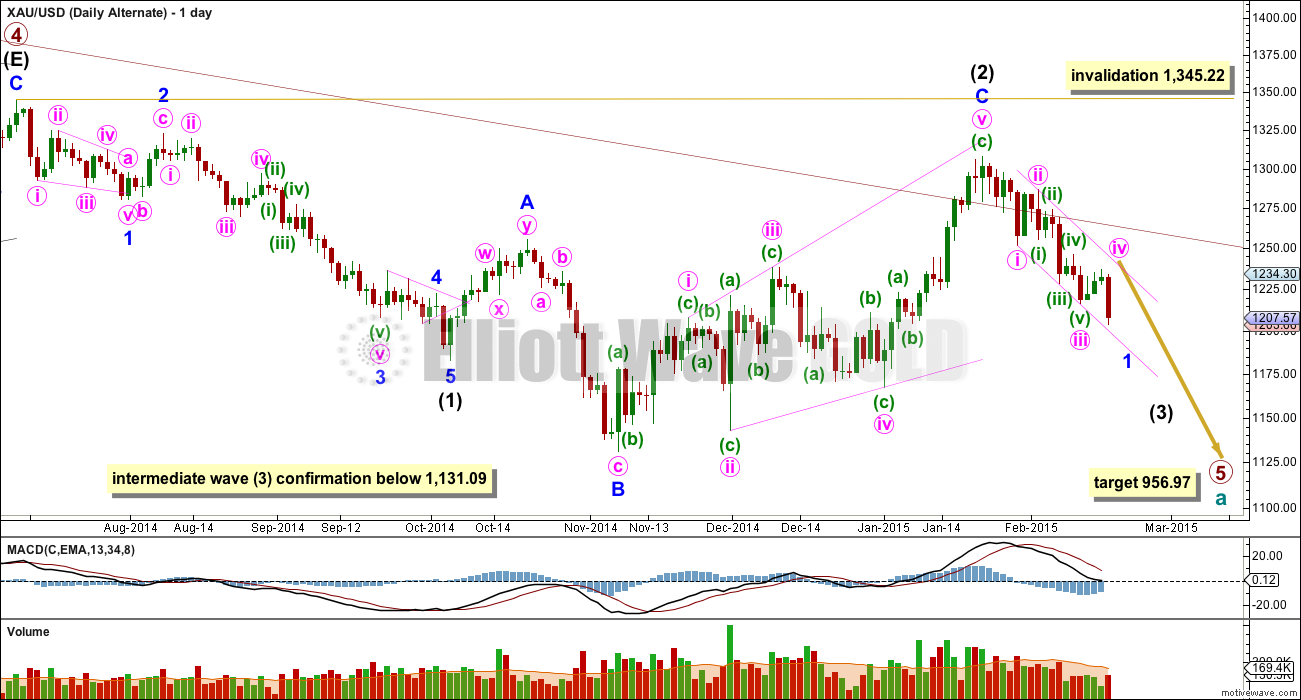
The maroon channel about cycle wave a from the weekly chart is now breached by a few daily candlesticks, and is now also breached on the weekly chart by one weekly candlestick. If cycle wave a is incomplete this channel should not be breached. For this reason and this reason only this wave count, despite having the best fit in terms of subdivisions, only has an even probability with the main wave count. It will prove itself if we see a clear five down with increasing momentum on the daily chart.
Draw the maroon trend line on a weekly chart on a semi-log scale, and copy it over to a daily chart also on a semi-log scale (see this analysis for a weekly chart).
Within primary wave 5 intermediate wave (1) fits perfectly as an impulse. There is perfect alternation within intermediate wave (1): minor wave 2 is a deep zigzag lasting a Fibonacci five days and minor wave 4 is a shallow triangle lasting a Fibonacci eight days, 1.618 the duration of minor wave 2. Minor wave 3 is 9.65 longer than 1.618 the length of minor wave 1, and minor wave 5 is just 0.51 short of 0.618 the length of minor wave 1.
Intermediate wave (2) is an expanded flat correction. Minor wave C is a complete expanding ending diagonal. Expanded flats are very common structures and ending diagonals are more common than leading diagonals.
This wave count has more common structures than the main wave count, and it has a better fit.
For this alternate wave count the diagonal is an ending diagonal for minor wave C. Within an ending diagonal all the sub waves must subdivide as zigzags. The fourth wave should overlap first wave price territory. The rule for the end of a fourth wave of a diagonal is it may not move beyond the end of the second wave.
Although Gold almost always adheres perfectly to trend channels, almost always is not the same as always. This wave count is still entirely possible. The trend channel breach is a strong warning that this wave count may be wrong and we need to heed that warning with caution at this stage. For this wave count once minor waves 1 and 2 are complete (which would be labelled minor waves A and B for the main wave count) minor wave 3 downwards should be very strong and extended, and would probably take price below 1,131.09.
A new low below 1,131.09 would confirm that a third wave down is underway.
At 956.97 primary wave 5 would reach equality in length with primary wave 1.
Intermediate wave (2) may not move beyond the start of intermediate wave (1) above 1,345.22. If this invalidation point is passed this wave count would be fully invalidated.
The short to mid term outlook for both wave counts is identical. The structure and labelling on the hourly chart is identical, so I will publish only the one hourly chart while the wave counts do not diverge.
This analysis is published about 04:13 p.m. EST.
I’m using the Yahoo Finance data, because it’s easily available in a format I can use.
I know different data will provide slightly different price points, I don’t know why and for GDX I don’t think that should happen, but it does.
From an EW perspective as long as the same data source is used for analysis throughout then it should work.
But then… EW doesn’t work with reliability on GDX anyway. So take my GDX analysis with that caveat.
Looks like a short sqeeze
Lara wrote it is going to be a green candle. If gold reaches 1224 or higher IS it good to short PM???
http://www.marketwatch.com/newsviewer
Instant news on FOMC
GDX dropped below $20.42, which invalidated the bull run and now the target is $14. This means that the Gold wave count probability now makes the alternate wave count much higher and Lara mentioned in a previous post that if this would happen, the wave count would switch. This would now provide higher confirmation that Primary Wave 5 down to a target of $956 is not over. If EW holds true to facts, watch out below….
I question the data feed used to get that 20.42 invalidation point. If you look at a daily chart from stockcharts.com, the wave 1 high was 20.29 on 25nov14 and that has not been hit (yet).
If you ask me, gold may have just completed minuette wave (i) of minute wave v. Minuette wave (ii) should take gold to 1221-22 area (0.618 of move from 1236 down to recent low). After gold hits that, it plunges again.
I hope you’re right. I’ve got a tight SL now.
I’d be surprised if we blow through 61.8% retrace without a more significant bounce. I believe minor 1/A is complete at $1197. It’s the level I’ve been eyeing for 3 weeks.
Gold moving at 2:01. Bounce has begun may be????????
Chapstick, how high will it bounce?
This is a significant level, which I too used to believe would be the end of minor 1. However, I’ve started to think otherwise because of Lara’s counts. A 61.8% retracement from 1308 down to recent low would bring gold back to the 1260s. I wouldn’t rule that out. Am holding some light long positions as it is, so I’ll play that by ear. Minor 2 should correct as a three and could be as short as 5 to 8 days.
Expect Lara to change the pm and alt waves today. Complete overhaul of waves is expected.
GDX below 20.40 has signeld PM in bear trend??????
We all know that. An intraday update would be helpful as the alt chart/ text needs work.
Getting support at the lower edge of the pink channel copied over from the daily chart. I’m guessing FOMC minutes release will give the decisive breach or bounce needed to make things clear.
I think it is here bottm of minuette 5 and minute 3. So now minute 4…
Could just be sideways and then strong impulse down.
I see possible positive divergence RSI on 4H chart . So possible bottoming . Possible .
I mean 1H chart .
I agree .
Subdivision is clear. I think it was ending diagonal. It would also suggest alt count is now primary
The final target is 1140-1130 right? But from here wave B was expected to go as far as 61.8 % of the whole wave A. Looks like buy opportunity
What is the price point for 61.8% retracement?
GDX bull count invalidated
Alternate Wave count probability for Gold now has the higher probability. GDX now on its way down to $14 and Gold sub 1,000. If EW holds true, watch out below….
FOMC days are always unpredictable.
Gold crept to 1211 and then dropped below 1200 a while ago. It looks like the main count is invalidated (having gone below 1203.88). The alternate hourly count appears to be underway, targeting 1146.
Furthermore, the target is pretty close to 1131.09 (which marks the start of Cycle B) and there are at least another two waves to go from 1146. If 1131.09 is subsequently breached, the alternate daily count is the only one remaining, with a target of 956.97.
Gold Plunges, Heading Toward Key “Line In The Sand”
By Kira Brecht of Kitco News
Tuesday February 17, 2015 9:32 AM
Mentions 1199.6 and 1197.7 support areas.
(Kitco News) – Comex April gold futures plunged lower Tuesday, breaking below key support at the 100-day moving average.
http://www.kitco.com/news/2015-02-17/Gold-Plunges-Heading-Toward-Key-Line-In-The-Sand.html
Short term invalidation and close to a trend line breach. With no alternatively hourly chart floundering here.
Hi. With a SL at 1211 or 1222-23, upside risk 1233-34, I would play for the downside 119x-118x. Gold price is riding a sell signal with ADX, DMI, MACD etc. pointing for lower prices…. Stochastic is oversold indicative of a possible price rise but gold price remains bearish and I wouldn’t expect gold price to rise above pivot/100dma/5dma (1215-17). Let’s see how this plays out. Good luck!
I would like to see $1198ish tested first, but not required as Lara said in the update. With either count, FOMC minutes should send gold higher. It’s just a matter if it’s wave ii or wave iv. The probability has increased that’s it’s wave ii.
Visualizing scenario: Before release of FOMC min gold hits Lara’s target nd after gold starts wave v or wave iii???Hmmmm
Markets have historically remained tame before the release of meeting minutes, so action likely won’t start until shortly after 2 pm EST.
Never mind. Ha-ha
You got what you were looking for. Guess the next move up would be wave ii.
The alt doesn’t indicate this moving back up.
From price and volume analysis Gold just tested yesterday’s low at 1202.67 w/low volume (??). Now it should move up to Lara’s target.
So far it looks bearish. Now .764 fibo is in play.
Wednesday 2 pm FOMC minutes being released from January 28th FOMC meeting which when press released issued at 2 pm. Gold dropped Jan 28th and January 29th.
Lara is forecasting gold may hit 1,243 Wednesday.
I sure hope the FOMC 2 pm minutes doesn’t send gold down like last month.
February 18th FOMC Minutes
2:00 p.m. ET
Federal Reserve issues FOMC statement
January 28, 2015
I am glad gold did not drop below 1203 in last 10 hours. If gold stays around 1208 that will be fine. I do not see one day 30+ rise in gold.
Wow, Lara, the amount of analysis that goes into your daily report is truly astounding! Might even win an EW Guinness World Record.
I am extremely pleased to find Lara’s service. Even bought EWP book.
I’ll second that! The sophistication and diligence demonstrated in Lara’s analysis is unparalleled on the web.
EW analysis is damned hard and although Lara doesn’t pretend that it can be made easy, she is always able to give us some kind of edge over other EW traders.