
A new high above 1,211.78 confirmed the main hourly Elliott wave count and invalidated the alternate.
Summary: I expect overall two more days of upwards movement to 1,243. When this fourth wave correction is done I expect to see a long strong fifth wave down. I am swapping over the main and alternate daily wave counts today; the new main daily wave count has a higher probability.
Click on charts to enlarge.
Main Daily Wave Count
The wave counts for Silver and GDX, which see a cycle degree (Silver) or primary degree (GDX) trend change at the last low, have both been invalidated. This will reduce the probability that Gold has had a cycle degree trend change, and so I am swapping over the daily wave counts today and giving this main wave count a higher probability.
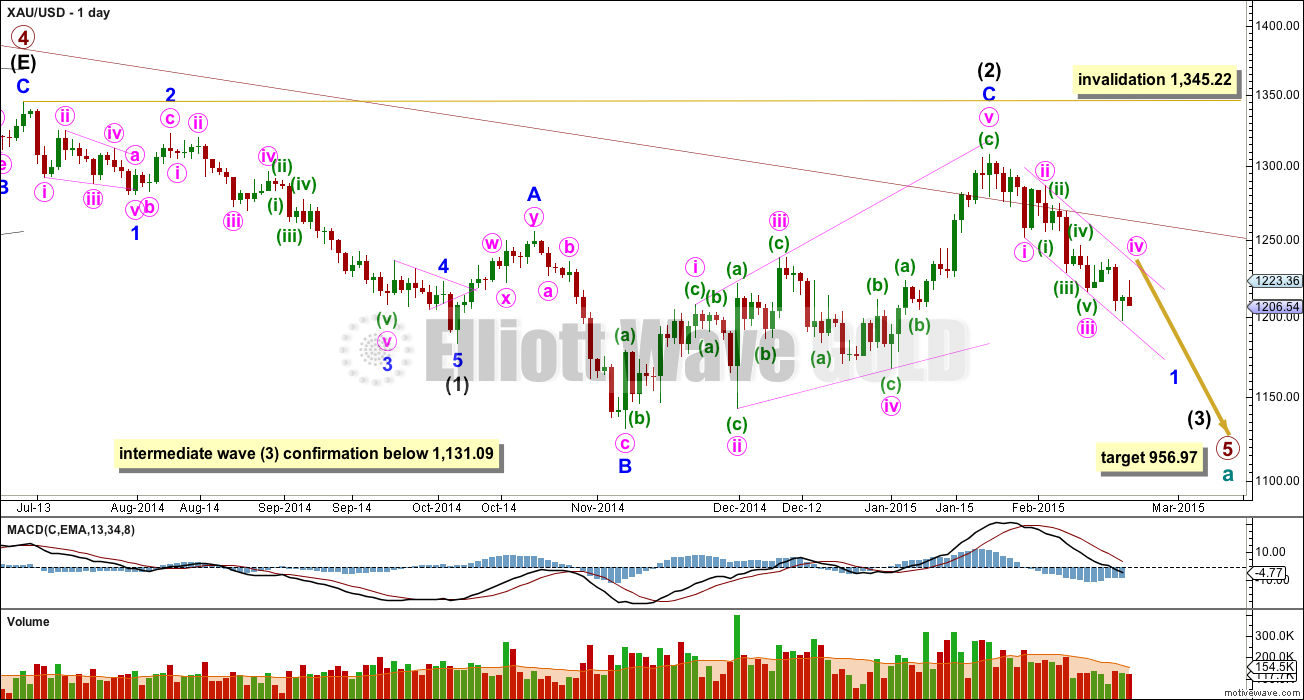
This main wave count sees Gold as still within a primary degree downwards trend, and within primary wave 5 intermediate wave (3) is in its early stages. At 956.97 primary wave 5 would reach equality in length with primary wave 1.
The maroon channel about cycle wave a from the weekly chart is now breached by a few daily candlesticks, and is now also breached on the weekly chart by one weekly candlestick. If cycle wave a is incomplete this channel should not be breached. The breach of this channel is a warning this wave count may be wrong, and so I will retain the alternate.
Draw the maroon trend line on a weekly chart on a semi-log scale, and copy it over to a daily chart also on a semi-log scale (see this analysis for a weekly chart).
Within primary wave 5 intermediate wave (1) fits perfectly as an impulse. There is perfect alternation within intermediate wave (1): minor wave 2 is a deep zigzag lasting a Fibonacci five days and minor wave 4 is a shallow triangle lasting a Fibonacci eight days, 1.618 the duration of minor wave 2. Minor wave 3 is 9.65 longer than 1.618 the length of minor wave 1, and minor wave 5 is just 0.51 short of 0.618 the length of minor wave 1.
Intermediate wave (2) is an expanded flat correction. Minor wave C is a complete expanding ending diagonal. Within an ending diagonal all the sub waves must subdivide as zigzags. The fourth wave should overlap first wave price territory. Expanded flats are very common structures and ending diagonals are more common than leading diagonals.
This wave count has more common structures than the alternate wave count, and it has a better fit.
A new low below 1,131.09 would confirm that a third wave down is underway.
Intermediate wave (2) may not move beyond the start of intermediate wave (1) above 1,345.22. If this invalidation point is passed this wave count would be fully invalidated.
Use Elliott’s first technique to draw a channel about minor wave 1: draw the first trend line from the ends of minute waves i to iii, then place a parallel copy on the end of minute wave ii. Copy this over to the hourly chart.
From January 23rd onwards, since the expected trend change, volume is highest on down days. This supports the idea that we may have seen a trend change and the trend is now down. Volume for Silver is even clearer, with a big spike on the down day there for 29th January.
The short to mid term outlook for both wave counts is identical. The structure and labelling on the hourly chart is identical, so I will publish only the one hourly chart while the wave counts do not diverge.
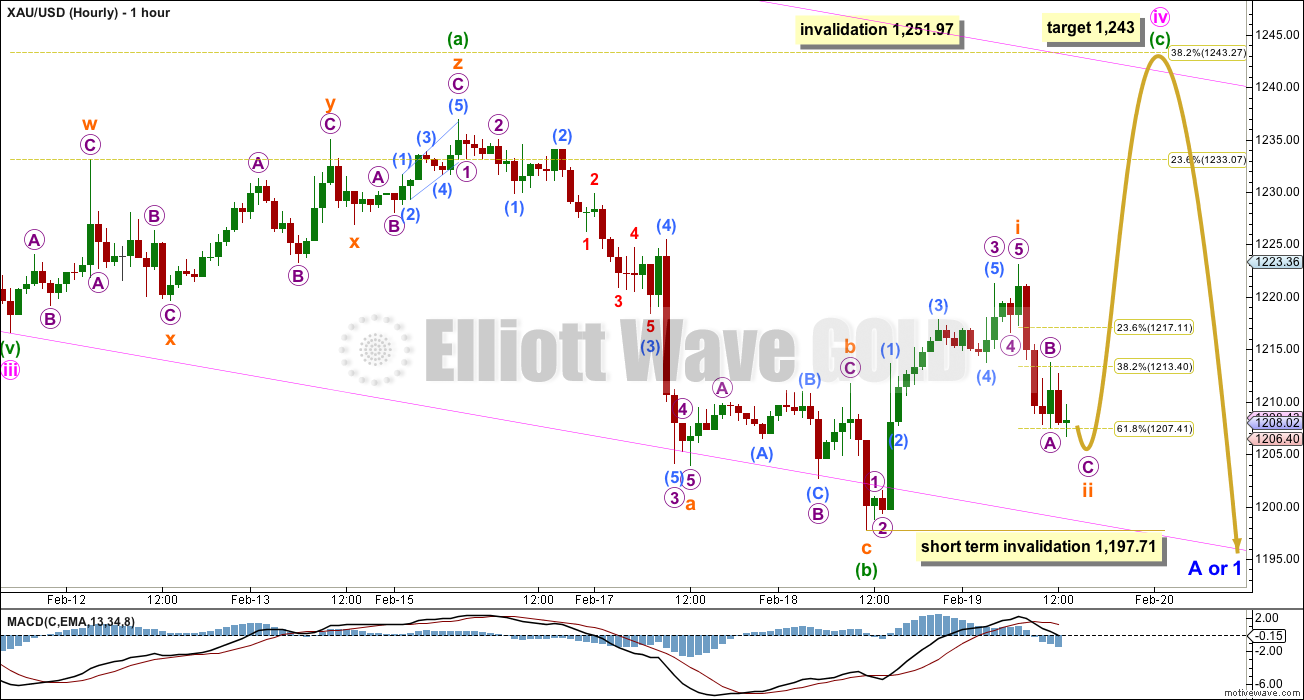
The last wave down from the high labelled minuette wave (a) to the low labelled minuette wave (b) looks like a three wave structure on the hourly chart, which perfectly fits as a B wave of an expanded flat correction.
Minute wave ii was a deep double zigzag lasting a Fiboancci three days. Minute wave iv is most likely to show alternation in structure and depth, which is most typical for Gold. Minute wave iv is unfolding as an expanded flat correction, a very common structure. It is most likely to end about the 0.382 Fibonacci ratio at 1,243. If it continues for another two days it may end in a total Fibonacci eight days, 2.618 the duration of minute wave ii. This would be typical behaviour for Gold.
Minuette wave (c) may only subdivide as a five wave structure, either an impulse or an ending diagonal. So far it looks like it will be an impulse, which is more likely. Within it subminuette wave ii may not move beyond the start of subminuette wave i below 1,197.71. Subminuette wave ii must look like a clear three on the hourly chart, and may now be complete.
The pink channel here is copied over from the daily chart. Fourth waves often end contained within these channels, but not always. That is why Elliott had a second technique to use when the fourth wave overshoots the channel. If minute wave iv continues for two more days it will overshoot the channel. That’s okay. We will redraw the channel using Elliott’s second technique to show us where minute wave v may end, although in this case I am expecting a long strong fifth wave so the lower end of a channel drawn using either technique will probably be breached.
Minute wave iii has no Fibonacci ratio to minute wave i and it was shorter than 1.618 the length of minute wave i. For this reason I will expect minute wave v to be a strong fifth wave typical of commodities, longer than minute wave iii.
If 1,197.71 is breached this hourly wave count would be invalidated. If that happens the only scenario I can see would be that minute wave iv is over and minute wave v downwards is underway. Minute wave v would most likely be unfolding as an ending diagonal because the first move down looks like a three wave structure. This idea has such a low probability, I don’t want to chart it. I will only publish it if it proves itself to be true.
Alternate Daily Wave Count
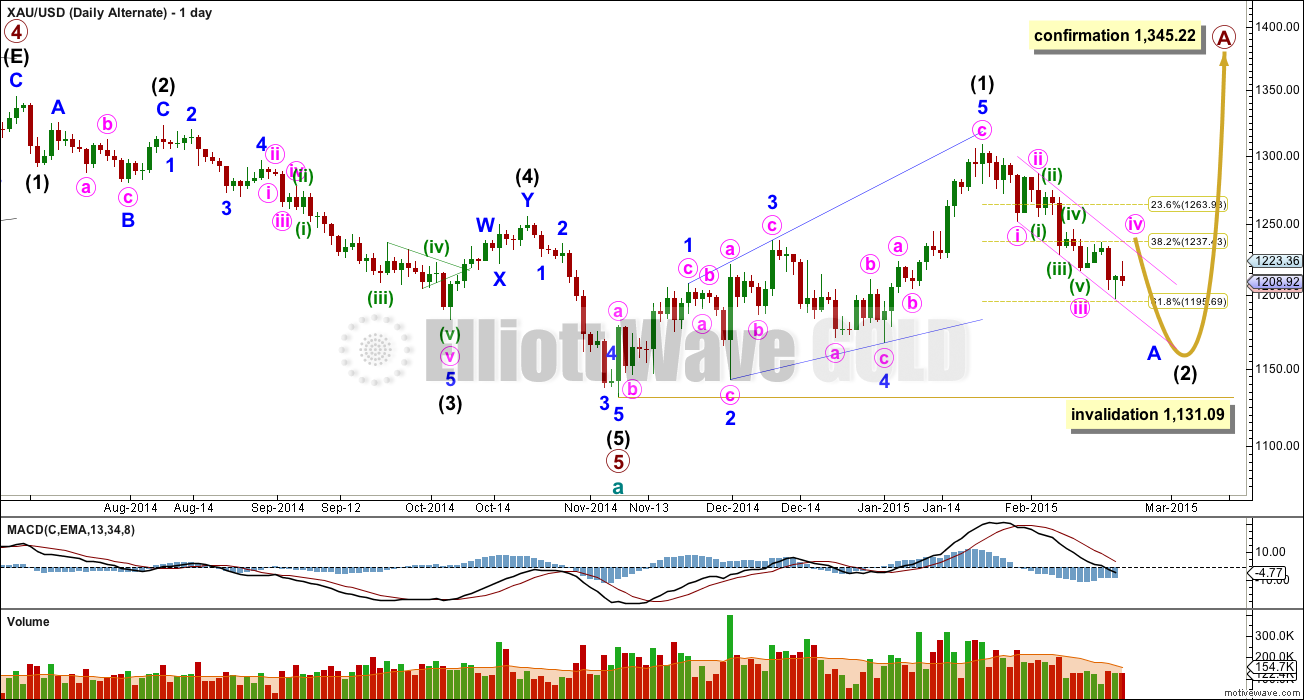
At this stage I judge this alternate wave count to a lower probability. The structure of downwards movement, and momentum, will determine wave count is correct over the next few weeks. At this stage they both expect more downwards movement so there is no divergence in the expected direction.
This wave count sees a five wave impulse down for cycle wave a complete, and primary wave 5 within it a completed five wave impulse. The new upwards trend at cycle degree should last one to several years and must begin on the daily chart with a clear five up.
The first five up may be a complete leading expanding diagonal. Within leading diagonals the second and fourth waves must subdivide as zigzags. The first, third and fifth waves are most commonly zigzags but they may also be impulses. This wave count sees minor waves 1, 3 and 5 as zigzags.
Leading diagonals are almost always followed by deep second wave corrections, sometimes deeper than the 0.618 Fibonacci ratio. This wave count expects a big deep correction downwards, and it should subdivide as a clear three on the daily chart.
My biggest problem with this wave count is the structure of intermediate wave (2) within primary wave 5. This is a rare running flat but the subdivisions don’t fit well. Minor wave C should be a five wave structure, but it looks like a clear three on the daily chart. If you’re going to label a running flat then it’s vital the subdivisions fit perfectly and this one does not. This problem is very significant.
Intermediate wave (5) looks like a zigzag rather than an impulse, and has a corrective wave count. This movement fits better for the main wave count.
Intermediate wave (2) is most likely to subdivide as a zigzag, which subdivides 5-3-5 at minor degree. When this 5-3-5 is complete then how high the following movement goes will tell us which wave count is correct.
Intermediate wave (2) of this new cycle degree trend may not move beyond the start of intermediate wave (1) below 1,131.09.
This analysis is published about 02:15 p.m. EST.
Just bought JNUG after selling 45 minutes ago – cowboy move?
Scary stuff – $1198.20 the low… Could it reverse from here? Anyone confident still?
I am employing a new strategy. Bot JDST and staying with JNUG. Upside is limited to gold over 1230 and for sure going down. If gold breaks 1197, sell JNUG and buy more of JDST.
I am waiting now for 1196 and will buy JDST. Just sold JNUG after a really frustrating week.
Lara gold already broke below 1201.62. Now alt will be primary????
AND discard the expanded flat ???
1197.71 is the point of invalidation not 1201.62…. Appears Gold price could go lower to 1195-90… A cycle turn window is in play.
If gold moves up from here we’ll know it’s for real.
Euro Advances as Greek Official Says Accord Appears Reached
http://www.bloomberg.com/news/articles/2015-02-20/euro-advances-as-greek-official-says-accord-appears-reached
U.S. stocks get a bump on reports of Greek debt accord Published: Feb 20, 2015 12:57 p.m. ET
http://www.marketwatch.com/story/us-stocks-futures-waver-ahead-of-greece-meeting-pmi-2015-02-20
AND PM sector goes down!!!
Is this an expanded flat turning into some other wave now?
I have sold my long. Really disappointing but this looks only to be going one way.
The way gold’s acting you’d think that news of Greek decision had started to leak out.
Lara GDX analysis last night.
“I would expect minute wave ii to move higher to 22.13 or above.”
I am wondering too about a five wave structure up to 124x though the upside looks to be curtailing at 1219-22…. Was it 1 up 1201 to 1215, 2 down to 1205-04, 3, 4, 5, to follow? It so happens gold price drop earlier in the day stopped at the lower edge of a triangle at 1201…. Cant wait for the upside correction to be over and done with to initiate the Sells lol…. 🙂
Any EWers comments pls.
Gold completes wave ii at 1201 and now is in sub wave ii after completing sub wave i above 1216 of wave c of wave iv.
Is there any fib relation here??
Critical Area For Gold At $1,198 – Gary Wagner Feb 20, 2015 LARA says $1,197.71 line below which gold will keep going down
http://www.kitco.com/news/video/show/Chart-This/903/2015-02-19/Critical-Area-For-Gold-At-$1198—Gary-Wagner
super force signals morris hubbartt GDX analysis
http://bit.ly/1CSs1Kg
Are we still on track for the main hourly wave count? Is this micro 2 of subminuette wave iii?
Gold now dropping fast. Having some real concerns about this projection upwards.
Me too and $1215 needs to be breached. Higher above $1215 and lower below $1197 – there’s your pivots
Agreed – Since the confirmation above 1211 we have repeatedly cycled. I believe a Greek decision may confirm the next move.
If I am not mistaken, the meeting on the fate of Greece began at 10:30 am EST. In other words, the outcome may be announced within the hour.
These deep 2nd waves are very uncomfortable, but I don’t see any other possible structures to have gold do anything other than go up (in the short term). The move to 1215 was significant.
Thanks for your input. Very uncomfortable and having held a long via JNUG for a few days I feel like a rag doll.
Lets see whether we can sustain a move north today. A move below 1200 will see me exit my position.
Yes, thanks, and I agree. In similar position. GDXJ/JNUG price has been holding up reamarkably well though – seems like many are anticipating a big move up?
Is it plausible to have such deep 2nd waves on the way up like this? If Lara’s count is incorrect, then this would be a 3rd wave of a diagonal down…..right?
Now if gold violate 1201 then 1197 is certain during the day. By 9AM gold must behave like in wave iii an impulse. !!!!!!
just spiked $10 higher, but will it hold? Pulling back already
You have great insight. Gold should be now in Xflat with 5 waves up to wave c. I can not count 5 waves. EW dummy that I am.
Dear Lara, given it is ending diagonal, where do you see its beginning?
I have a better alternate. Writing it up now. Hopefully will have time to publish before I have to go out today.
If it breaks below 1,201.61 then the middle of a third wave down may be unfolding.
The main wave count would have added confidence with a new high above 1,223.10
Good time now to jump in with a few pts SL
Gold’s PM hour chart wave c and wave ii completes at 1205.53 and price has moved up to 1209 at 8PM EST in wave iii of wave C of wave iv to 1243.
How far will wave iii rise before subminuette wave iv begins?
I’m fairly certain gold will head higher short term. Wave ii retraced about 67% which is typical of ED. This c wave could be an ED, but doesn’t have to be.
Once gold trades above 1214, the target 1243 will be in sight.
I want to know what happens in between Papudi. Ty…At least an opinion, right or wrong is fine…
From experience Scott it is usually a flex between pain/ anxiety and joy.
never a dull moment…
So true. Would be wonderful to be all joy like when gold hits a solid bottom and goes up for months. Been there, done that. Looking forward to that this year, as soon as possible.
My heart say 1,243 is coming but my mind says; it’ll be a cold day in hell….
Hi Lara, seems to be a tug of war between the Bears and Bulls. Is there a chance we could test yesterday’s low? Ty
Of course. Anythings possible. I could be wrong, minute wave v could be unfolding as an ending diagonal.
A tug of war between bulls and bears…. would be typical of a consolidation phase. Which is what a fourth wave correction is. The breakout will be down when it’s done, but bears will win. But first, the bulls may have their last gasp for now.
Thanks Lara