
A new low below 1,201.61 invalidated the main hourly Elliott wave count and confirmed the alternate. At that stage more downwards movement was expected.
Summary: A third wave down is unfolding. The target for it to end is 1,124. The alternate wave count is further reduced in probability, and it sees a fifth wave down unfolding with a target at 1,167. Both Elliott wave counts expect to see an increase in downwards momentum over the next one to two days.
Click on charts to enlarge.
Main Daily Wave Count
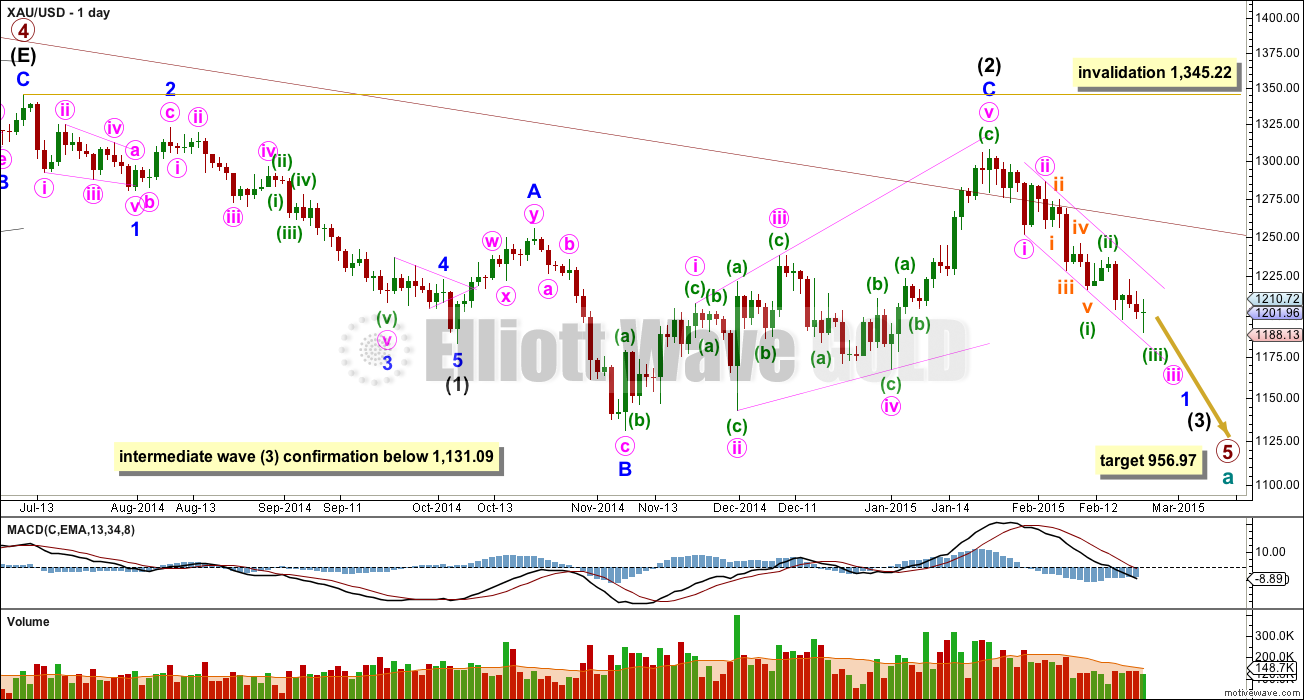
This main wave count sees Gold as still within a primary degree downwards trend, and within primary wave 5 intermediate wave (3) is in its early stages. At 956.97 primary wave 5 would reach equality in length with primary wave 1. For Silver and GDX this idea, that the primary trend is down, is the only remaining wave count. This main wave count has a higher probability than the alternate below.
The maroon channel about cycle wave a from the weekly chart is now breached by a few daily candlesticks and one weekly candlestick. If cycle wave a is incomplete this channel should not be breached. The breach of this channel is a warning this wave count may be wrong, and so I will still retain the alternate.
Draw the maroon trend line on a weekly chart on a semi-log scale, and copy it over to a daily chart also on a semi-log scale (see this analysis for a weekly chart).
Within primary wave 5 intermediate wave (1) fits perfectly as an impulse. There is perfect alternation within intermediate wave (1): minor wave 2 is a deep zigzag lasting a Fibonacci five days and minor wave 4 is a shallow triangle lasting a Fibonacci eight days, 1.618 the duration of minor wave 2. Minor wave 3 is 9.65 longer than 1.618 the length of minor wave 1, and minor wave 5 is just 0.51 short of 0.618 the length of minor wave 1.
Intermediate wave (2) is an expanded flat correction. Minor wave C is a complete expanding ending diagonal. Within an ending diagonal all the sub waves must subdivide as zigzags. The fourth wave should overlap first wave price territory. Expanded flats are very common structures and ending diagonals are more common than leading diagonals.
This wave count has more common structures than the alternate wave count, and it has a better fit.
A new low below 1,131.09 would confirm that a third wave down is underway.
Intermediate wave (2) may not move beyond the start of intermediate wave (1) above 1,345.22. If this invalidation point is passed this wave count would be fully invalidated.
Draw a channel about minor wave 1: draw the first trend line from the end of minute wave i to the end of minuette wave (iii), then place a parallel copy on the end of minute wave ii. Copy this over to the hourly chart.
From January 23rd onwards, since the expected trend change, volume is highest on down days. This supports the idea that we may have seen a trend change and the trend is now down. Volume for Silver is even clearer, with a big spike on the down day there for 29th January.
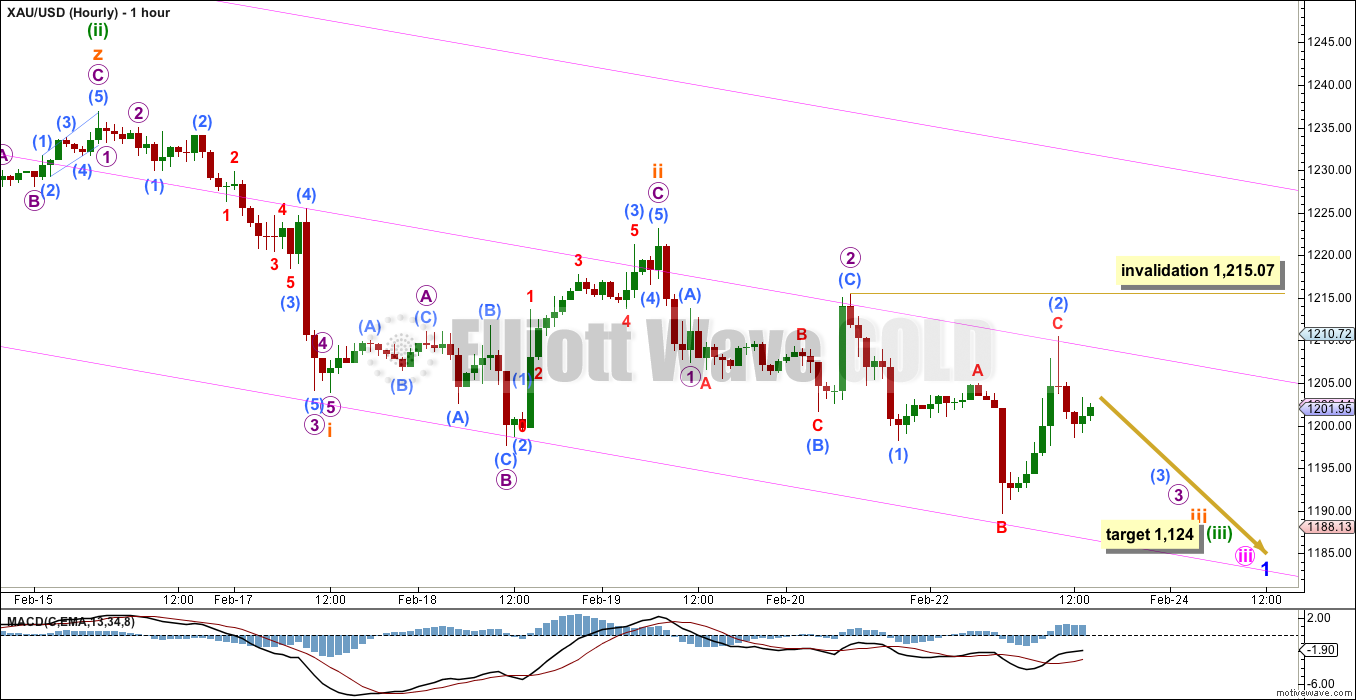
Within minute wave iii minuette waves (i) and (ii) are complete. At 1,124 minuette wave (iii) would reach 1.618 the length of minuette wave (i).
Minuette wave (ii) shows up on the daily chart, and it lasts three days. For the wave count to have the right look at the daily chart level minuette wave (iv) should also show up on the daily chart. The next interruption to the downwards trend should come at the end of minuette wave (iii).
This wave count still has the right look and still shows Gold exhibiting very typical behaviour, despite the deep corrections. I have considered the possibility that a leading diagonal (or ending for the alternate below) could be unfolding, but the subdivisions will not fit at all well. I am reasonably confident this is a series of overlapping first and second waves.
The channel drawn here is copied over from the daily chart and it seems to be a good guide to where price is finding support and resistance. The mid line is a useful addition. If this wave count is correct then when the middle of the third wave gathers momentum the lower edge of the channel should be breached and price should then stay below it.
Within micro wave 3 submicro wave (2) may not move beyond the start of submicro wave (1) above 1,215.07.
Alternate Daily Wave Count
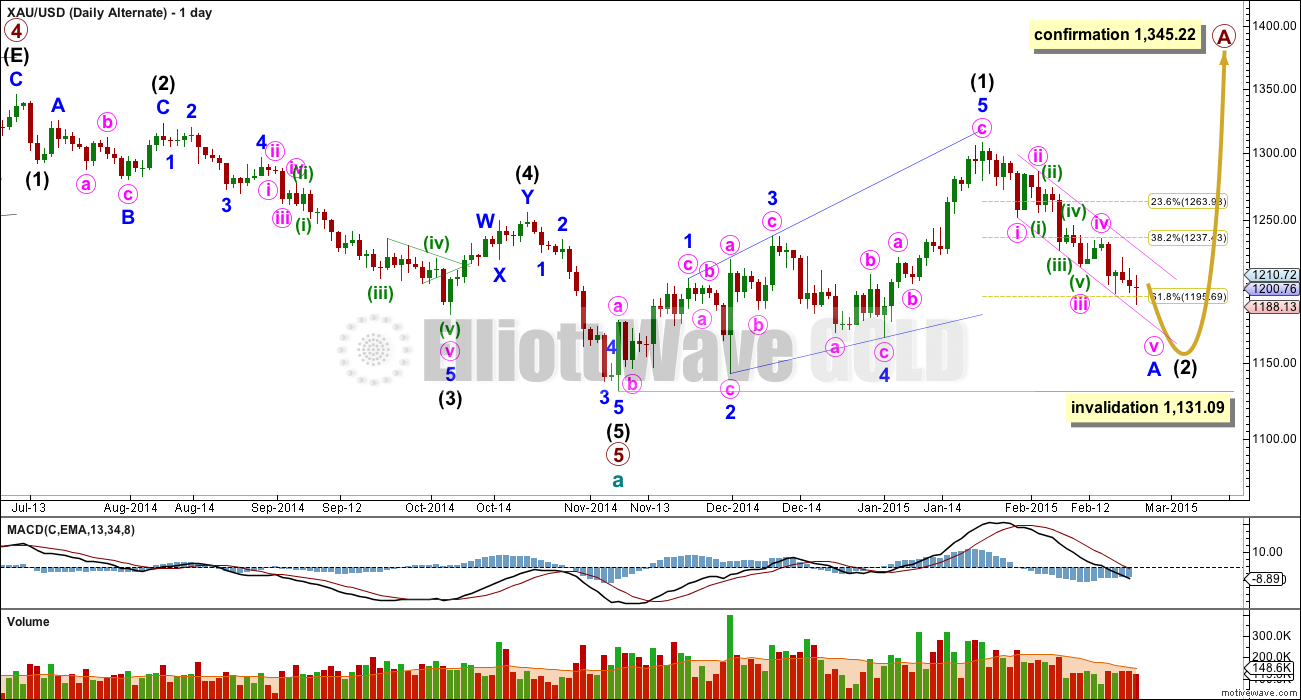
At this stage I judge this alternate wave count to have a lower probability. The structure of downwards movement, and momentum, will determine which wave count is correct over the next few weeks. At this stage they both expect more downwards movement so there is no divergence in the expected direction.
This wave count sees a five wave impulse down for cycle wave a complete, and primary wave 5 within it a completed five wave impulse. The new upwards trend at cycle degree should last one to several years and must begin on the daily chart with a clear five up.
The first five up may be a complete leading expanding diagonal. Within leading diagonals the second and fourth waves must subdivide as zigzags. The first, third and fifth waves are most commonly zigzags but they may also be impulses. This wave count sees minor waves 1, 3 and 5 as zigzags.
Leading diagonals are almost always followed by deep second wave corrections, sometimes deeper than the 0.618 Fibonacci ratio. This wave count expects a big deep correction downwards, and it should subdivide as a clear three on the daily chart.
My biggest problem with this wave count is the structure of intermediate wave (2) within primary wave 5. This is a rare running flat but the subdivisions don’t fit well. Minor wave C should be a five wave structure, but it looks like a clear three on the daily chart. If you’re going to label a running flat then it’s vital the subdivisions fit perfectly and this one does not. This problem is very significant.
Within intermediate wave (5) minor wave 3 looks like a three on the daily chart, where it should be a five. This movement may also be labelled with minor wave 3 ending higher and minor wave 5 looking like a three. Either way, one of the actionary waves within this downwards movement will look like a three and not a five which does not have the “right look” at the daily chart level.
Intermediate wave (2) is most likely to subdivide as a zigzag, which subdivides 5-3-5 at minor degree. When this 5-3-5 is complete then how high the following movement goes will tell us which wave count is correct.
Intermediate wave (2) of this new cycle degree trend may not move beyond the start of intermediate wave (1) below 1,131.09.
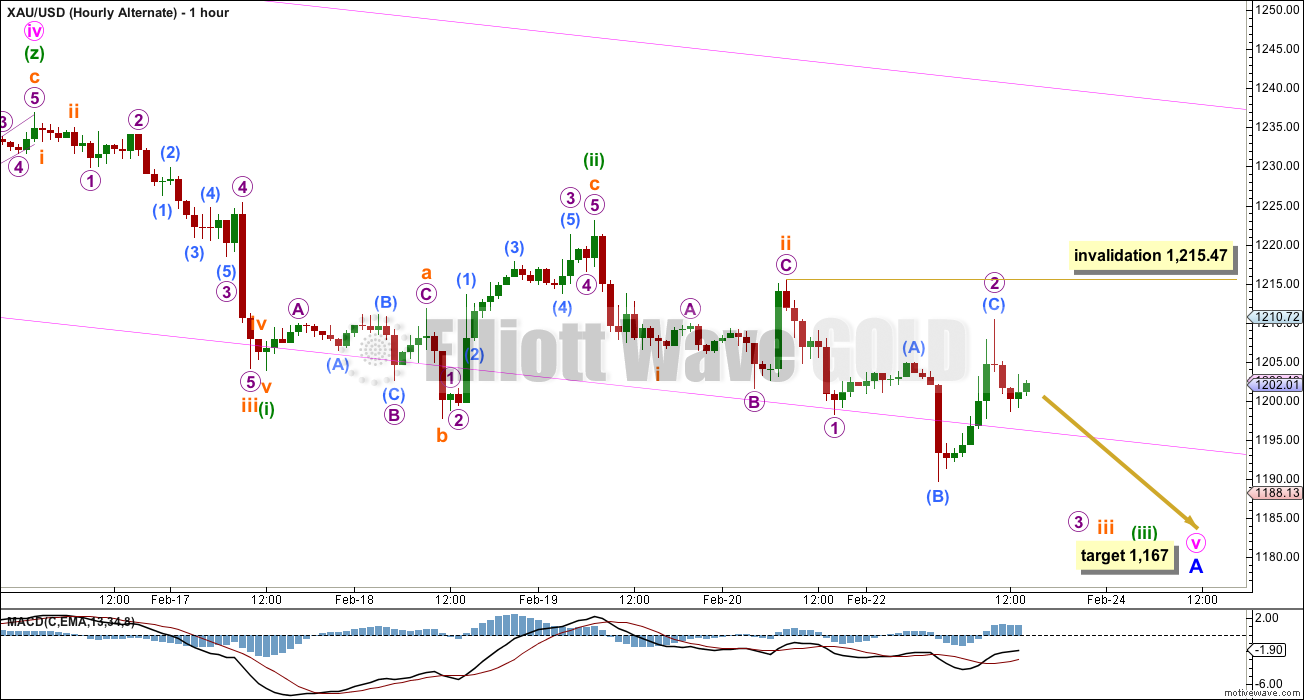
For this wave count minute waves iii and iv should be over. If minute wave iii was incomplete as labelled for the main hourly wave count this would take minor wave A too low, and would not allow enough room for the zigzag of intermediate wave (2) to unfold.
If minute waves iii and iv are complete then there is inadequate alternation between the 0.61 double zigzag of minute wave ii and the 0.29 triple zigzag of minute wave iv. That they are both of the zigzag family would be unusual for Gold.
My first idea was to see if minute wave v is subdividing as an ending contracting diagonal, but the third wave zigzag will not fit at all. Minute wave v must be subdividing as an impulse, and it is beginning with a series of overlapping first and second waves. This alternate also expects to see an increase in downwards momentum. At 1,167 minute wave v would reach equality in length with minute wave iii.
Within subminuette wave iii micro wave 2 may not move beyond the start of micro wave 1 above 1,215.47.
This analysis is published about 02:50 p.m. EST.
Play it safe and exit…
Keep a tight SL just in case…
I like to call it before it happens, not after it happens…
Finally got in. I don’t see anything spectacular on chart but clearly bears are in control. If it is about to fall further I don’t want to miss it.
Gold just hit upper trend line for 10 and 15 minute for pmbull
http://www.pmbull.com/gold-price/
Actually at upper trend line for all times 1 through 15 minutes.
http://www.pmbull.com/gold-price/
By the way it is reasurring that Lara said,
7 sessions to 1,124.
Still opportunities to day trade each day on the way down if you have the time to watch closely.
hanging in for another bounce back…
Any feedback?
In and out of 3xPM etf is taxing unless one enjoys it. These etf’s are known to have huge price decay. It is like a fish longer you keep it more it stinks.
How to take advantage of 3x daily PM etf’s decay in price??
Buy long term PUT option of opposite to the major trend 3x etf. If PM is in bear trend buy PUT option in Bull etf.NUGT . 2014 review of data shows huge profit in option.
March 17 Dec 31 strike Dec 3 March 17 P/L
Price Price Price Price Price
Option Option
GDX 27.5 18.38 22.5 4.40 3 + 1.4
NUGT 57 11 50 38.3 3 +35
Disclaimer I have NUGTJun 19 2015 15 PUT option.
I just got into DUST at 14.97, might have to get out ….
We’ve hit resistance, 1185 now…
Lara’s yesterday’s fabulous report targeting gold $1124-
Bot GLD vertical call spread.
Sell June 19 2015 113 Call and buy 118 Call at credit $2.35.
Gld going down to lower by June spread will be less than $1.
Just out of curiosity, what platform do you use?
No I do not use any trading platform. Just use my broker TDA..
Correction to text and chart for main hourly wave count. Upper invalidation should be the same as on the alternate hourly text and chart.
1,215.47 instead of 1,215.07.
Within micro wave 3 submicro wave (2) may not move beyond the start of submicro wave (1) above 1,215.07. (Should be 1,215.47 on main hourly)
You’re right, sorry for that mistake Richard. Fixed now
Hi. JUST A VIEW: Looks like Gold price already made it’s high at 1204-05 with 1210-12 seen as limiting,…. Downside risk comes in at 1185-76 with a break below 1192-91…. 20dma is dropping which should add downside pressure with 100dma acting as the ceiling. Good luck all and may it be profitable!
Wow, bounced off 91! Maybe next time we will break thru!
Interesting setup for trading gold.
Gold Day Trader Shares His Trading Secret
“It does not matter what your specialty is for trading is we all have
our own little trading secrets to help use better time our trades.
While many day traders focus on individual stocks like aapl, goog, tsla
etc… I like to focus on day trading gold……………
Read more…..
http://www.kitco.com/ind/Vermeulen/2015-02-23-Gold-Day-Trader-Shares-His-Trading-Secret.html
Lara, I appreciate your including brief comments on silver and gdx. I understand gdx analysis may not be reliable but silver (and to lesser extent gdx) provides context for gold.
Lara, do you have a time table prediction on your new main wave count?
Seven sessions to 1,124 if minuette wave (iii) completes in a Fibonacci 13 sessions.
My apologies to members, our video hosting service has issues today and I’m having difficulty uploading today’s video. It will be delayed.
Bought back into DUST in last half hour, after earlier profit taking. Hourly charts look good for downward momentum for gold.
Will watch Tuesday if any news of any problems with Greece proposal to Euro group Tuesday or news Tuesday or Wednesday on any Janet Yellen comments during 2 day meeting with Congress that might include US interest rates that could effect gold down trend.
Richard, your approach (looking for info that could effect gold down trend) may be entirely correct, but isn’t this opposite of EW concept which says waves (in this case gold) cause human reaction which is opposite of humans (Janet Yellen, Greece) causing market reaction? Or something like that–I may not be using correct terminology.
It is interesting to note many EW practitioners on this forum seem to ignore this core EW concept.
Anyone comment on this disconnect?
I think the EWP states that it is social mood which causes market movement. Social mood is reflected in markets.
So no, it’s not that the market causes a human reaction. It’s the other way around. It is human mood as a group (social mood) which causes market behaviour.
Which is the opposite to conventional wisdom. For example, the news will often state that a political decision caused markets to fall or rise. EW theory flips this around. EW theory states the market movement is a reflection of social mood, and it is that social mood which decides political decisions.
It’s actually slightly complicated and slightly difficult to get your head around.
Of course you are right Lara.
I know it is sentiment /social mood that steers gold. DSI Daily Sentiment Index, the index that measures the bullish percentage on gold. i.e. it may vary from extremes of 4% bullish (a bear bottom) to 97% bullish (a bull top) on gold.
I will see how the social mood / sentiment moves gold if any big news on Greece or Janet Yellen and interest rates comes out in the next two days. News may come in a down wave or a retracing up wave. I just want to be ready to optimize my position along the way if needed. News won’t change the short term target, however it can change the daily target. I don’t want to earn profits one day then end up in a loss the next day while holding DUST.
November 7th, 2014 was recent low in gold. DSI Daily Sentiment Index was at an extremely low in bullish sentiment. So if you knew it was at an extreme low it would be an incredible time to buy instead of waiting due to fear or for a lower price.
9:05pm 7th November 2014 (GOLD text with Buy recommendation due to only 3% DSI as mentioned in the text under the gold chart, the guy was right as November 7, 2014 was low in gold since April 15th, 2010.)
The DSI last week reached a record low bullish reading of only 3%. For every bull, there were thirty-three bears! Just ponder than little ship with 33 on the starboard and only 3 on the port side. The list to starboard is very dangerous and is in danger of capsizing the craft.
http://bit.ly/1LARVIY
See attached Silver chart with some extreme highs and lows in DSI.
Silver – October 6 , 2014 (EWI) Mentions a 27-year extreme in the 21-day Daily Sentiment Index
http://bit.ly/1LAQxWE
Thanks for explanation.
I personally believe EW reveals the energy vibrations of society, the quantum fields underlying in groups of people that drive unconscious behaviors.
EW plots the sentiment/herd effect and plots out the movement of gold based on the herd effect moving in waves into or out of gold.
Daily Sentiment Index, DSI – the index that measures the bullish percentage on gold. Friday February 20th DSI for gold was 21.0%
The Daily Sentiment Index based upon %BULLS polled as of Feb 20th (Friday’s Close):
http://www.tag618.com/
The DSI or Daily Sentiment Index is a proprietary sentiment indicator from MBH Commodities in Chicago.
http://www.trade-futures.com/dailyindex.php
When DSI is at extremes like in the high 90 percent bullish like 95% or single digit like 5% bullish in gold then gold is at a major top or bottom and about to change direction.
MTLSD- well said, I agree.
Lara’s service and her excellent EW analysis has increased my confidence in trading PM sector otherwise a difficult without any road map. harts alone has not been so friendly.
Many thanks to Lara.
I didn’t catch when and at what price you sold for profit …
I looked back at the previous posts and I could not find the moment when you got out . I see where you bought but not where you took profit . Just sayin .
Friday bought DUST near close at $14.83 then sold Monday for 15.12 at 9:33 am. Not best timing but made profit.
Monday bought DUST for 14.75 at 9:53 am, sold for 15.16 at 2:00 pm for profit.
Monday bought DUST 3:12 pm for 14.94 and 3:42 pm for 14.89. Now I wait to sell DUST Tuesday for a profit and wait for DUST to drop intraday and buy DUST again.