Downwards movement and an increase in momentum were expected. Price remains within the lower half of the channel on the hourly chart, but has not managed to make a new low.
Summary: I still expect a third wave down is unfolding. The target for it to end is 1,124. The alternate wave count has a lower probability, and it sees a fifth wave down unfolding with a target at 1,167. Both Elliott wave counts expect to see an increase in downwards momentum over the next few days.
Click on charts to enlarge.
Main Daily Wave Count
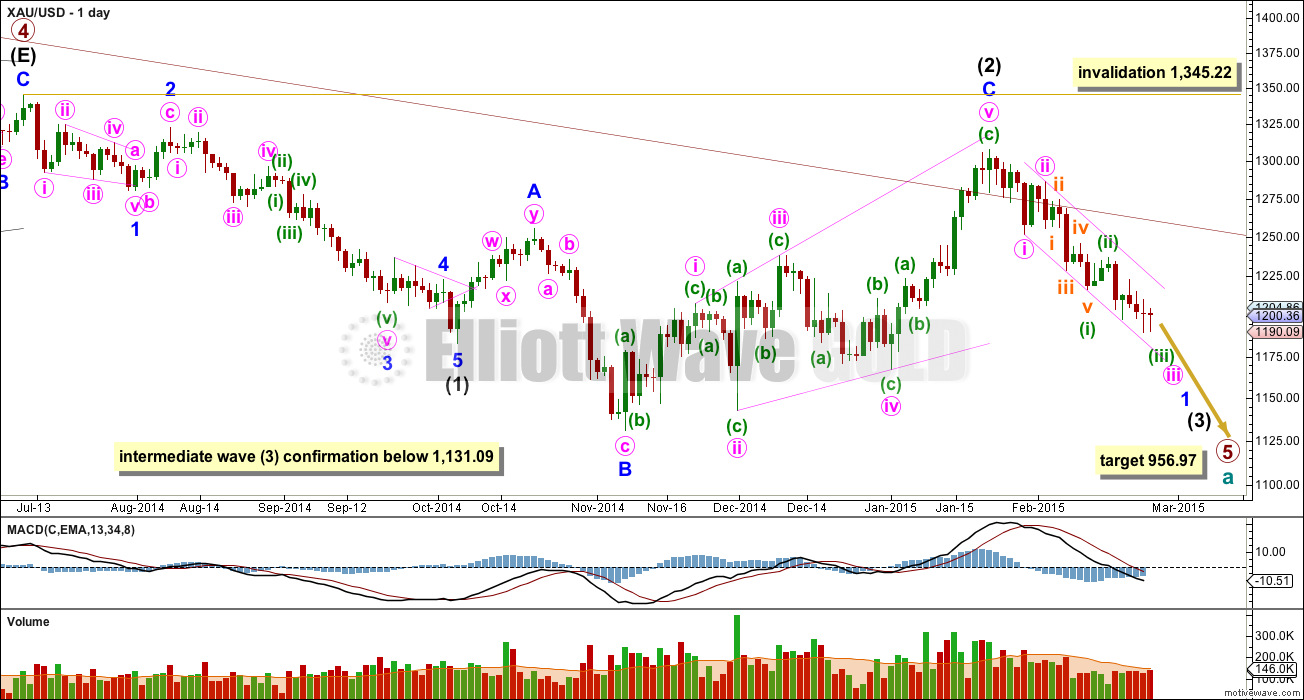
This main wave count sees Gold as still within a primary degree downwards trend, and within primary wave 5 intermediate wave (3) is in its early stages. At 956.97 primary wave 5 would reach equality in length with primary wave 1. For Silver and GDX this idea, that the primary trend is down, is the only remaining wave count. This main wave count has a higher probability than the alternate below.
The maroon channel about cycle wave a from the weekly chart is now breached by a few daily candlesticks and one weekly candlestick. If cycle wave a is incomplete this channel should not be breached. The breach of this channel is a warning this wave count may be wrong, and so I will still retain the alternate.
Draw the maroon trend line on a weekly chart on a semi-log scale, and copy it over to a daily chart also on a semi-log scale (see this analysis for a weekly chart).
Within primary wave 5 intermediate wave (1) fits perfectly as an impulse. There is perfect alternation within intermediate wave (1): minor wave 2 is a deep zigzag lasting a Fibonacci five days and minor wave 4 is a shallow triangle lasting a Fibonacci eight days, 1.618 the duration of minor wave 2. Minor wave 3 is 9.65 longer than 1.618 the length of minor wave 1, and minor wave 5 is just 0.51 short of 0.618 the length of minor wave 1.
Intermediate wave (2) is an expanded flat correction. Minor wave C is a complete expanding ending diagonal. Within an ending diagonal all the sub waves must subdivide as zigzags. The fourth wave should overlap first wave price territory. Expanded flats are very common structures and ending diagonals are more common than leading diagonals.
This wave count has more common structures than the alternate wave count, and it has a better fit.
A new low below 1,131.09 would confirm that a third wave down is underway.
Intermediate wave (2) may not move beyond the start of intermediate wave (1) above 1,345.22. If this invalidation point is passed this wave count would be fully invalidated.
Draw a channel about minor wave 1: draw the first trend line from the end of minute wave i to the end of minuette wave (iii), then place a parallel copy on the end of minute wave ii. Copy this over to the hourly chart.
From January 23rd onwards, since the expected trend change, volume is highest on down days. This supports the idea that we may have seen a trend change and the trend is now down. Volume for Silver is even clearer, with a big spike on the down day there for 29th January.
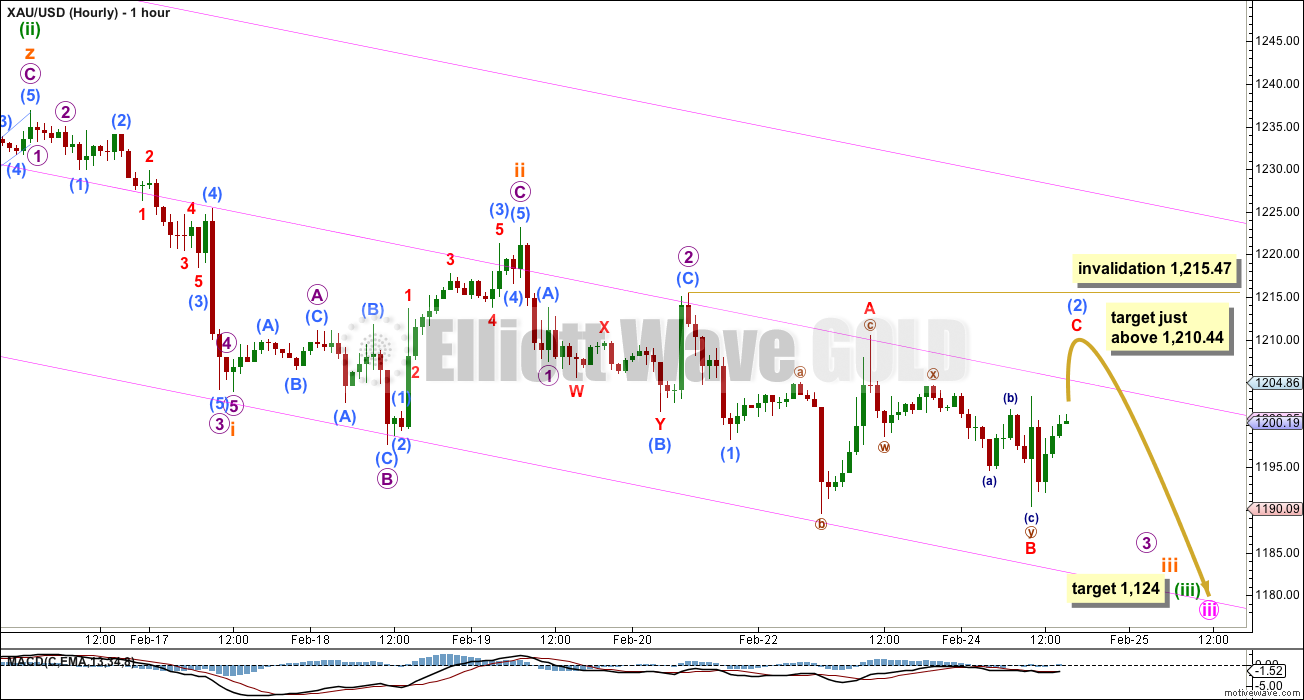
Within minute wave iii minuette waves (i) and (ii) are complete. At 1,124 minuette wave (iii) would reach 1.618 the length of minuette wave (i).
Minuette wave (i) lasted 6 days. If minuette wave (iii) completes in a Fibonacci 13 days it may end in another seven sessions.
Minuette wave (ii) shows up on the daily chart, and it lasts three days. For the wave count to have the right look at the daily chart level minuette wave (iv) should also show up on the daily chart. The next interruption to the downwards trend should come at the end of minuette wave (iii).
I have tried to see if a diagonal, either leading or ending, may be unfolding. The subdivisions still do not fit. So despite downwards momentum not yet increasing I can only see this structure as an unfolding impulse. Downwards movement is too deep now to be a continuation of minuette wave (ii). I still come to the conclusion that this must be the early stages of minuette wave (iii).
The last downwards movement labelled here minuscule wave B does not fit at all as a five wave structure. This fits as a three, and so micro wave 2 is likely an incomplete flat correction. It is very likely that minuscule wave C would move at least slightly above 1,210.44 to avoid a truncation and a rare running flat, but in this instance I would accept a running flat if the strong downwards pull of the middle of this third wave forces it. The mid line of the parallel channel may also provide resistance forcing a running flat. Or not.
When submicro wave (2) is a complete structure I would expect to see strong downwards movement for the middle of a third wave.
The channel drawn here is copied over from the daily chart and it seems to be a good guide to where price is finding support and resistance. The mid line is a useful addition. If this wave count is correct then when the middle of the third wave gathers momentum the lower edge of the channel should be breached and price should then stay below it.
Submicro wave (2) may not move beyond the start of submicro wave (1) above 1,215.07.
Alternate Daily Wave Count
At this stage I judge this alternate wave count to have a lower probability. The structure of downwards movement, and momentum, will determine which wave count is correct over the next few weeks. At this stage they both expect more downwards movement so there is no divergence in the expected direction.
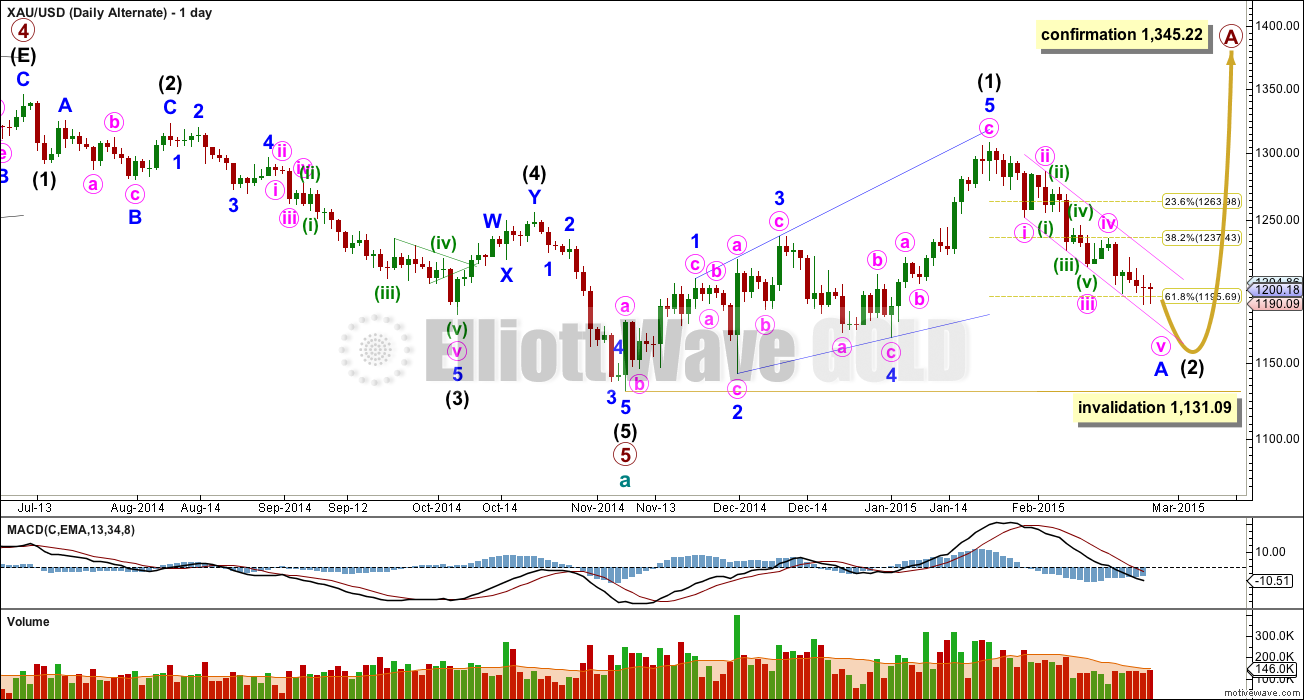
This wave count sees a five wave impulse down for cycle wave a complete, and primary wave 5 within it a completed five wave impulse. The new upwards trend at cycle degree should last one to several years and must begin on the daily chart with a clear five up.
The first five up may be a complete leading expanding diagonal. Within leading diagonals the second and fourth waves must subdivide as zigzags. The first, third and fifth waves are most commonly zigzags but they may also be impulses. This wave count sees minor waves 1, 3 and 5 as zigzags.
Leading diagonals are almost always followed by deep second wave corrections, sometimes deeper than the 0.618 Fibonacci ratio. This wave count expects a big deep correction downwards, and it should subdivide as a clear three on the daily chart.
My biggest problem with this wave count is the structure of intermediate wave (2) within primary wave 5. This is a rare running flat but the subdivisions don’t fit well. Minor wave C should be a five wave structure, but it looks like a clear three on the daily chart. If you’re going to label a running flat then it’s vital the subdivisions fit perfectly and this one does not. This problem is very significant.
Within intermediate wave (5) minor wave 3 looks like a three on the daily chart, where it should be a five. This movement may also be labelled with minor wave 3 ending higher and minor wave 5 looking like a three. Either way, one of the actionary waves within this downwards movement will look like a three and not a five which does not have the “right look” at the daily chart level.
Intermediate wave (2) is most likely to subdivide as a zigzag, which subdivides 5-3-5 at minor degree. When this 5-3-5 is complete then how high the following movement goes will tell us which wave count is correct.
Intermediate wave (2) of this new cycle degree trend may not move beyond the start of intermediate wave (1) below 1,131.09.
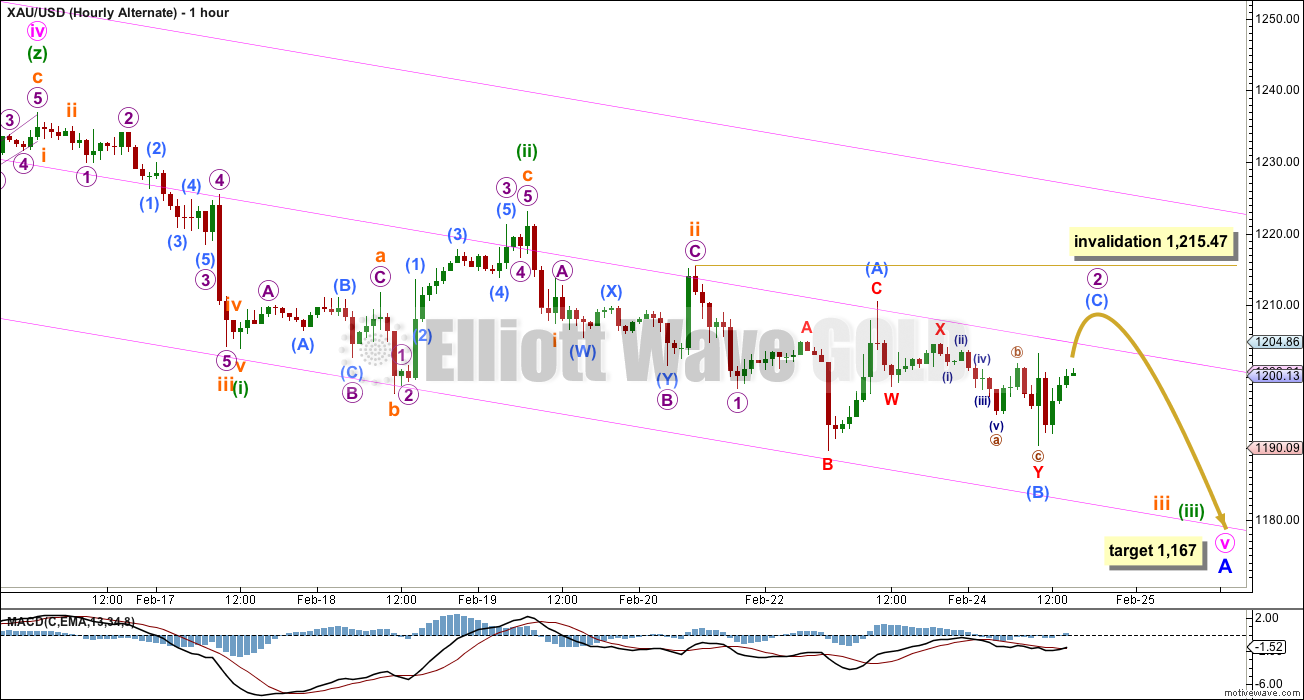
Minute wave iii for this alternate should be over, if it were to extend price would move below the invalidation point on the daily chart. This gives inadequate alternation between the deep 0.61 double zigzag of minute wave ii and the shallow 0.29 triple zigzag of minute wave iv.
It should be noted that this idea also works for the main wave count; there, minute waves iii and iv could also be complete. This has a lower probability due to the lack of alternation. Minute wave iii would also be shorter than 1.618 the length of minute wave i (normally third waves are longer).
At 1,167 minute wave v would reach equality in length with minute wave iii.
Micro wave 2 may not move beyond the start of micro wave 1 above 1,215.47.
This analysis is published about 04:15 p.m. EST.


that’s to be expected for a second wave correction, it looks typical
Lara would this be correct and gold likely to drop?
Overnight 1 am high of 1,211.95 minus 1 pm low of 1,201.17 = 10.78 x .618 = 6.662 subtract that from 1,211.95 = 1,205.29 retrace of .618
1,205.27 reached at 3:22 pm
If my calculations are correct than gold may descend from here.
The next days analysis is out and it answers your question.
UP AND AWAY FROM HERE, GAP AND GO IN THE AM in wave 1 of C of 2
Lara,
if you’re going change your wave count radically to gold moving up from here, please post it early…
Ty,
done
Isn’t Lara’s main wave count in effect? It’s already supposed to go down…
Scott
Lara is clear about this wave iii:”If this wave count is correct then when the middle of the third wave
gathers momentum the lower edge of the channel should be breached and
price should then stay below it.”
Gold needs to be below 1198.
Give it some time….
Lara , does the fact that Gold made a new low yesterday provide any new alternate wave counts ? If not I might try to get in with this downtrend today . Just a small nibble .
Lara, please need your analysis before close and I believe many will adjust their holdings if DUST and JDST are still very cheap today. DUST dropped $1.00 from $14.99 to 14.00 now.
I just bought more DUST at $14.14. Once “third wave down gathers momentum” then miners will plummet and DUST may move up fast.
I for one don’t think it’s happening. Been long since mid day yesterday but quite nervous about it.
It may happen once middle pink channel line is breached. It broke today and did not stay below it.
Good thought, papudi. I, for one, hope we get below it!
It’s a tough call. I am seeing lots of positive divergence on the intraday charts. Plus this downtrend is long in the tooth, and may be losing momentum near the .618 level of the entire previous move up. Miners have been fairly resilient and they often lead. Plus there’s a nice double bottom right around 1190 and a pop back up over 1200. However, like Lara i don’t see an easy way to count a complete structure downwards. So it’s really a tough call. I’m staying long
Here is a suggestion for a downward count (done off a daily stockcharts chart). Zigzag 1307.80 on 22jan to 1252.10 on 29jan, then triangle to 5feb, then zigzag down with the zig completing in one day. Wave 3 of the zag would be the longest bar which is 17feb. Sorru I do not have capability to draw this properly.
Be patient. Lara’s main wave daily and hourly wave count still are down as nothing invalidated. When gold moved up to “slightly above 1210.44” it would not drop fast instantly it gradually descends in EW patterns that take some time.
I would not be long especially after today’s close. Today appears to be an up day so far for the miners but I would expect gold to drop more before end of today if not before the close.
I expect miners to drop and if not before than maybe just before the close as gold trend during market hours is down.
Nice close on the miners, down for the day, but I like that they gave up 1% in the last few minutes.
Gold just dropped $2 in 1 minute and broke through a few lower trend lines of this morning from 15, 10, 5, 3, 2, and 1 minute.
The $1,200 price magnet for gold is very strong and already pulling gold down.
Gold is already under the upper trend line on http://www.pmbull.com for 1 hour and 30 minutes.
Gold is already trending under the lower trend line for 15, 5, 3, 2 and 1 minute.
The third wave is also pulling gold down.
Lara, “When submicro wave (2) is a complete structure I would expect to see strong downwards movement for the middle of a third wave. …
If this wave count is correct then when the middle of the third wave gathers momentum the lower edge of the channel should be breached and price should then stay below it.”
By the channel in hour chart gold has breached the channel.
The .618 of move up from 1190.61 2/24 10:00 am to 1211.95 2/25 1:45 am this morning would bring gold back down to 1198.76 maybe today.
3X bear ETFs were going down this morning, while gold was going down because the miners were still adjusting to the higher gold price with their momentum going up and had lost the down momentum/sentiment of yesterday.
Nothing was invalidated last night as high was 1211.95 and invalidation was 1215.47
Oil edged up today which does boost gold.
http://www.marketwatch.com/story/oil-futures-keep-a-wary-eye-out-for-us-inventory-data-2015-02-25
pmbull daily chart shows gold was due for a bounce as had 3 days down versus the pattern of two.
Gold already retraced .618 overnight 1211.95 of the drop from 1223.08 2/19 7:15 am down to 1190.61 2/24 10:00 am
I have found that up day corrections may last all day so maybe a good idea to wait for Lara update unless can’t resist super low prices might want to buy a little before then?
Richard, well thought-out analysis. Thanks.
Will require a break of recent lows to get into the green for DUST/JDST today. Not ruling this out, but it will need to move sooner rather than later.
$7 move up in gold = 7% decline in DUST.
Hoping that this equation is repeated on the journey south! Obscene move by miners.
Once the miners are convinced that gold will move below 1198/1200 DUST will move back up just as fast I believe…
hmmm, we will find out soon.
Trendlines and their breaks/retests are usually acknowledged as the oldest and most reliable Technical Analysis we have. Does EW or anyone here give weight to today’s trendline break (FEB ONLY) in ALL of the following: GOLD, GLD, GDX, NUGT, DUST, XAU, HUI…??? (my position: CASH)
I don’t see that any major trendlines were broken. Where does your trendline begin?
This minor downtrenline is Feb 3 peak to Feb 19 peak on GOLD…Similar, but not always same, dates for the others. In other words the little downtrend from the peak on Jan 22. This NOT a Lara trendline.
Ok, I see what you mean. So far this is an intra-day breach. If gold closes back below it would be void.
You’re absolutely right. On the daily chart of GOLD it’s currently an inverted hammer which could be a great short signal….on the other hand the MINERS…GDX..XAU..HUI…are showing a gap up and a clear green candle…
That’s what makes a market…
YOU PAYS YOUR MONEY and
YOU TAKES YOUR CHANCES…
good luck to all..
Trendline break you refer to was up (above trendline) or down (below trendline) ?
I think he must be talking about the middle channel line which is in Lara’s chart . Down-sloping hourly trendline …
I can see another one connecting tops of Minute II to Minuette II and Subminuette ii
It will be nice if Lara can select grid line for her hour chart for easy monitoring.
Lara is that or a variation of that possible as per papudi request?
Oil starting a nice run.
I am thinking today will be pretty quiet. Tomorrow is the initial jobless claims, and Friday is GDP, both of those could be ‘events’ to trigger the next extensions down.
or up
You guys are right. Gold appeared to have topped, and is now declining. But, quite weirdly, DUST seems to move in the opposite direction.
So far daily candlestick looks very bearish.
If candle closes like this…….its inverted hammer and it can take gold higher
but plenty of time left in daily closing
Yes, but so far bearish ETFs still going down too! (JDST -6%)
Bought more DUST this morning while it was cheaper. Keeping the faith in Lara and EW.
There is a strong possibilitty gold is going higher. In hour gold is forming HnS with head at double bottom 1190 and neck line at 1215. Right where Lara says invalidation. HnS conforms to wave counts well.
If gold does not hold 1211 watch out.
Hi Lara, in the daily chart MACD is coming close to zero. Is there any significance to change from downward trend to upward trend
Gold is now at 1206. Price went higher than 1210.44. Turn out to be a flat.
Now hope it works like Lara expects: “When submicro wave (2) is a complete structure I would expect to see strong downwards movement for the middle of a third wave”
Need to see Gold price start to coast below 1207 and take down 1201/pivot 1198 for downside 1193-90….
Gold already exceeded the 1210.44 C (2) target at 1:04 am and now has to stay below 1215.47.
Hi. 1192-90 seems to have this floored with 1212-13 appears to have this curtailed, a break above would open up 1225-26 risk notwithstanding 100dma (1215-16) / invalidation level curtailing this earlier….. I remain on the short side with sells.
At 8:16 EST PM gold is at 1209 & about to breach 1210. The way it gold rose feels by morning gold will be much higher than invalidation pt 1215.
Be patient….shorts will enter soon.
Trust in Lara
Yes I do . Lara spoke of once gold reaches 1210 and completes micro wave c and (2) pull of wave iii will increase downward momentum.
I guess when London opens shorts will enter then.
For all the PM shorts- here is alt wave count from a web????
Appears counting on expanded wave c back to 1327. Is it possible????
Mine shows new low at 1190 occurred as well. Does a new low change the wave count?
Lara, not sure what you meant by no new low for gold. From what I can see, a new low came at 10 am EST.
Looks like depends on data feed . On forex.com I also see new low but on Netdania charts no new low was made . Same with Lara’s charts , no new low . I assume Lara’s data is more accurate .
yeah, different data feeds have slightly different data
I’m using the FXCM data feed
I’m hoping it’s more accurate, but I have no idea.
It is widely acknowledged on news sites that gold hit a new 7 week low on Tuesday eastern time.
Lara: after looking at this more closely, it is not that the low that you recorded for today was off but rather the low from yesterday may be too low. Depending on the data feed, yesterday’s low was in the 1190-91 range. Seems that you recorded 1188.13.
All of this doesn’t really matter if it has no bearing on today’s wave count. If there is a change, please advise. Thanks.
on http://www.pmbull.com/gold-price/ gold did make low at 1190.61 at 10 EST trading hour on hour chart.
New analysis out analysis is published about 04:15 p.m. EST.
Didn’t get email yet.
Hi Richard
I think many people have tried to tell you it is more useful if you post this comment on the last analysis. As people will be looking at the last analysis waiting for the new update.
We only see your comment once we have discovered that a new post is out. Hope you know what I mean.
Thanks