
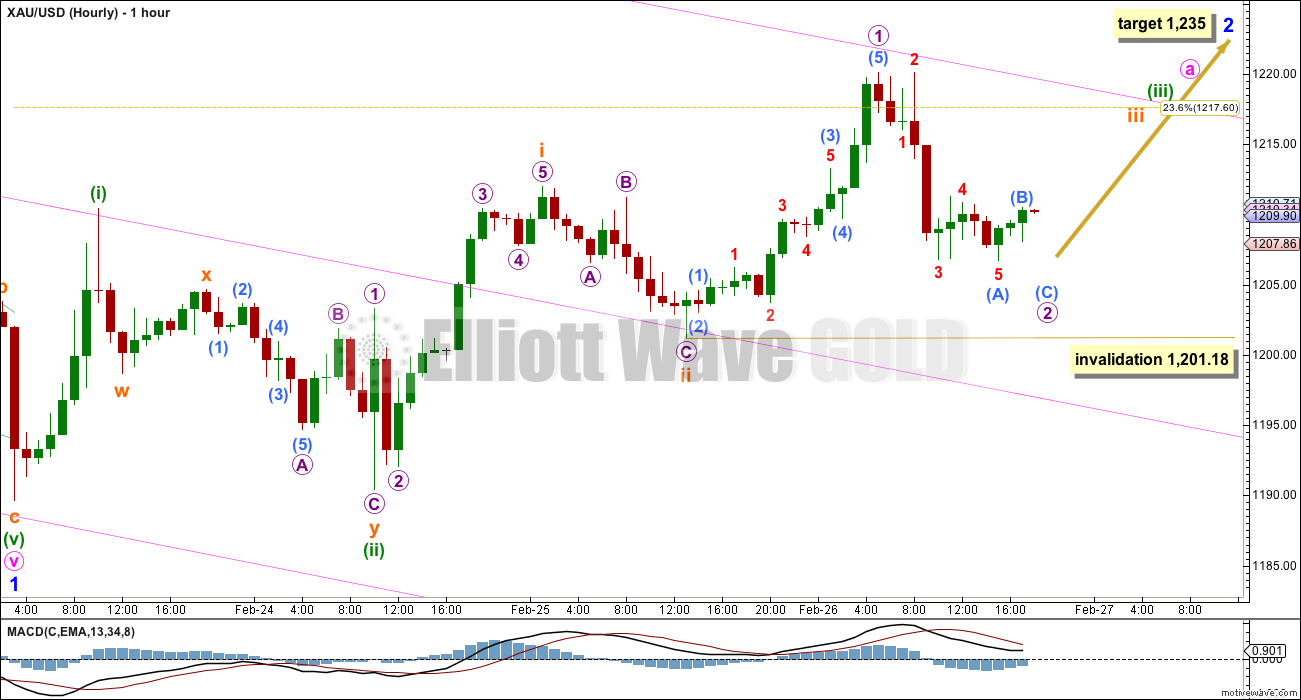
A new high above 1,211.96 invalidated the main hourly Elliott wave count and confirmed the alternate.
Summary: I expect choppy overlapping movement for about five more days (including Friday’s session) to either 1,235 or 1,263, favouring the lower target.
Click on charts to enlarge.
Main Daily Wave Count
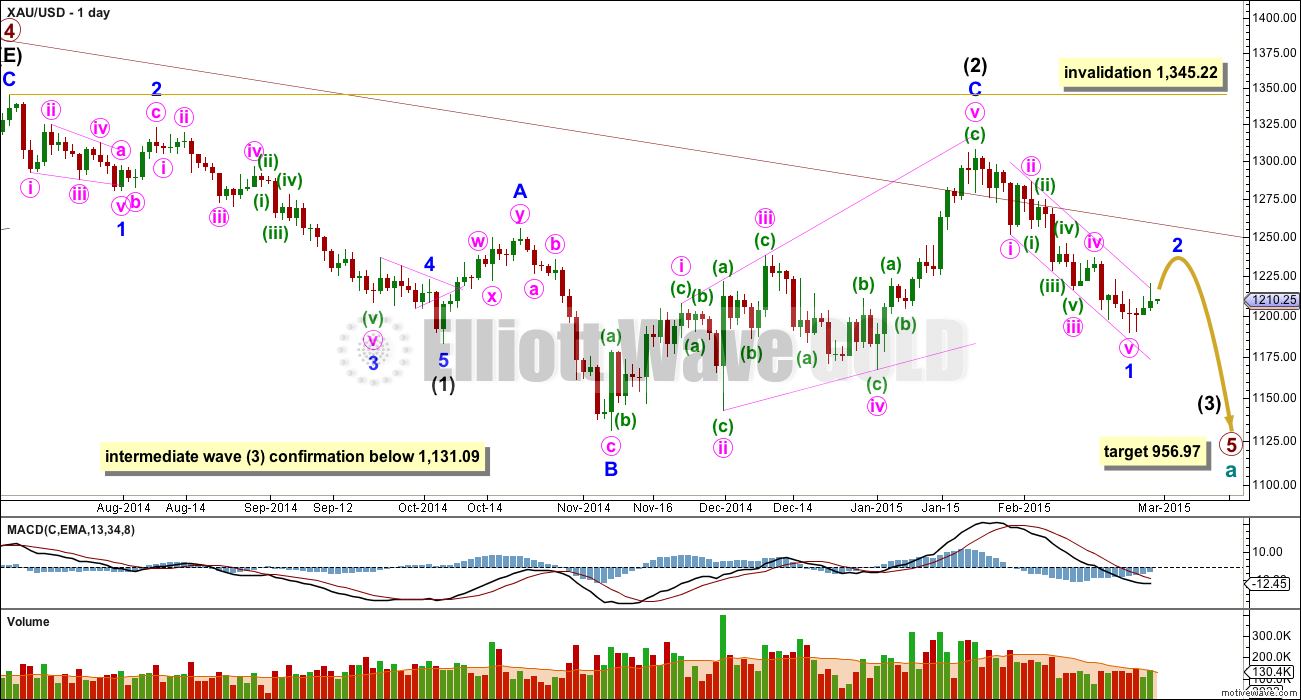
This main wave count sees Gold as still within a primary degree downwards trend, and within primary wave 5 intermediate wave (3) is in its early stages. At 956.97 primary wave 5 would reach equality in length with primary wave 1. For Silver and GDX this idea, that the primary trend is down, is the only remaining wave count. This main wave count has a higher probability than the alternate below.
The maroon channel about cycle wave a from the weekly chart is now breached by a few daily candlesticks and one weekly candlestick. If cycle wave a is incomplete this channel should not be breached. The breach of this channel is a warning this wave count may be wrong, and so I will still retain the alternate.
Draw the maroon trend line on a weekly chart on a semi-log scale, and copy it over to a daily chart also on a semi-log scale (see this analysis for a weekly chart).
Within primary wave 5 intermediate wave (1) fits perfectly as an impulse. There is perfect alternation within intermediate wave (1): minor wave 2 is a deep zigzag lasting a Fibonacci five days and minor wave 4 is a shallow triangle lasting a Fibonacci eight days, 1.618 the duration of minor wave 2. Minor wave 3 is 9.65 longer than 1.618 the length of minor wave 1, and minor wave 5 is just 0.51 short of 0.618 the length of minor wave 1.
Intermediate wave (2) is an expanded flat correction. Minor wave C is a complete expanding ending diagonal. Within an ending diagonal all the sub waves must subdivide as zigzags. The fourth wave should overlap first wave price territory. Expanded flats are very common structures and ending diagonals are more common than leading diagonals.
This wave count has more common structures than the alternate wave count, and it has a better fit.
A new low below 1,131.09 would confirm that a third wave down is underway.
Intermediate wave (2) may not move beyond the start of intermediate wave (1) above 1,345.22. If this invalidation point is passed this wave count would be fully invalidated.
Draw a channel about minor wave 1: draw the first trend line from the end of minute wave i to the end of minuette wave (iii), then place a parallel copy on the end of minute wave ii. Copy this over to the hourly chart.
From January 23rd onwards, since the expected trend change, volume is highest on down days. This supports the idea that we may have seen a trend change and the trend is now down. A slight increase in volume for Thursday’s session indicates an upwards correction may have begun.
I would expect minor wave 2 to most likely last a Fibonacci eight days. It has completed three candlesticks and has begun the fourth, so I would expect it to continue for another five days including the candlestick just begun for Friday’s session.
Because this is a second wave correction within a larger third wave at intermediate degree I favour the 0.382 Fibonacci ratio at 1,235. If it does not end there it may end higher about the 0.618 Fibonacci ratio at 1,263.
There are several possible structures minor wave 2 may take, the only structure it may not be is a triangle. If it is a flat or combination then it may include a new low below its start at 1,189.64.
So far the upwards movement for minor wave a may be a series of three overlapping first and second waves. It may also be an almost complete double zigzag as per the alternate hourly wave count below. And this is not a completed leading diagonal, because the wave lengths do not work.
In the short term I expect a small zigzag down to complete micro wave 2. I do not have a target for it because it is not clear that sub micro wave (B) is over yet. Micro wave 2 may not move beyond the start of micro wave 1 below 1,201.18.
The wave count will probably change over the next four days as this correction unfolds and the structure becomes clearer. What I am confident of is I expect choppy overlapping movement, generally trending upwards, for about five more days. When that is done the breakout will be down and will be very strong.
Alternate Daily Wave Count
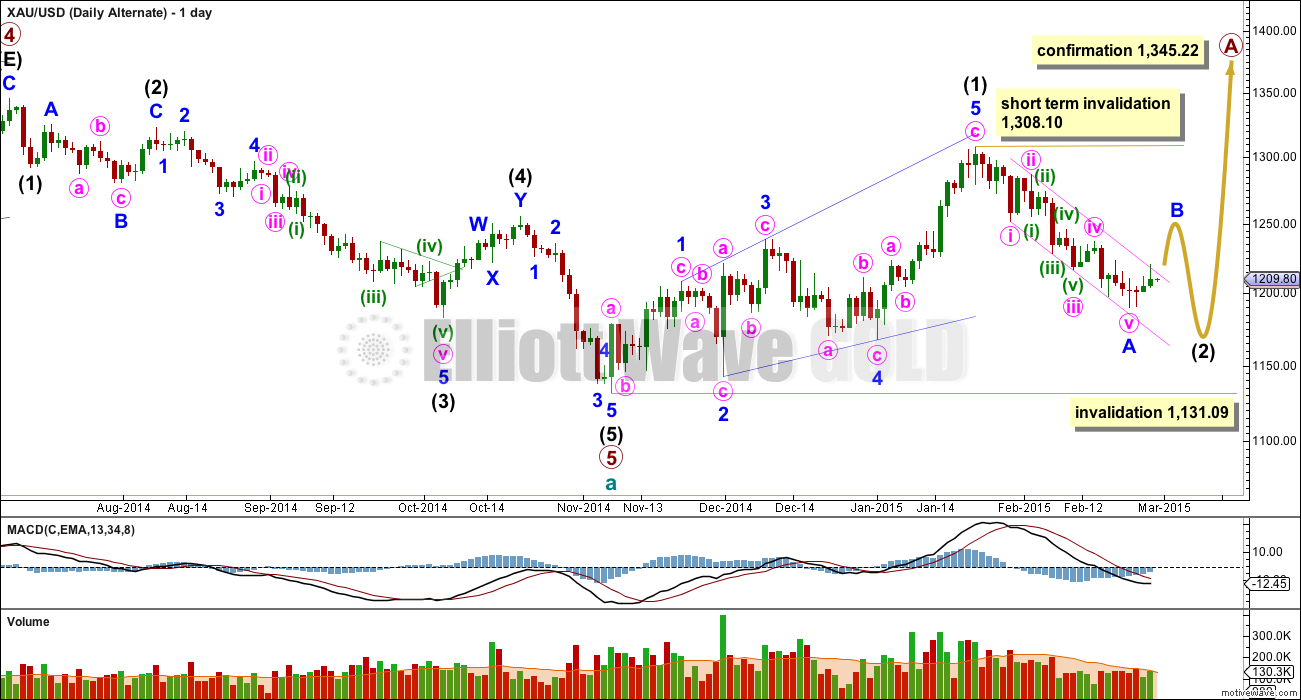
At this stage I judge this alternate wave count to have a lower probability. The structure of downwards movement, and momentum, will determine which wave count is correct over the next few weeks. At this stage they both expect more downwards movement so there is no divergence in the expected direction.
This wave count sees a five wave impulse down for cycle wave a complete, and primary wave 5 within it a completed five wave impulse. The new upwards trend at cycle degree should last one to several years and must begin on the daily chart with a clear five up.
The first five up may be a complete leading expanding diagonal. Within leading diagonals the second and fourth waves must subdivide as zigzags. The first, third and fifth waves are most commonly zigzags but they may also be impulses. This wave count sees minor waves 1, 3 and 5 as zigzags.
Leading diagonals are almost always followed by deep second wave corrections, sometimes deeper than the 0.618 Fibonacci ratio. This wave count expects a big deep correction downwards, and it should subdivide as a clear three on the daily chart.
My biggest problem with this wave count is the structure of intermediate wave (2) within primary wave 5. This is a rare running flat but the subdivisions don’t fit well. Minor wave C should be a five wave structure, but it looks like a clear three on the daily chart. If you’re going to label a running flat then it’s vital the subdivisions fit perfectly and this one does not. This problem is very significant.
Within intermediate wave (5) minor wave 3 looks like a three on the daily chart, where it should be a five. This movement may also be labelled with minor wave 3 ending higher and minor wave 5 looking like a three. Either way, one of the actionary waves within this downwards movement will look like a three and not a five which does not have the “right look” at the daily chart level.
Intermediate wave (2) is most likely to subdivide as a zigzag, which subdivides 5-3-5 at minor degree. When this 5-3-5 is complete then how high the following movement goes will tell us which wave count is correct.
Intermediate wave (2) of this new cycle degree trend may not move beyond the start of intermediate wave (1) below 1,131.09.
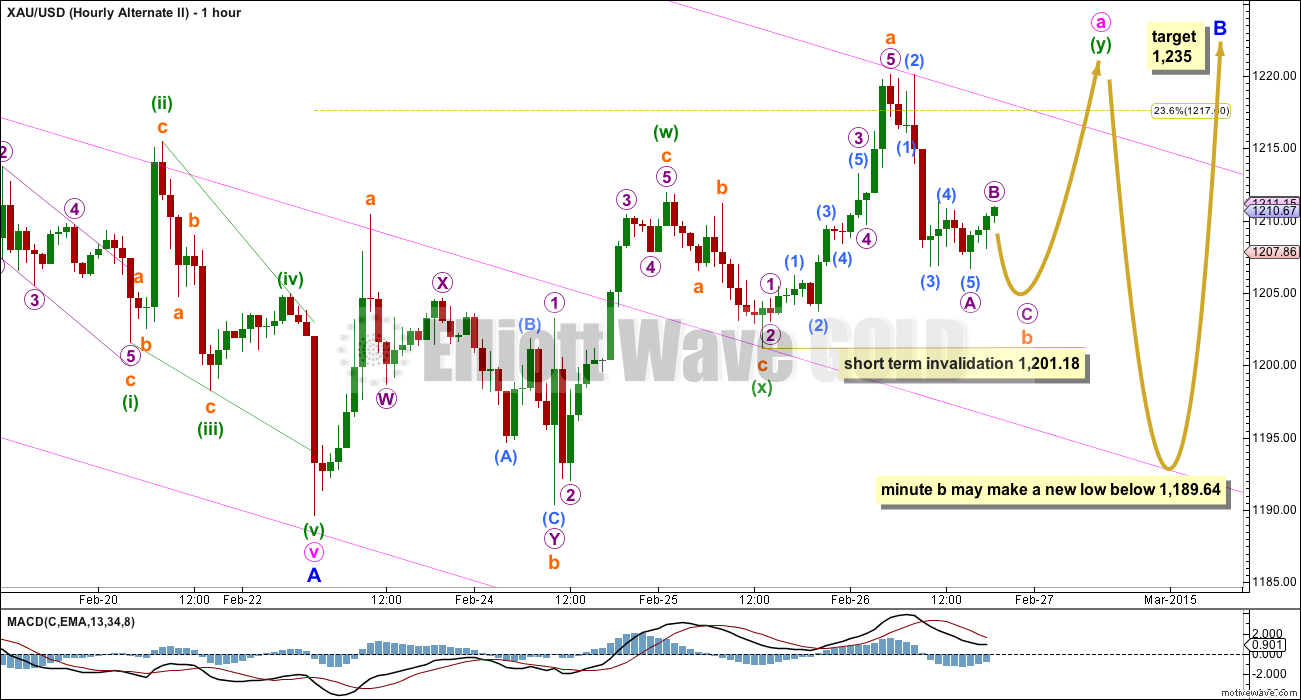
This hourly chart presents another possibility for this unfolding correction, whether it be a second wave or a B wave. This hourly chart works for both the main and alternate wave counts, as does the first hourly chart.
If the correction is unfolding as a flat (or a triangle for this alternate minor wave B) then minute wave a should subdivide as a three. Minute wave a may be a close to complete double zigzag.
If minute wave a subdivides as a three then minute wave b must move price back down 90% of minute wave a or below, and it may make a new low below the start of minute wave a at 1,189.64 as in an expanded flat.
If minute wave a subdivides as a double zigzag then we can eliminate a combination for this correction, because the maximum number of corrective structures within a multiple is three so you cannot have a multiple within a multiple.
In the short term I would expect a zigzag for subminuette wave b to complete, and it may not move beyond the start of subminuette wave a if subminuette wave a is correctly labelled as a five. The short term invalidation point is the same for both wave counts today.
This analysis is published about 07:50 p.m. EST.
A VIEW: Gold price has had an inside day on Friday with H1219.2 / L1204.1…. Twice shy of 1220, twice shy of 1203, a break on either side of H1219.2 / L1204.1 will likely point the way forward…. Gold price is getting a little bottomy (weakening ADX) currently finding support at 1208-05 and closed around pivot 1212/13… The drop from 1219.2 high got curtailed / went flat at 1211/10…. A short term up move (rally) is expecting (stochastic is bullish) to take out 1218-20 subject to rise above 1216-17 and sustain…. Gold price getting above 1220-23 and holding would probably then be the key to target a 50% retracement level at 1242/43…. On a weekly outlook basis, a pullback (drop) is expecting; gold price breaking below 1191-90 remains the enigma for now….
Is Feb 27 2015 report out??
I refreshed the EWG page and still shows Feb 26.
Updating this COT graph that I like to review each week. Blue line hasn’t turned at the bottom so I am expecting lower prices based on the recent past.
Thought I would add a little context. Because I believe the banks will always make money and that the COT can help me see their positioning, and because I don’t like to use # of contracts as a metric, I use this chart to help me see when banks and money mangers are taking opposite diverging positions with conviction. I use this chart to help me see if the banks are done with their current position, and it doesn’t look like it to me based on the past few years, so to me this supports Lara’s wave count.
Lara,
How low could gold go down to today?
I have to go out again this morning and so the end of week analysis will be done after market close. It looks like price is finding strong resistance just above the upper edge of the pink channel. If the first hourly chart is correct this should be broken on Monday. If the second, or a variation of it, is correct, then it may not be broken until mid to end next week.
This upwards move is either a series of overlapping first and second waves, or the beginning of a very choppy overlapping corrective move.
Little will change from last analysis. Charts will be updated, that’s pretty much it.
But… I have another wave count to give you. I am playing with the idea minor wave 1 (or A) ended earlier1,197 on 18th Feb (the low not labelled on the daily chart, between the low labelled minute wave iii and the low labelled minor wave 1) and that minor wave 2 (or B) is an expanded flat, with minute waves a and b complete and now minute wave c upwards unfolding.
The hourly chart for this new idea would look like the main hourly chart, a series of overlapping first and second waves has completed so an increase in upwards momentum should be seen for the middle of minute wave c. The target would be 1,256.
The only problem with this idea is a complete lack of fibonacci ratios between minute waves i, iii and v within minor wave 1 (or A). Which is unusual for Gold.
Either way, all my analysis at the moment has the minute and minor degree trends upwards.
Good luck everyone! Analysis will be published about 8pm NY time today.
Thanks Lara. The 1250 area makes sense in many ways, not the least of which is the target for a resolution of a fairly symmetrical inverse head and shoulders pattern that may be forming on the 5 hour chart
Why so high target (1256 ) for the expanded flat theory ? Maybe I am not understanding where the flat is …
Is it a typo ? You mean 1236 maybe ?
nope, 1,256. it’s 2.618 the length of minute wave a. I’m using 2.618 because minute c is beginning with three first and second waves, so it needs quite a bit more to unfold.
and now I’m changing it. analysis should be out now within an hour. it’s taken a few hours, I have more time on the weekend. I’m much happier with it today. I really want to get this right for you all for next week.
Also don’t you mean minor wave 1 (or A) ended earlier 1204 on 17th Feb ? That way minute a is a 3 as required ?
I’m confused and my head is spinning after this week .
My guess is she means that the minute (iv), as its labeled now, would be minute (a) of a minor wave B expanded flat. That’s a 3. Then after the downward movement where minute v is now, which would be minute wave (b) and seen as a 3, probably a zig zag, she is probably saying minute wave (c) would be 2.618 the length of minute (a) to get the target. Although that doesn’t quite reach the 1256 number according to my quick math
That would make sense except she said it starts from 1197 on Feb 18 …
Yes you’re right. I just re-read what she wrote. Guess we’ll see later tonight how she gets that target. Seems valid from a regular TA perspective though
maybe I shouldn’t have tried to explain in words and should have just waited to publish the chart. will be done soon, in about an hour now. I did mean 1,197 on 18th Feb.
well if its worth anything in this crazy mixed up world, I understood what you said. 🙂 Can hardly wait for Gold to start behaving! lol.
and now… I’m changing it again. I’ve spent hours on this today, I have more time on the weekend, and I have two wave counts for you which have really nice subdivisions and some nice Fibonacci ratios. My conclusion is the same, more upwards movement, maybe for three more days to 1,240 – 1,243.
Cesar proofs all my work and he’s out now. So it is done, and will be published in another hour or so.
Not a problem . Just thought u might not include it in today’s report .
What is 9 ema for gold today? Yesterday it was 1211.32.
Gold can make correction to 1209.75 and 1206 again
Excellent! I asked this question to Tham exact same time you posted. “what is the lowest low we should see in this structure until top at 1235”
It might not break 1200
That will do for me. I take 1210
What is your basis If I may ask politely?
Price action theory
but why do you ask this question
Waseem M
In light of Lara’s nice response above do u still think she agrees with yr low 1207 before going higher?
I work with Price action and Harmonic patterns..
that’s what i see… 1206 and below that 1200 trendlines support.
My interpretation (please see my response below to Richard 3 hours ago) is the same as Lara’s new idea. The second wave of Minute C of Minor B should end just above 1210, assuming the most common 0.618 retracement of wave 1. If wave 2 is not a complex wave it should reach 1210 at most in the next few hours (I do not have a good data feed, only using the live feed from Investing.com and so could not tell the exact decimals). Thereafter, it will move upwards in waves 3 through 5.
My response just now got lost due to a bad connection. My wave count is the same as Lara’s new idea. Please see my response to Richard 3 hours ago for more details. We are in Minor B Minute C subminuette 2. Minute C has 5 subminuette waves. Subminuette 2 should end just above 1210 assuming the common 0.618 retracement of wave 1. Unless wave 2 is complex, it should end within the next couple of hours. I do not have good data feed and so could not place the exact decimals.
I tried to respond 9 hours ago but somehow got a bad connection and this reply was left in limbo.
My wave count is the same as Lara’s new idea except for the target. She sees 1243 while I still had 1235. My start point for Minor B was 1190 while she had 1197 which was a few candlesticks earlier. In my remark to Waseem, I had placed the resistance levels at 1235 followed by 1244 then 1263.
Please see my response to Richard 3 hours ago (now 12) for more details. We are in Minor B Minute C subminuette 2. Minute C has 5 subminuette waves. Subminuette 2 should end just above 1210 assuming the common 0.618 retracement of wave 1. Unless wave 2 is complex, it should end within the next couple of hours (timed from 3:30 am ET). I do not have good data feed and so could not place the exact decimals.
I’m doing it the hard way but let’s get this DUST to 14!!
I vote for this level. Is it an emotion want target or you have some thing??? PLS share.
Gold was following the alt hourly chart dead on until moved up to 1219 again…now that it failed again to break 1220 again, the alt still looks good to me…we’ll see….
Thanks u got something.
After this drop gold will go the way of EWG in March
It’s always very fluid .. the chart can always be changed to agree with what happens… Then it looks perfect again…
Be careful…
Lara, regarding the alternate daily, I’d be grateful if you could consider intermediate 2 being over (perhaps with a double zigzag) and we are now starting intermediate 3. Points in favor of this idea are
1) intermediate 2 has retraced more than .618 of intermediate 1 which classifies it as ‘deep’.
2) the duration of intermediate 2 is already half the duration of intermediate 1 and that gives it the right look (to me).
I will consider it, and yes, the structure could be complete as a single zigzag. The subdivisions are a horrible fit though, and the would be a lack of fib ratios within the waves…. but yeah, that possibility should be considered.
Really appreciate Lara’s timely response on this — as a trader, I had been looking at the same scenario. Thanks for bringing this up Fencepost.
looks like we are in 5th wave
Was 1219.41 at 10:54 am the top of the 3rd or 5th wave of wave i?
Looking to clarify because at top of 5th wave for today then get a big drop today?
I’ve got Minor B as a 3-wave structure, sub-dividing 3-3-5. The waves are 1190 / 1220 / 1205 and then terminating at 1235. We are now in Minute C of Minor B 1205 / 1219 / …. So 1219 would be the first sub-wave of Minute C, with 4 to come. We will defer to Lara when she posts later on.
It sounds like you think gold has already peaked for today. That wave a circle (y) just ended at 1219.41 at 10:54 am so down goes gold? Is that right?
No. 1219.41 is only the first of five waves in Minute C. I don’t think gold could peak today. Maybe on Monday or Tuesday. I still think the peak will be at 1235.
ThamThank you.
I try to sell at the peak of TODAY.
I just sold GDX at 11:54 am at $12.44 just 3 cents below the high. Gold was stalling.
When profits are offered to me fast I take them as they quickly disappear then have to do the cycle all over again for profits.
Then gold drops then buy low. Then sell at next good peak with profits whichever day that is, instead of waiting 5 days to take profits and that might not happen as way too volatile lately.
Profits at 1235 is still sounding good with cheap prices between now and then.
My sentiments exactly. That is the essence of day trading. Get out fast once you sense the microtrend changes. GDX is not so bad. It is not leveraged so slippage does not come into play. DUST got badly eroded this week as it was so volatile. On some days it even followed gold instead of being inverse. I got caught on that one.
Tham, what is the lowest low we should see in this structure until top at 1235?
Sorry. Was asleep as it is bed time here in Singapore. The low should be just above 1210.
Price hit a low around 1210.89 half an hour before the market closed.
Wow what a blast, right thru the pink trendline!!!
GDXJ PSAR triggered up on daily and 60-minute.
And now GDXJ broke over yesterday’s 26.80 high.
Which target is most likely 1235 or 1263. When do we know, what is the decision points between these targets?
I will prefer 1235. infact 1230 is daily resistance
but it can go to 1263, invalidation point is 1307
currently price is trying to push through hourly resistance
Agreed. I’ve got the resistance level at 1233. Only if price manages to push above 1233 would it target 1244 then 1263.
Lara already said in analysis and video 1235 more likely and only has 1235 on charts, She may clarify more when closer to target.
“either 1,235 or 1,263, favouring the lower target. …
Because this is a second wave correction within a larger third wave at intermediate degree I favour the 0.382 Fibonacci ratio at 1,235. If it does not end there it may end higher about the 0.618 Fibonacci ratio at 1,263.”
I work on Harmonic trading patterns>>> IF price go to 1235 and from there is move downwards, i’ll have more confidence in my pattern of Head n Shoulder.. I’ll then wait for the break of neckline round 1190 area.. and that break will confirm the Head n Shoulder trade
The lower target is more likely because this is either a second wave within a larger third wave, or it’s a B wave. Intermediate (3) should exert a strong downwards pull, making minor 2 and 4 within it more brief and shallow than usual.
Maybe 1,217.58 at 9:14 am was top of wave 3 of wave i, then 1212.91 at 10:04 am was bottom of wave 4 of wave i, then started and in wave 5 of wave i. At top of 5 then may go down in wave ii and higher probability stay above 1201.18. Any idea which wave we are in now?
the alt count down to 1190 is still a possibilty…
Well looks like we are going higher after all but this current EW count is confusing to say the least .
resistance at channel at the moment
Lara’s current wave count appears consistent with 34 year old gold’s seasonality. From January to June July gold is in down trend. Even this was the case during roaring bull from 2003 to 2011.
Once gold makes high then rest of year gold makes lower highs and lower lows.
1307 in January is the season’s high and now late Feb early March high 1235-1260. Low in April-May High in May June then final low.
Just check out the chart of last year that’s what happen.
Any time soon gold is going to make low here.between 1190 and 1200.
Gold Seasonality
When you say wave count, do you mean the alternate hourly wave count?
Last year 2014 gold started low at 1,181 Dec 31st bottom and climbed and hit a high March 3rd weekend.
General assumptions need not apply.
Dec 31,2013 bottom then up to March 3, 2014 high
Come on Gold stall and coast into the open at 1,202.00 giving us a chance to buy low then impulse rocket up to 1,235 for a Friday profit taking special event before the close. “Cha-Ching” LOL
I hope it holds too (so that I can enter a position). Spot gold currently appeared to have bottomed around 1205. The ride up will be rather choppy as there are many waves, as much as nine, before gold hits 1235 (hoping for 1263). Imagine, 9 waves squeezed in a $30 range (1205 to 1235). Personally, I will put up a small position in GDX as the 3X ETFs will significantly decay under the choppiness. I am waiting for 1235 / 1263 before putting up a much larger position for the downswing.
Hi Tham, I believe the approx 3 x (hopefully) profits will be more than adequate to offset any short term erosion. You shouldn’t be holding them too long in choppy conditions. Everyone has their own favorites for trading. Good luck…
Richard, keep an eye on gold for us tonight alright?
(little joke, get some sleep man!)
Good chance to make money tomorrow…
Stayed in shorts. Lara has done a good analysis. I think gold will go below 1201.
I wish you the best…
I wish you the best. The wave count now appears to have bottomed around 1205. Both the main and alternate will then move choppily up to 1235 or 1263 before dropping again. It is just that choppiness will significantly erode the 3X ETFs. Most of us have taken a loss yesterday at the low of 1207 that I envisaged. It might be better to exit.
Choppiness over extended periods of time do erode 3X ETFs as it is adjusted daily. However the “delay/slippage” is over rated.
It may be about 1% monthly.
The Long Term Behaviour of Leveraged ETFs
http://ddnum.com/articles/leveragedETFs.php