
Upwards movement was expected, with Friday’s session completing a green candlestick which fits the Elliott wave count. I have a new main and alternate Elliott wave count for you to end the week, and I am more satisfied that the subdivisions and ratios are a better fit.
Summary: I expect to see an increase in upwards momentum over the next few days to a target at either 1,240 – 1,243 or 1,245.
Click on charts to enlarge.
Main Daily Wave Count
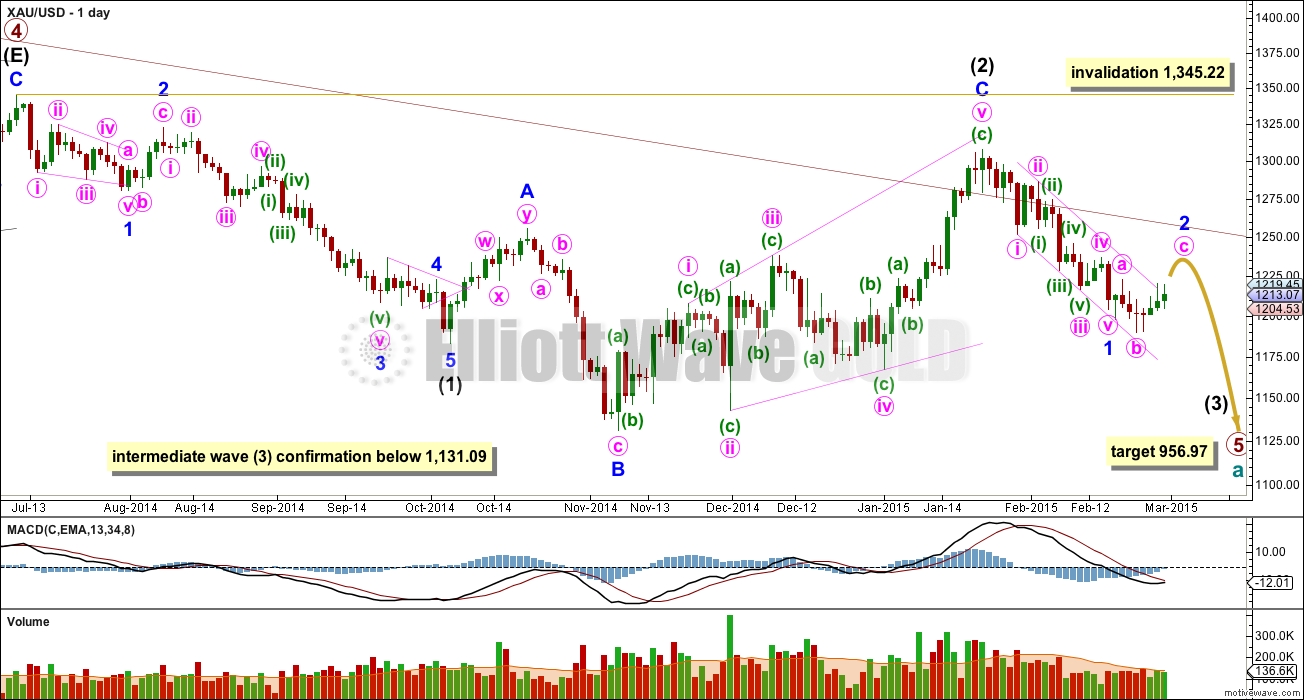
This main wave count sees Gold as still within a primary degree downwards trend, and within primary wave 5 intermediate wave (3) is in its early stages. At 956.97 primary wave 5 would reach equality in length with primary wave 1. For Silver and GDX this idea, that the primary trend is down, is the only remaining wave count. This main wave count has a higher probability than the alternate below.
The maroon channel about cycle wave a from the weekly chart is now breached by a few daily candlesticks and one weekly candlestick. If cycle wave a is incomplete this channel should not be breached. The breach of this channel is a warning this wave count may be wrong, and so I will still retain the alternate.
Draw the maroon trend line on a weekly chart on a semi-log scale, and copy it over to a daily chart also on a semi-log scale (see this analysis for a weekly chart).
Within primary wave 5 intermediate wave (1) fits perfectly as an impulse. There is perfect alternation within intermediate wave (1): minor wave 2 is a deep zigzag lasting a Fibonacci five days and minor wave 4 is a shallow triangle lasting a Fibonacci eight days, 1.618 the duration of minor wave 2. Minor wave 3 is 9.65 longer than 1.618 the length of minor wave 1, and minor wave 5 is just 0.51 short of 0.618 the length of minor wave 1.
Intermediate wave (2) is an expanded flat correction. Minor wave C is a complete expanding ending diagonal. Within an ending diagonal all the sub waves must subdivide as zigzags. The fourth wave should overlap first wave price territory. Expanded flats are very common structures and ending diagonals are more common than leading diagonals.
This wave count has more common structures than the alternate wave count, and it has a better fit.
A new low below 1,131.09 would confirm that a third wave down is underway.
Intermediate wave (2) may not move beyond the start of intermediate wave (1) above 1,345.22. If this invalidation point is passed this wave count would be fully invalidated.
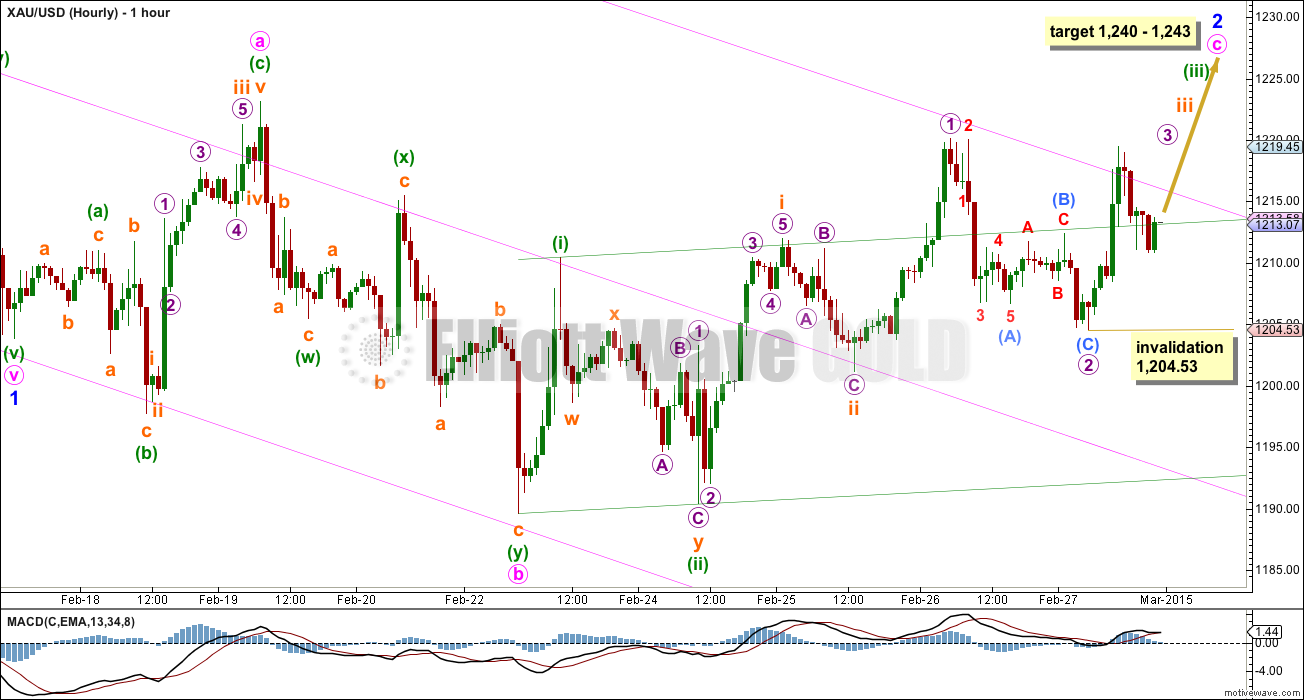
I am adjusting the wave count within minor wave 1 downwards to see it over earlier and minor wave 2 unfolding as an expanded flat. Ratios within minor wave 1 are: there is no Fibonacci ratio between minute waves iii and i, and minute wave v is 1.67 short of 0.618 the length of minute wave i.
I was not satisfied with the odd looking subdivisions in the last main hourly wave count so I have spent some time to see if there is a better fit.
If minor wave 1 ends earlier then within it there is now a Fibonacci ratio between minute waves v and i. Within minor wave 1 minute wave v ended right at the lower trend line of the channel drawn using Elliott’s first technique. Minute wave ii is a deep 0.61 double zigzag and minute wave iv is a shallow 0.29 triple zigzag, so there is some alternation between them although not as much as normal for Gold.
Minor wave 2 may be unfolding as an expanded flat correction. Within the expanded flat of minor wave 2 minute wave a itself subdivides perfectly as an expanded flat with minuette wave (b) as a 187% correction of minuette wave (a), and there is no Fibonacci ratio between minuette waves (a) and (c) (but that is not unusual for Gold).
Minute wave b subdivides perfectly as a double zigzag and it is a 174% correction of minute wave a. Minute wave c should be expected to be longer than 1.618 the length of minute wave a in order for it to move above the end of minute wave a avoiding a truncation and a rare running flat. At 1,240 minute wave c would reach 2.618 the length of minute wave a. This is just below the 0.382 Fibonacci ratio of minor wave 1 at 1,243, giving a $3 target zone.
Minor wave 1 lated 18 days, with no Fiobnacci duration. So far minor wave 2 has lasted 8 days. If it ends in three more days at 11 days total it may be 0.618 the duration of minor wave 1. Or it could continue for another five days and total a Fibonacci 13.
So far the upper edge of the parallel channel copied over from the daily chart continues to provide resistance. Once price manages to break above this with at least one full hourly candlestick above the upper pink trend line and not touching it, then I would expect momentum to increase as the middle of a third wave within minute wave c unfolds.
Within micro wave 3 no second wave correction may move beyond its start below 1,204.53.
Please note: because 1-2-3 and A-B-C of a zigzag subdivide in exactly the same way (they both subdivide 5-3-5) this idea also works for the alternate below. There, intermediate wave (2) may not be over and minor wave B may also be unfolding as an expanded flat correction.
Alternate Daily Wave Count
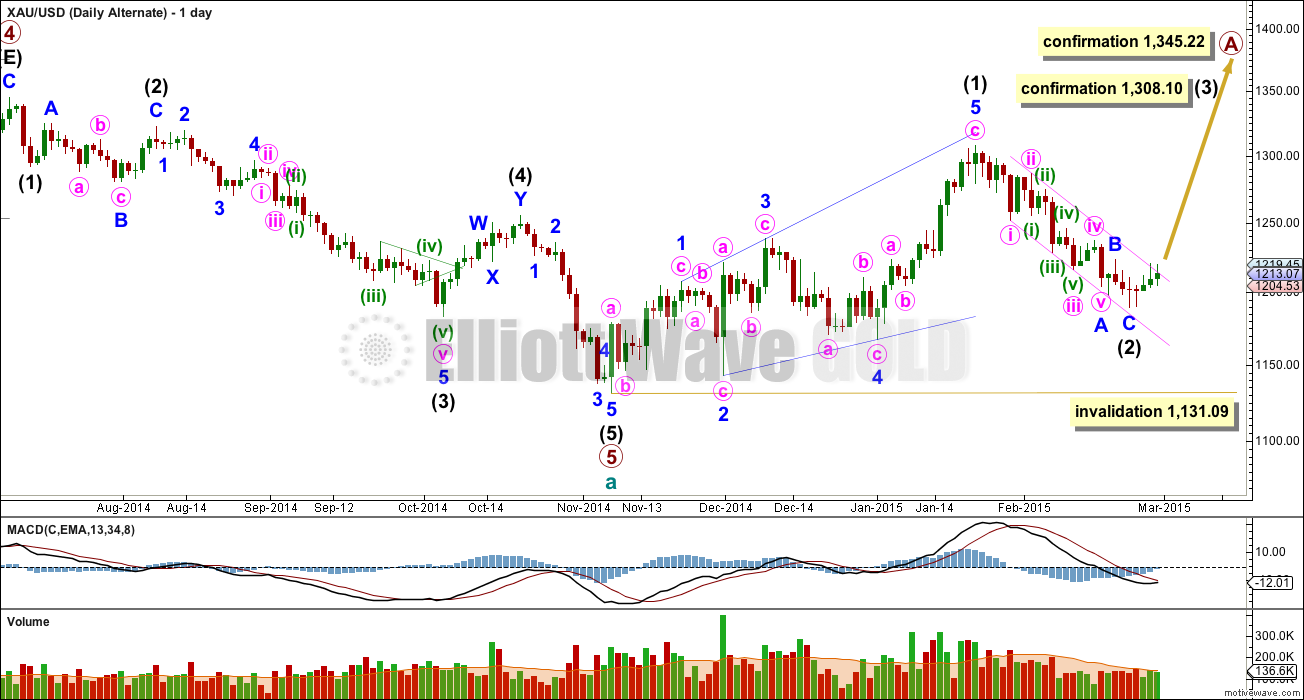
At this stage I judge this alternate wave count to have a lower probability. The structure of downwards movement, and momentum, will determine which wave count is correct over the next few weeks. At this stage they both expect more downwards movement so there is no divergence in the expected direction.
This wave count sees a five wave impulse down for cycle wave a complete, and primary wave 5 within it a completed five wave impulse. The new upwards trend at cycle degree should last one to several years and must begin on the daily chart with a clear five up.
The first five up may be a complete leading expanding diagonal. Within leading diagonals the second and fourth waves must subdivide as zigzags. The first, third and fifth waves are most commonly zigzags but they may also be impulses. This wave count sees minor waves 1, 3 and 5 as zigzags.
Leading diagonals are almost always followed by deep second wave corrections, sometimes deeper than the 0.618 Fibonacci ratio. It is possible now to see intermediate wave (2) as a deep 0.67 single zigzag. If it is over it may have lasted just a little under half the duration of intermediate wave (1).
My biggest problem with this wave count is the structure of intermediate wave (2) within primary wave 5. This is a rare running flat but the subdivisions don’t fit well. Minor wave C should be a five wave structure, but it looks like a clear three on the daily chart. If you’re going to label a running flat then it’s vital the subdivisions fit perfectly and this one does not. This problem is very significant.
Within intermediate wave (5) minor wave 3 looks like a three on the daily chart, where it should be a five. This movement may also be labelled with minor wave 3 ending higher and minor wave 5 looking like a three. Either way, one of the actionary waves within this downwards movement will look like a three and not a five which does not have the “right look” at the daily chart level.
Intermediate wave (2) of this new cycle degree trend may not move beyond the start of intermediate wave (1) below 1,131.09. I am leaving the invalidation point on the daily chart here because it is still possible that intermediate wave (2) is not over, because it may be continuing as per the main hourly wave count above.

The biggest difference here in terms of subdivisions on the hourly chart from the main hourly chart above is how I am seeing the wave down here labelled minor wave C. For the main hourly wave count I am seeing this move down as a double zigzag, but it can also fit as an impulse. It is ambiguous.
If minor wave C is an impulse then minute wave iii is just 0.43 short of equality in length with minute wave i, and there is no Fibonacci ratio between minute wave v and either of i or iii. There is perfect alternation between the deep 0.57 expanded flat of minute wave ii and the more shallow 0.39 zigzag of minute wave iv.
If intermediate wave (2) is over then intermediate wave (3) upwards may have begun. It would be beginning with a series of overlapping first and second waves, and so an increase in upwards momentum should be seen also for this alternate idea.
This analysis is published about 02:13 p.m. EST.
new analysis published
Invalidated??? Have 4 minutes to exit position.
Gold is edging down but NUGT is holding its own so far…more tossing and turning tonight…
Whenever gold gets this close to the invalidation point, it has broken through. Instead, perhaps the move from 1190 to 1223 could be a 1st wave of some sort. If current movement is a 2nd wave, then 0.618 would bring gold back to 1202.
I haven’t seen any posts from Lara…
With gold dipping down so far, I’m starting to think that it will unfold much like intermediate 2 of primary 5 except on a smaller scale. That is, the C wave is still in progress but maybe forming a diagonal. You may recall that after gold hit 1130 it went up, but was soon followed by a dramatic drop to 1140 only to turn back around and make a new high. Too early to tell, but that would bring the invalidation point to 1190 again.
Lara, it looks like the invalidation point of 1,204.53 will hold. Is that correct?
If that is the case I will buy more GDX.
If gold broke above the pink channel for several hours over night, why does gold drop so much today instead of increasing up with momentum?
hitting then bouncing off 1204.74 just 21 cents off the invalidation point. Do you think it will hold the rest of the session and overnight?
I hope so, just piled into NUGT. No alternative from Lara, so have to follow what we have.
too close for comfort for me – I’m still playing higher degree down with main daily.
Too close for my comfort also. If it breaks over night I will be challenged somewhat. However, a bounce from here could be spectacular.
I got in to….Good luck..
Lara. I am thinking that the move up from 1204.53 to 1223 and then correcting down to 1207 are submicros 1 and 2 of micro 3 since there is no noticeable sharp increase in momentum, rather than micro 3 and micro 4 respectively. Also, if 1223 is micro 3, it is rather short, just slightly more than one time of micro 1. Awaiting your report for verification. Thanks.
Tham KL
what determines that gold is in exp flat? Wave a was 3, wave b was 3 and wave c needs to be 5: 3-3-5?? Til it happens then one call exp flat.
Thank for explaning?
An expanded flat occurs when wave b is more than 1.0 of wave a, usually up to 1.382 times. Then wave c is usually 1.618 or 2.618 times of wave a. If wave c is less than 1.0 of wave a, then it becomes a running flat. All flats subdivide 3-3-5. So, in the case of Minor 2, wave c has to be more than 1.618 of wave a. At 1240, it is 2.618 times.
THANKS u r an asset to this board!!!
To clarify, to avoid a running flat I believe C must reach beyond the end of A, not any particular ratio of A, although of course by definition it must be more than 1.0 of A or it wouldn’t have been a potential expanded flat. In other words, I believe C can be more than 1.0 of A but still result in a running flat if it doesn’t go beyond the end of A
Well said.
So far 1207/1205-04 is holding; a break below here opens up 1192-91…. The downside is strengthening
It’s very easy to change the wave count to agree with price action…
I think there is an obvious inverse relation with the US dollar or/and S&P lately that technicians are ignoring for the past week or so. Also, I think the Greek (kick the can down the road) resolution was a factor as well working against gold.
Thanks Emil,
If Putin declares war on NATO I hope I’m in NUGT…hehe
hit 1205 and then back up?
Key support is 1205. If this is broken, the last two supports before the plunge are 1200 and 1196.30. If Lara’s wave count (both main and alternate) is correct, price ought to rise from here.
It’s very easy to change the wave count to agree with price action…
.
it’s pretty quiet…Heads or Tails?
Wave Cs are like third waves. They begin slowly and then increase in momentum. I reckon the price will rise quickly tomorrow. The rise will most likely take place and taper off by Friday when the non-farms payroll is announced. The sentiment is that the figures ought to be pretty good. So, a rate hike will be imminent. June is on the table. The US dollar will rise as higher rates are favorable for the dollar. This will pressure gold and other dollar denominated assets downwards. Perhaps that will be the end of Minor 2 and the big drop begins.
Sounds good Tham, ty….I think it’s heading up too… Just trying to figure out a low for today….
I reckon this is micro 4 in Lara’s wave count. In that case, the low cannot be less than 1204.53, the low of micro 2. Invalidation will be the start of micro 1 at 1201.18.
yeah, that’s why I said 1205 earlier…
I estimated after last night bounce that .618 retrace down to 1211.70.
Gold already dropped to 1210.26 at 10:15 am.
Any other retrace projections anyone???
An retracement expert and gold forecaster I know is expecting GLD to close down today.
Another informative post highlighting the importance of 1250 for gold.
http://www.gold-eagle.com/article/glimmer-hope
Last week, in a public post, Rambus had a pretty bearish look at Gold. This week, in a new public post, he takes a look at the miners and sees some bullish near term possibilities.
His targets would seem to conflict with Lara’s EW count, since her bull option was invalidated and the current bear count is expected to see limited upside before turning down.
My take on GDX is that it is following Lara’s count and is currently forming the c wave of an expanded flat for minute wave 2 before turning down. This week should be interesting.
http://rambus1.com/?p=33438
Lara, if being in Minor 2 of Intermed 3 is correct, does Minute C ABSOLUTELY complete Minor 2…, or is it possible for that structure to morph into something else that continues longer?? Please advise-thanks.
An excellent question. Unfortunately no, it does not definitively end minor wave 2. Minor wave 2 could continue further as a double flat or double combination.
Attention to the “right look” and typical behaviour of Gold is necessary to determine the probability of the correction being over.
Because this is a second wave in a larger degree third wave we may expect it to be more brief and shallow than normal. If it ends as a complete structure at the 0.382 Fibonacci ratio and has a reasonable duration in comparison to minor wave 1 we can expect it will be over.
Look at minor degree waves in intermediate wave (1). The corrections there are more brief than the actionary waves.
I will never be able to give you certainty. I will only ever be able to give you probability.
Confirmed six hour+ break above upper pink trend
line happened Monday morning. Any retrace target for Monday before gold continues on higher?
another bit of info…..
per Gary Wagner, ChartThis (Kitco video) 2-20-15
http://www.kitco.com/news/video/show/Chart-This/903/2015-02-20/Critical-Area-For-Gold-At-$1198—Gary-Wagner
Notes $1998
low is key area. 61.8% of Nov rally,
76.4% of Jan rally. Ability to maintain this low is key as
to whether we are in Bull Market or are going to return to the Bear trend of
recent years.
[4 & 5 days later –US Fed
Policy mtg- gold broke this low twice @1990-ish]
Sure do hope Lara’s Alternate Count is NOT the right one !
another source: 3/1/15
http://www.investing.com/analysis/this-past-week-in-gold-243417
The big picture remains the same: dollar up and gold down.
Summary
Long term – on major sell signal since Mar 2012 whenARCA Gold BUGS was at 550.
Short term – on sell signals.
Gold sector cycle – down as of 2/07, ending the up cycle since November.
Lara: “Minor wave 2 may be unfolding as an expanded flat correction.”
In expanded wave how high wave c reaches above the wave a??
Can it be a running flat as well and how onr can tell?????
Normally, in expanded flats, wave C = 1.618 or 2.618 of wave A. In this case, it cannot be 1.618 as that will bring Wave C up to a value below wave B. Hence Lara uses 2.618. yielding 1240.
Thanks Tham. After gold testing slightly higher than wave A at 1223, gold now at 1215 do you think this wave has turned into running flat?
Wave 3 complete and now corrective wave 4 .
How low wave 4 can travel before going higher to complete wave iii at 1243?
That’s quite a tough call to make. Price has not been able to break 1224.60 which is a key resistance area. If we assume Lara’s wave count is correct, 1223 may be micro 3 but it is rather short, only just slightly longer than micro 1. We might need to wait for further developments to have a clearer picture.
running flats are extremely rare, and you wouldn’t call it until well after the fact if it is indeed obvious that it occurred. Also, in this context, it would have missed by quite a large margin so it is further highly unlikely
Measured move chart
Nice chart! What doe it show on a daily or 4 hour chart???
How low gold will correct before going to Lara;s target??
Assuming the spectators don’t mind, I will offer some alternate points of view on this chart. These pionts are consistent with Lara’s alternate daily scenario.
1) The support line of that triangle experienced a false break, followed by a nice rally, and there is now a retest underway. If the retest is successful (no new low), then there should be enough power to break out of the top of the trading range and test resistance over 1550.
2) The support line of the triangle could be redrawn to connect the three lows and then a bullish falling wedge appears with a price objective just under 1400.
The bearish scenario Bob B put forward is IMO more clear on the silver chart, but in that case I think the downside price objective may have already been met and we are in a trading range waiting to see what happens next.
Yes, there are a couple of different trend lines that could form bullish falling wedges. The situation is still unclear.
Volume can be helpful in choosing the most probable chart interpretation.
thanks for posting this perspective. 🙂
Bob,we notice the correlating points early Jan/Feb/Mar 2014 where it breaks the horizontal support and Feb/Mar 2015 where we are now. Hope this pattern plays out!
Correlates to Lara’s Main Count i think.