
Upwards movement hit the first target zone of 1,281 – 1,287, but structure indicates the correction is not over there.
Summary: In the short term I expect one more upwards zigzag to a target at 1,299. This may give one more green candlestick or doji to show this second wave correction as a big deep movement on the daily chart. Volume supports a trend change to the downside. When the correction is over I am expecting a strong third wave down.
*Note: I can publish text and charts only today. I am travelling and my current internet connection is not strong enough to upload video. I have said everything I intend to say in the text below. I will be back home later today and video will resume tomorrow.
Click on charts to enlarge.
Main Daily Wave Count
At this stage I judge this main wave count to have an even probability with the alternate below. I will let the structure of downwards movement, and momentum, tell us which wave count is correct over the next few weeks. At this stage they both expect more downwards movement so there is no divergence in the expected direction.
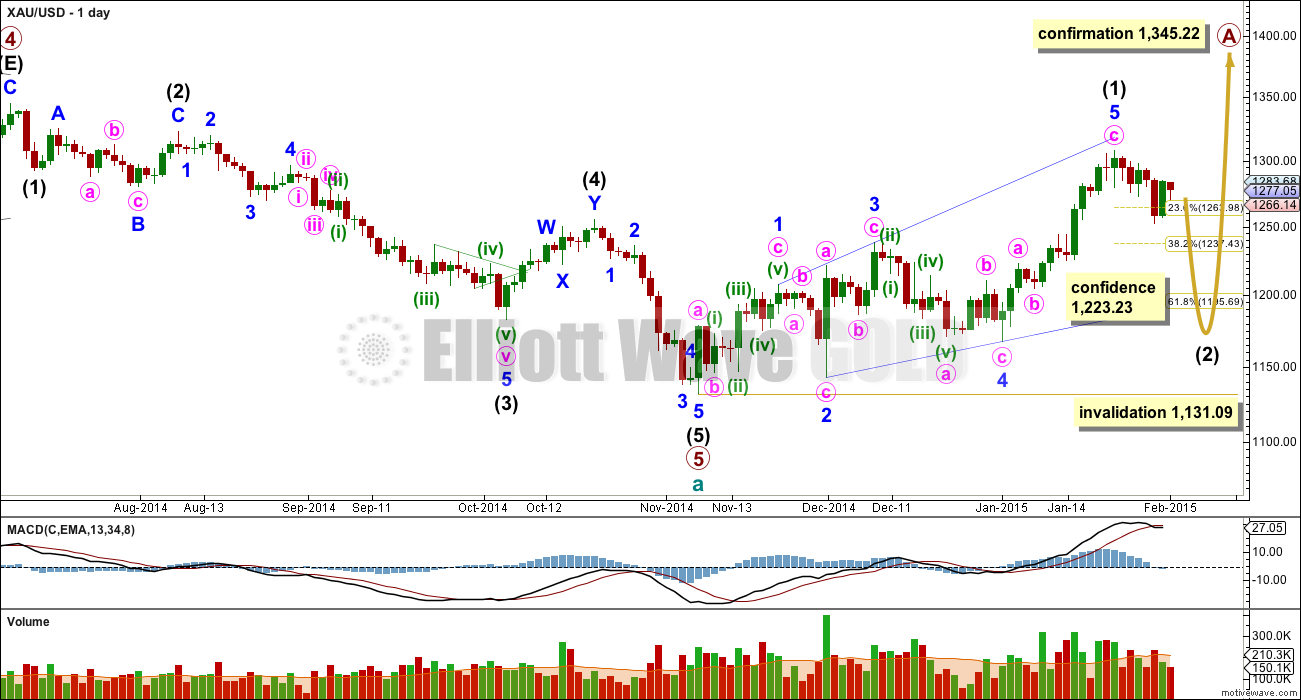
This wave count sees a five wave impulse down for cycle wave a complete, and primary wave 5 within it a completed five wave impulse. The new upwards trend at cycle degree should last one to several years and must begin on the daily chart with a clear five up.
The first five up may be a complete leading expanding diagonal. Within leading diagonals the second and fourth waves must subdivide as zigzags. The first, third and fifth waves are most commonly zigzags but they may also be impulses. This wave count sees minor waves 1, 3 and 5 as zigzags.
Leading diagonals are almost always followed by very deep second wave corrections, often deeper than the 0.618 Fibonacci ratio. This wave count expects a big deep correction downwards, and it should subdivide as a clear three on the daily chart (the alternate below expects a five down).
My biggest problem with this wave count, and the reason I will retain the alternate, is the structure of intermediate wave (2) within primary wave 5. This is a rare running flat but the subdivisions don’t fit well. Minor wave C should be a five wave structure, but it looks like a clear three on the daily chart. If you’re going to label a running flat then it’s vital the subdivisions fit perfectly and this one does not. This problem is very significant and this is why I judge the two wave counts to be about even in probability.
Intermediate wave (5) looks like a zigzag rather than an impulse, and has a corrective wave count. This is also a problem I have with this wave count.
Intermediate wave (2) is most likely to subdivide as a zigzag, which subdivides 5-3-5. When this 5-3-5 is complete then how high the following movement goes will tell us which wave count is correct.
Intermediate wave (2) of this new cycle degree trend may not move beyond the start of intermediate wave (1) below 1,131.09.
From January 23rd onwards, since the expected trend change, volume is highest on down days. This supports the idea that we may have seen a trend change and the trend is now down. Volume for Silver is even clearer, with a big spike on the down day there for 29th January.
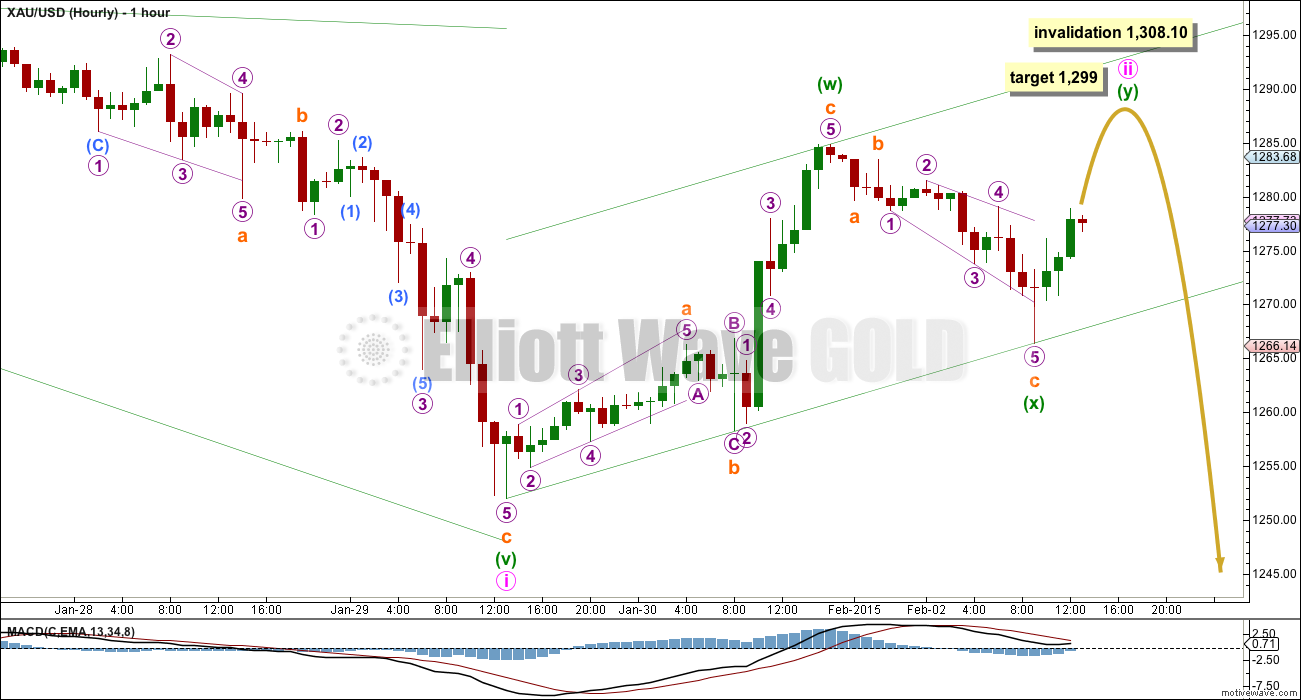
Corrections following leading diagonals in first wave positions are normally very deep. Minute wave ii so far has reached to about the 0.618 Fibonacci ratio, but it does not look like this correction is over yet.
The downwards movement labelled minuette wave (x) does not subdivide as a five, but it does subdivide as a three. It has a cursory count of 11 which is corrective. Because this wave is a three this indicates minute wave ii is not over. I expect it may be continuing as a very deep double zigzag.
Double zigzags have the purpose of deepening a correction when the first zigzag does not move price deep enough. Although in this case the first zigzag has made minute wave ii a deep correction, close to the 0.618 Fibonacci ratio, this is a second wave following a first wave leading diagonal. These are quite often deeper than the 0.618 Fibonacci ratio. Double zigzags should have a clear slope against the main trend.
This double zigzag may fit within this best fit channel drawn here. I will use the lower edge of this channel to confirm a trend change. When we can see at least one hourly candlestick below the lower green trend line and not touching it then I would expect minute wave ii is over and minute wave iii down should have begun.
At 1,299 minuette wave (y) would reach equality in length with minuette wave (w).
Minute wave ii may not move beyond the start of minute wave i above 1,308.10.
Alternate Daily Wave Count
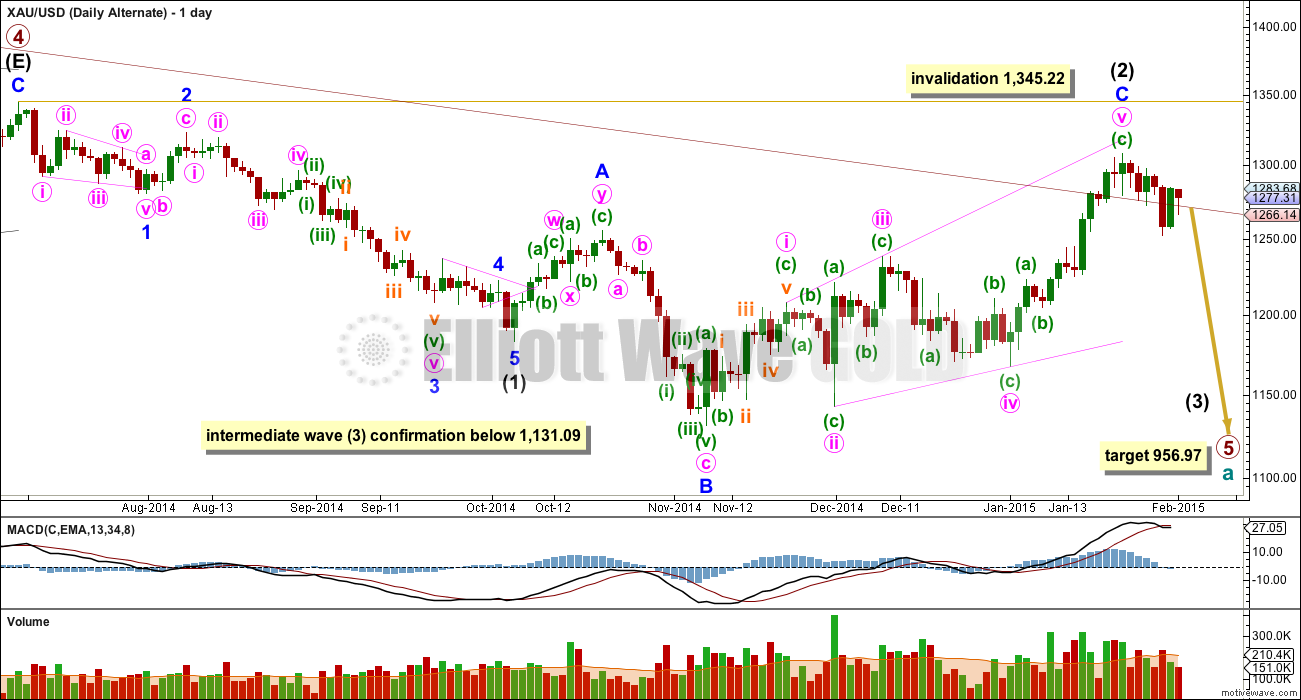
The maroon channel about cycle wave a from the weekly chart is now breached by a few daily candlesticks, and is now also breached on the weekly chart by one weekly candlestick. If cycle wave a is incomplete this channel should not be breached. For this reason this wave count, despite having the best fit in terms of subdivisions, only has an even probability with the main wave count. It will prove itself if we see a clear five down with increasing momentum on the daily chart.
Draw the maroon trend line on a weekly chart on a semi-log scale, and copy it over to a daily chart also on a semi-log scale (see this analysis for a weekly chart).
Within primary wave 5 intermediate wave (1) fits perfectly as an impulse. There is perfect alternation within intermediate wave (1): minor wave 2 is a deep zigzag lasting a Fibonacci five days and minor wave 4 is a shallow triangle lasting a Fibonacci eight days, 1.618 the duration of minor wave 2. Minor wave 3 is 9.65 longer than 1.618 the length of minor wave 1, and minor wave 5 is just 0.51 short of 0.618 the length of minor wave 1.
Intermediate wave (2) is now a complete expanded flat correction. Minor wave C is a complete expanding ending diagonal. Expanded flats are very common structures.
This wave count has more common structures than the main wave count, and it has a better fit.
Within an ending diagonal all the sub waves must subdivide as zigzags. The fourth wave should overlap first wave price territory. The rule for the end of a fourth wave of a diagonal is it may not move beyond the end of the second wave.
Although Gold almost always adheres perfectly to trend channels, almost always is not the same as always. This wave count is still possible. The trend channel breach is a strong warning that this wave count may be wrong and we need to heed that warning with caution at this stage.
A new low below 1,131.09 would confirm that a third wave down is underway.
When the first 5-3-5 down is complete on the daily chart this wave count would see it as 1-2-3 and the main wave count would see it as A-B-C. The following upwards movement will tell us which wave count is correct. If it moves back into price territory of the first 5 down then it can’t be a fourth wave correction so the main wave count would be correct. If it remains below the price territory of the first five down then it would be a fourth wave correction and this alternate would be correct. This divergence will not begin for at least a couple of weeks.
At 956.97 primary wave 5 would reach equality in length with primary wave 1.
Intermediate wave (2) may not move beyond the start of intermediate wave (1) above 1,345.22. If this invalidation point is passed this wave count would be fully invalidated.
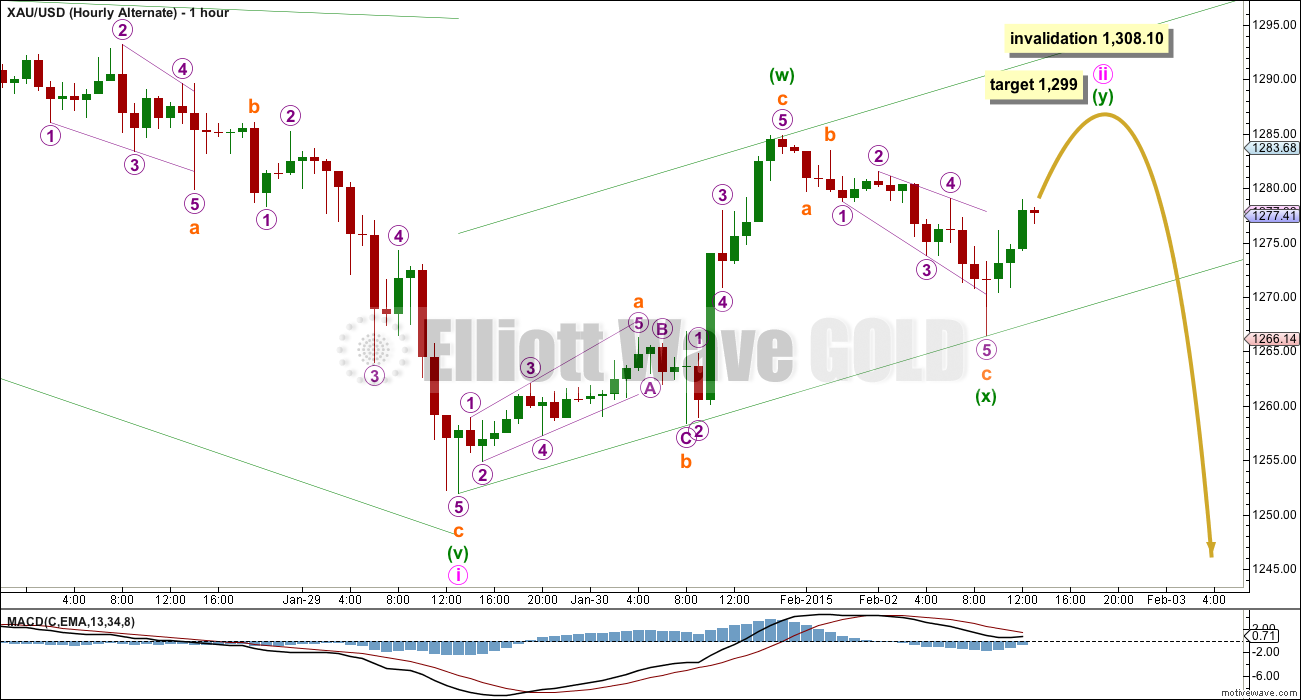
The short term structure, targets and invalidation points are the same for both wave counts at this stage.
This analysis is published about 01:39 p.m. EST.
I made a few swing trades today selling in the $8.80’s on JDST, then into a small JNUG position until $33, then back into JDST, brought my average some. Let’s see what happens the next few days. GDXJ looks vulnerable…
shorted 1267 again now at cost
ahhhh thing of beauty as we enter iii of 1
can’t wait for 3 🙂
Gold just hit high of $1,267.91 at 1:51 pm.
Almost exactly $1,267.12 the .618 retracement of difference between the high 1285.86 at 2:50 am less low of 1255.53 at 11:06 am today.
All the EW guys could do this in their sleep.
Surprised nobody posted it already.
I better get JDST DUST TODAY AT CLOSE???
I have been buying DUST and JDST today.
Right now they are almost at day’s low.
GOT IT! SOME MORE NEAR CLOSE.
.618 (1285.86 – 1255.53) = 1274.27
Thanks Matt, I realize my mistake was subtracting it from the high instead of adding the .618 to the low. $18.744 + 1255= $1,274.27. Thanks for sharing.
Gold didn’t even retrace 50% yet.
Does that mean gold still has to go up to 1274.27?
Since it is a correction within a 3rd wave, it could well end lower.
Matt
What is price diff of wave i ?
Lara noted below:The first target would be 1,196 (1.618 X wave i)
1308-1252 = 56 (1.618) = 90.6
Subtract that from top of wave 2 (1285). My numbers are rough, but you get the point.
Thanks Matt
This alert was timely!! Thanks Richard.
Yes people want to know where it will retrace to for the day so they know when and where to buy.
Does Gold still have to retrace back up .618 of today’s drop?
Or because minute wave iii has started it won’t retrace back up that high?
I hope gold hits $1,240 target today (if same as Thursday Jan 29th) then sell DUST as gold may have big correction up.
I’ll be picking it to be more likely to be shallow, to the 0.382 ratio at 1,267. Doing the analysis right now. Published shortly… with video!
I bought my JDST position back this morning in premarket. It cost me, but in the grand scheme of things, it should be peanuts. Nice to finally see this wave get started.
MTLSD – What is your target for this move? I have been holding JDST and DUST for over two weeks anticipating this move.
GDXJ around $24 is my target for this move, I think that coincides with $gold at 1240ish, and then a 4th wave correction which I will participate in somehow.
May be wave ii Y got truncated and now gold has completed wave iii at low 1257.
Start of wave iv up to 1300?????
I believe we already have 2 confirmations of third wave down, which is a deep wave much deeper that 1257. I explain below.
Anyone know where next fibonacci correction up will be?
Does the lower target of $1,240 from Thursday’s chart still stand?
The first target would be 1,196 (1.618 X wave i). The second target would be 1,140 (2.618 X wave i).
Hi Lara,
Are you saying that there’s no substantial retracement from 1260? That we’re heading further down first?
Yes, a second wave correction should unfold. But its a lower degree so may not show up on the daily chart, so may be quicker. Its also within a third wave so may be more shallow. Analysis will be published very soon.
Would $1,196 be the next first big correction up?
Wow that is surprisingly low and I really like it.
Do I take that gold is going down to 1196 from here?
Yes it may as that is the next target.
Lara: I am sure that all of your subscribers are burning to know the answer to Scott’s question below. A quick response would be much appreciated. Thanks.
Hourly chart has this instruction.”I will use the lower edge of this channel to confirm a trend change. When we can see at least one hourly candlestick below the lower green trend line and not touching it then I would expect minute wave ii is over and minute wave iii down should have begun.”
As of 10:01am gold has 1 full hourly candlestick under 1,270 and the lower green trend line is at 1,274 area.
This confirms a trend change minute wave iii should have begun.
Gold just confirmed third wave down with a new low below 1266.26. That wasn’t on last night’s analysis however it was on Friday’s analysis. Does it still apply???
I bought GDX last night and now looks like gold and miners going down.
Richard
I notice on yr chart u have TSI (747). How do u use this indicator
No idea what that is. I posted a lot.
May be a good idea to wait for next day opening rather jump the gun. I should have waited for today.
Papudi, I’m no expert but i think its down from here, still favour the ALT and if this is a 3rd wave i expect bounces to be small
At 8:54 gold at 1264 . Did it invalidate any wave???? Any one. Is 1295 still in the cards??? oR It is over?
I believe we are now breaking down. See charts above.
Are we still going to 1299? Confused. 🙂
really doubt 1266 holds this time
Really hope not. But where are we on the charts?
Lara- I would like to catch 5th wave down in US Oil. Oil is up today 3r day in row and it might be touching the pink line.
At appropriate day if you would revisit US Oil wave counts will appreciate.
Thanks in advance.
Will do. It does look like that third wave is finally over for USOil. I would still want to see a new high above 57.14 though before I have confidence that this is a bigger upwards correction. I expect intermediate wave (4) to last about a month.
ICE To Replace London Gold Fix
By Kitco News
Monday February 2, 2015 12:45 PM
(Kitco News) – The Intercontinental Exchange (NYSE:ICE)
will be administering the London Bullion Market Association (LBMA)
gold fix in March 2015, when it will replace the London Gold Fix, which
has been used since 1919.
Previously announced in late 2014, the exchange’s ICE Benchmark
Administration (IBA) will head the pricing mechanism, which it said
will transition to a physically settled, electronic and tradeable
auction, with the ability to participate in three currencies: USD, EUR
and GBP.
0,618 fibo holds firm. C wave of this correction may be over. I see there clear 5-wave structure with extended 3rd wave.
Looks like we need v of c to me towards $1295 to complete, but I’m not the greatest squiggle counter
Direction south confirmed
Agreed
Piotr – why do you say this?
Gold closed at $1,274.40 and just hit $1,285.86 at 2:50 am in a $5.50 increase in that 1 minute. It might be a fast trip up to the $1,299 target. I would like some of that increase to happen during market hours as it would lift up GDX more that way before it switches direction to down.
I hope so too. Long now for this trip. Key marker is 1299 to switch from long to short.
There are two time periods for gold to be volatile. 6:45 to 7:15 AM and other is when COMEX opens 8:15 to 11 AM.
Besides looking at the GDXJ inv HnS it appears it may not be just one day rally.
Hi Lara,
hope you had a great trip. Good to have you back though. Is Silver moving up like Gold? Could you indicate how high the correction in Silver could be?
Thank you very much Ursula
At this stage I would expect Silver to have just completed its correction too. I want to see that channel on the daily chart breached before I have confidence that 2 is over and 3 down has begun. That channel for Silver is providing really strong support ATM.
Anyone know how to swap out an uploaded chart if you want to edit a comment?
Lara most likely the only one that can remove a posting.
yes u can remove the post and upload new one.
click edit below.
on top right side there is inverted v for a dropdown
select option.
thanks. thought i would have to do the delete thing but wasn’t sure. so since the additions were minimal i just waited for Lara’s clarifications to the questions i had. Thanks again
When gold hits $1,299 the miners may be ready to collapse.
http://stockcharts.com/h-sc/ui?s=$GDM&p=W&yr=10&mn=0&dy=0&id=p81587138645&a=374989603&listNum=1
Weekly GDM chart with bearish shooting star 2 weeks ago and bearish spinning top last Friday…http://bit.ly/1BQPZ87
Watching 50 MA and upper trend line.
Lara, since I’ve been so frustrated with the way charting software leaves us no room on the right-hand side of the chart to annotate future projected movement, I am trying to make my own version of what you are saying in the text articles– cause I’m just so pictoral when things are confusing. So, my question is, do I have two things labeled correctly below? Namely, the 1308.10 invalidation would be invalidating “Minute ii structure”, and the 5-3-5 downward movement you refer to under your Alternate description is refering to the “current Intermediate wave” we are in–(what ever THAT IS) ? 🙂 Help!
dsprospering, I like your treasure map. We are here at ‘b’ on your black dotted line. I bought GDX tonight when gold at $1,274.62 after hours. Then sell at gold 1,299 c ii (y), and buy DUST/JDST and sell down maybe around 1,240 for more treasures.
We LIKE treasure maps! My childhood favorite. 🙂
Yes, 1,308.10 is the invalidation point for minute wave ii. What that means is, if this point is passed upwards movement cannot be a second wave correction. The wave count would have to change to see upwards movement as part of the prior upwards wave, not a new trend.
The 5-3-5 I am referring to is the new downwards trend. Minute waves i and ii are part of this. The trend will be intermediate wave (2) for the main count, and intermediate wave (3) for the alternate.
Intermediate wave (2) must subdivide as a correction, most likely a zigzag, 5-3-5 at minor degree.
Intermediate wave (3) must subdivide as an impulse, at minor degree this will be 5-3-5-3-5.
I will try to make this clearer in todays video. I know its complicated!
Lara- Alt wave daily : “The following upwards movement will tell us which wave count is correct. If it moves back into price territory of the first 5 down then it can’t be a fourth wave correction so the main wave count would be correct.”
On hour chart is 1266 the price territory of the first 5 down???
Means that once gold price moves down it should hold below the 1266 and continue down.
On the other hand if gold goes above 1266 next target is 1340ish and birth of new trend up.?????
I’m sorry, its a bit of a complicated concept to state clearly in text. I mean on the daily chart. For the main wave count we’re looking at minor wave A as a five, for the alternate we’re looking at minor wave 1 as the first five.
When we have minor waves A-B-C for the main wave count, and minor waves 1-2-3 for the alternate, that’s when it diverges. Movement back into minor wave A or 1 price territory tells us the main wave count is correct and the alternate would then be invalidated.
Does that make sense?
Thanks that makes it clear ..Great so we wait for the movement down.
On pmbull the daily chart shows bullish engulfing reversal pattern. Right above is the red declining TL at around 1300 as resistance.
Lets see if gold gets upt and break the TL???
Hi,
it seems that Bearish Butterfly pattern is forming in 1 hour.
A break below 1266 will invalidate this. and it will be completed at 1299 same as lara’s target. and then followed by downward movement.
Waseem, thanks for the reassuring chart. Well done.
on the 4 hr chart there looks to be a nice trend channel heading down to ~1240
I see the 1240 on the bottom of the channel. However I don’t see $1,299 in the range on the top.
Since this was issued gold went up to $1282.39 and then just dropped $9 to 1273.22 at 2:40 pm the bottom trend line on Lara’s 1 hour chart. It sort of did the curve that was drawn. Now does Gold still have to go up to the $1,299 target?
Hi Richard, We will need to see a definitive breach of that trend line to confirm short term downwards movement. We could still see a rally up to 1299 until then.
The drop at 3:40 pm down to 1273.22 was .618 of the rise from 1266.54 at 9:17 am to 1282.39 at 1:48 pm.
Lara did mention it would take longer to hit $1,299.
“In the short term I expect one more upwards zigzag to a target at 1,299. This may give one more green candlestick or doji to show this second wave correction as a big deep movement on the daily chart.”
Yes, y=abc and we probably just witnessed the completion of b…still need c to $1295ish.
Chapstick_jr Thanks for your reply. I did post a comment below my lower one about 3:40 drop was just a retracement. Lara expects tomorrow to have a green daily candlestick and I also checked another EW forecasters analysis and he is expecting gold to go up after the 1266.54 drop today even higher than Lara has. I will buy some GDX in after hours.
I sold 3/4 of my JDST midday today. I’m not going long on the bull side myself but I will wait until more clear direction of the move down to re-enter into JDST. This whipsaw Friday and today cost me some thankfully I had some TVIX gains to offset it.
MTLSD, I hear you. Today was a surprise, luckily I traded it in a way that very small loss. However GDX up JDST/DUST down may be profitable trades. I do know a top trader who feels gold dropping from today. I advised him otherwise, but he wasn’t interested.
Yes. Minuette wave (y) should look like a clear three on the hourly chart.
I think we have so far only A-B (and B may be incomplete) of this three.
Thanks Lara, I figured it out and agree. Up Gold goes with my GDX after hours buy.
Lara, thank u for this timely post. Keep up the good work! :):)
You’re welcome!
I’m home again so all back to normal. Tomorrow will be easier with video.
Lara you put $1,299 as the target, however you marked it on the chart and the curve at about $1,289 instead of $1,299.
The curve looks like it may top out at $1,299 overnight? Is that possible?
Richard if i may respond to you as I have seen Lara answer this issue before– she is not drawing the arrows/curve at the exact price point but using them to indicate direction, use the text to identify price– space can get tight on charts
and IMHO, this little zigzag’s first portion took longer than overnight to make — be PATIENT. We all want to see the whoosh of this trend change, yes? Happy Trading.:)
gee i feel like i just stepped on the toes of the EWG owner– not my intention– but then the toes location would be about right for where i measure compared to her. cheers.
No worries, and you’re exactly right.
Often if I put the label at where I expect price to reach it “squishes” everything else down.
Read the target, don’t look at where the arrow ends exactly.
Does this make sense Richard?
Yes, I was just double checking, thanks to both you and dsprospering. :o)