
Price made a slight new high but failed by a considerable margin to reach the target, which was at 1,299. The trend channel on the Elliott wave hourly chart indicated a trend change, and a third wave down.
Summary: A third wave has most likely begun. In the short term another small second wave correction may have recently ended, or it could move sideways for a while yet. It is unlikely to show up on the daily chart. The next move down should show a strong increase in momentum. The short term target for the middle of the third wave is 1,218. The mid term target for this third wave to end is at 1,196 or 1,140. When there is more structure within it I can figure out which target will be more likely.
Click on charts to enlarge.
Main Daily Wave Count
At this stage I judge this main wave count to have an even probability with the alternate below. I will let the structure of downwards movement, and momentum, tell us which wave count is correct over the next few weeks. At this stage they both expect more downwards movement so there is no divergence in the expected direction.
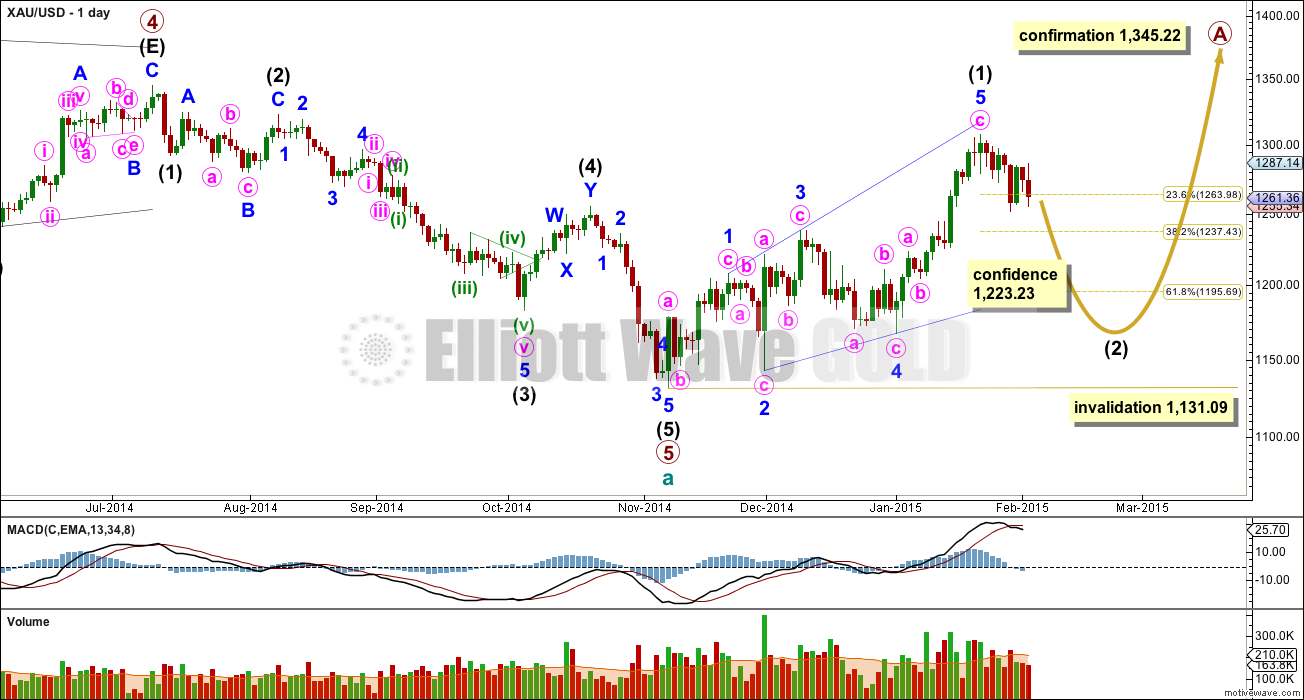
This wave count sees a five wave impulse down for cycle wave a complete, and primary wave 5 within it a completed five wave impulse. The new upwards trend at cycle degree should last one to several years and must begin on the daily chart with a clear five up.
The first five up may be a complete leading expanding diagonal. Within leading diagonals the second and fourth waves must subdivide as zigzags. The first, third and fifth waves are most commonly zigzags but they may also be impulses. This wave count sees minor waves 1, 3 and 5 as zigzags.
Leading diagonals are almost always followed by very deep second wave corrections, often deeper than the 0.618 Fibonacci ratio. This wave count expects a big deep correction downwards, and it should subdivide as a clear three on the daily chart (the alternate below expects a five down).
My biggest problem with this wave count, and the reason I will retain the alternate, is the structure of intermediate wave (2) within primary wave 5. This is a rare running flat but the subdivisions don’t fit well. Minor wave C should be a five wave structure, but it looks like a clear three on the daily chart. If you’re going to label a running flat then it’s vital the subdivisions fit perfectly and this one does not. This problem is very significant and this is why I judge the two wave counts to be about even in probability.
Intermediate wave (5) looks like a zigzag rather than an impulse, and has a corrective wave count. This is also a problem I have with this wave count.
Intermediate wave (2) is most likely to subdivide as a zigzag, which subdivides 5-3-5. When this 5-3-5 is complete then how high the following movement goes will tell us which wave count is correct.
Intermediate wave (2) of this new cycle degree trend may not move beyond the start of intermediate wave (1) below 1,131.09.
From January 23rd onwards, since the expected trend change, volume is highest on down days. This supports the idea that we may have seen a trend change and the trend is now down. Volume for Silver is even clearer, with a big spike on the down day there for 29th January.
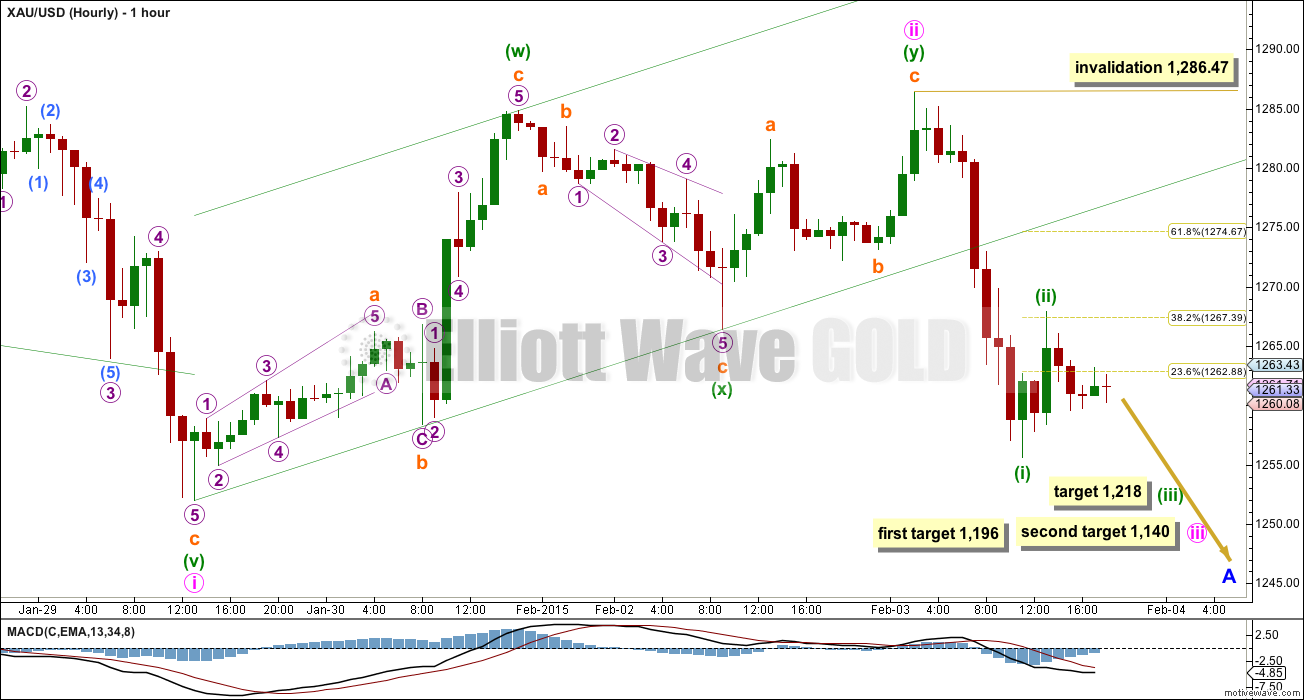
Minute wave ii is now a complete correction, and the channel drawn about it is clearly breached to the downside indicating it is over. A new low below the start of minuette wave (y) at 1,266 is further confirmation that this correction should now be over.
On the five minute chart minuette wave (i) subdivides nicely as a five wave impulse, which is further confirmation that minute wave ii is most likely over.
Minute wave iii may only subdivide as an impulse, and it should show a strong increase in downwards momentum beyond that seen for minute wave i. At 1,196 minute wave iii would reach 1.618 the length of minute wave i. At 1,140 minute wave iii would reach 2.618 the length of minute wave i (this second target really only fits well with the alternate wave count though). When minuette waves (i) through to (iv) within minute wave iii are complete then I can add to the target calculation at a second wave degree, and I can state which of these two targets is more likely.
At this stage the first downwards wave from the end of minuette wave (ii) looks like a five on the five minute chart. This may be the first wave down within minuette wave (iii).
I am labelling minuette wave (ii) as complete because it fits as a zigzag, and it is brief and shallow. The downwards pull of minute wave iii may force corrections along the way down to be relatively brief and shallow.
Alternatively, minuette wave (ii) may continue sideways and / or higher. The upwards wave labelled minuette wave (ii) may be only wave A within a flat correction, or wave W within a double zigzag or combination. If minuette wave (ii) does continue then because the first move up within it is a three, this indicates a flat or combination as most likely which would see it move only sideways, and not end substantially above 1,268. However, it is possible it may move higher as a double zigzag, a most likely end for that structure would be about the 0.618 Fibonacci ratio at 1,275. If it moves above this point then it should find strong resistance at the lower edge of the green channel drawn about minute wave ii, but it is very unlikely to be that deep.
Minuette wave (ii) may not move beyond the start of minuette wave (i) above 1,286.47. This leaves rather a lot of room for the market to move before the next downwards wave is underway.
Alternate Daily Wave Count
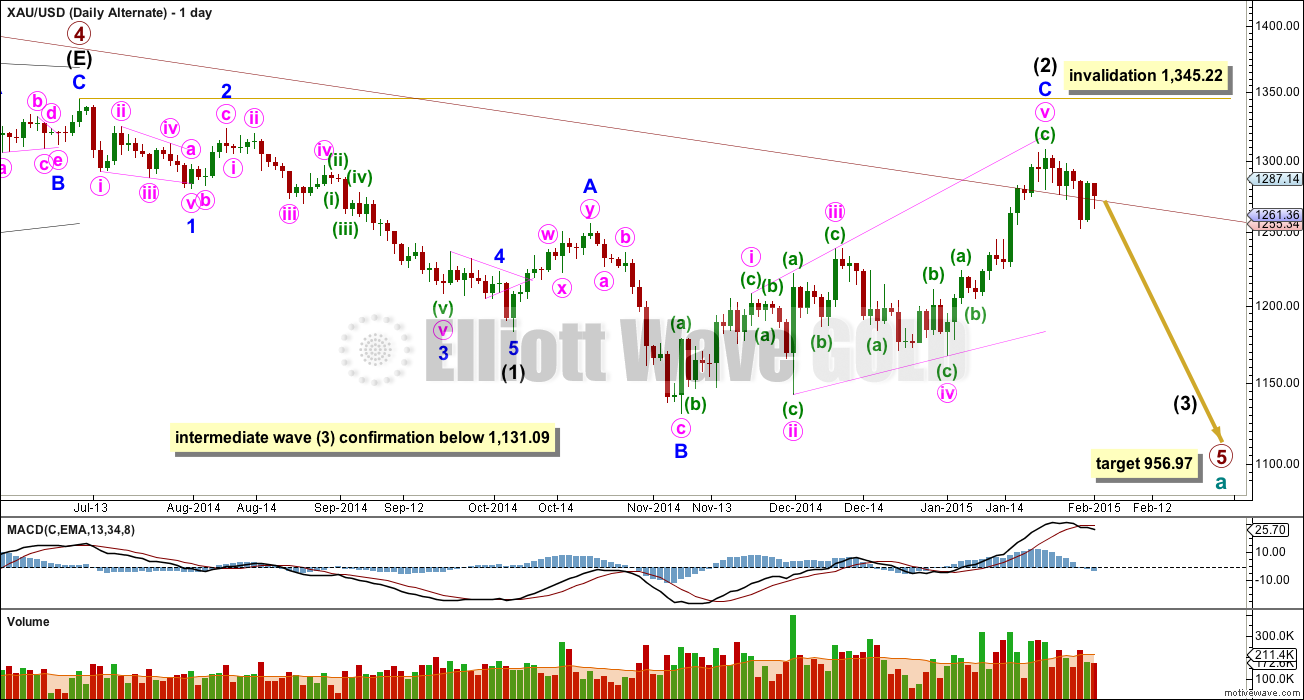
The maroon channel about cycle wave a from the weekly chart is now breached by a few daily candlesticks, and is now also breached on the weekly chart by one weekly candlestick. If cycle wave a is incomplete this channel should not be breached. For this reason this wave count, despite having the best fit in terms of subdivisions, only has an even probability with the main wave count. It will prove itself if we see a clear five down with increasing momentum on the daily chart.
Draw the maroon trend line on a weekly chart on a semi-log scale, and copy it over to a daily chart also on a semi-log scale (see this analysis for a weekly chart).
Within primary wave 5 intermediate wave (1) fits perfectly as an impulse. There is perfect alternation within intermediate wave (1): minor wave 2 is a deep zigzag lasting a Fibonacci five days and minor wave 4 is a shallow triangle lasting a Fibonacci eight days, 1.618 the duration of minor wave 2. Minor wave 3 is 9.65 longer than 1.618 the length of minor wave 1, and minor wave 5 is just 0.51 short of 0.618 the length of minor wave 1.
Intermediate wave (2) is now a complete expanded flat correction. Minor wave C is a complete expanding ending diagonal. Expanded flats are very common structures.
This wave count has more common structures than the main wave count, and it has a better fit.
Within an ending diagonal all the sub waves must subdivide as zigzags. The fourth wave should overlap first wave price territory. The rule for the end of a fourth wave of a diagonal is it may not move beyond the end of the second wave.
Although Gold almost always adheres perfectly to trend channels, almost always is not the same as always. This wave count is still possible. The trend channel breach is a strong warning that this wave count may be wrong and we need to heed that warning with caution at this stage.
A new low below 1,131.09 would confirm that a third wave down is underway.
When the first 5-3-5 down is complete on the daily chart this wave count would see it as minor 1-2-3 and the main wave count would see it as minor A-B-C. The following upwards movement will tell us which wave count is correct. If it moves back into price territory of the first 5 down (minor wave A on the main wave count and minor wave 1 for this alternate) then it can’t be a fourth wave correction so the main wave count would be correct. If it remains below the price territory of the first five down then it would be a fourth wave correction and this alternate would be correct. This divergence will not begin for a few weeks.
At 956.97 primary wave 5 would reach equality in length with primary wave 1.
Intermediate wave (2) may not move beyond the start of intermediate wave (1) above 1,345.22. If this invalidation point is passed this wave count would be fully invalidated.
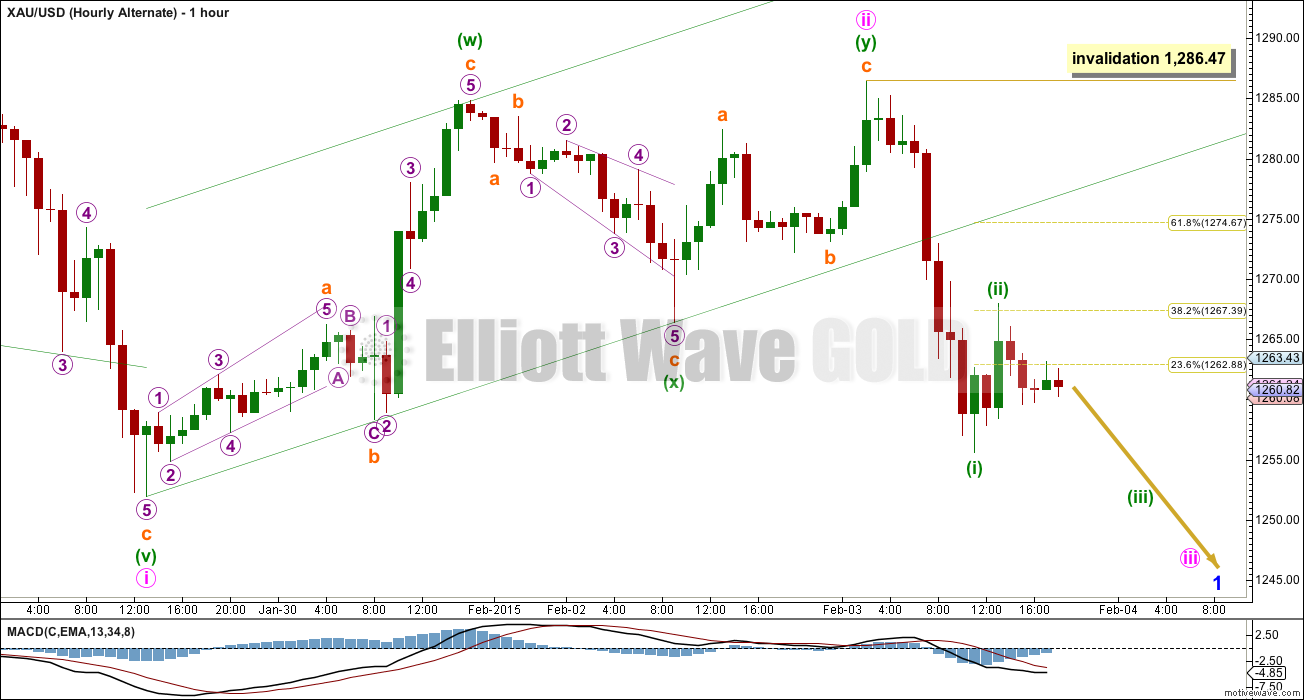
The short term structure, targets and invalidation points are still the same for both wave counts at this stage. They probably won’t diverge for a few weeks.
This analysis is published about 08:02 p.m. EST.
Feb 4 report is posted
The count looks good and i still prefer the ALT , only thing is, this really doesn’t ‘feel’ like a 3 nor the makings of a 3…
That’s because it has not begun
According to hourly chart , we are in minute wave iii …
correct, *if* the count is right. I actually believe it is but we seem to be lacking to strong downward pressure associated with wave 3’s
That’s my point also . Lara said since we are in a 3 , corrections should be very brief . So far this (ii) is not so brief . Furthermore , we never reached the deep 1299 high that was projected because of the leading diagonal for minute wave i . My conclusion is we are not in minute wave iii . But that is just my opinion .
Alex77-
As far as action of gold after 24 hr I agree w/u that it is not acting as expected. May be one more day and it should not linger like this.
For wave ii to be complete Lara oultlined two arguments above:Minute wave ii is now a complete correction, and the channel drawn about
it is clearly breached to the downside indicating it is over. A new low
below the start of minuette wave (y) at 1,266 is further confirmation
that this correction should now be over.”
EW novice.
Yeah , I am not going to give much weight to a trend channel on an hourly chart .
Can any one tell wave iv high at 1272 is done?
I see a wedge forming since 5:30 am and bottom line since 10:30 am.
It looks like it may end in about an hour.
Lara is this something where it may breakout to the downside?
I hope gold is done with the ups for the day.
I meant to add that the wedge is in the 5,3,2,1 minute time frames on http://www.pmbull
Gold is not acting like it is in wave iii again. Corrective waves are yo be shallow and short duration.
Is this wave iv supposed to appear on daily chart??
Richard BO to upside from wedge. Next resistance 1266 hope.
is it possible that we are still in Minute wave ii ?
According Lara target of 1196 and 1140 is not final yet. She wrote:” When minuette waves (i) through to (iv) within minute wave iii are
complete then I can add to the target calculation at a second wave
degree, and I can state which of these two targets is more likely.”
So deep correction may not be in the cards yet???
Am I reading it correctly???
Misunderstanding part of it.
Now she had those two lower targets. As gold gets lower she will clarify which one is more likely or remove one.
During this sideway move continue to stay in DUST/JDST??
How long this side way is expected???
Gold needs to drop below 1255.
Lara how do you see GDX playing out with your main daily gold count?
I’ll have time to look at GDX later today. Will update.
Great, I can’t get the two to fit …argh
US yields jump after ADP US jobs data 1 Hour Ago Reuters
http://www.cnbc.com/id/102395789
U.S. sovereign bond yields rose on Wednesday after the January reading on a gauge on U.S. private jobs creation supported the view of steady domestic employment growth and revived bets the Federal Reserve might raise interest rates in mid-2015.
Gold dropped right when this news came out due to concerns of raising interest rates puts pressure on gold.
Volume on GDXJ is very light…
Is this gold dropping wave down complete for now and we wait for the .500 or .618 retracement or is there more to drop first?
No one knows such things. It can as well go further down from here.
The confirmation was already done yesterday.
It retraced 55% to 1,266.68
Gold just dropped $13 in 30 minutes from $1,272.42 down to $1,259.66 at 10:36 am. Does that clarify that minuette wave (ii) is finally over? I hope so.
Hi. Currently 1270-72 limiting with 1263 holding, below that 1255-54…. Momentum appears to have slowed down – snap rally can be expected for 1279-80 and possibly further out to the 1281-87 retracement zone…. I would look to keep it short in any case, with risk of a break above 1298 to negate downward movement. Tough one until gold price gives some clarity!
2nd wave moving sideways, buying time so we don’t become oversold.
Nice bear flag, should be a nice collapse in the next few days
I am just not feeling this chop as start of some big move down . I could be wrong of course . Feels very choppy to me .
Lara said second waves could be very deep and scary. This can go easily to 1274, IMHO.
Yes Lara wrote: ” However, it is possible it may move higher as a double zigzag, a most likely end for that structure would be about the 0.618 Fibonacci ratio
at 1,275.” OR upto the green channel lower rail.
Interesting to know is if this is double zz or a combination (3-3-5). If the latter is true one more leg up may be needed.
looks like a WXY or 3-3-3. Downside momentum must increase right here and break $1252. New target for this third of a third wave down should be $1224ish. It’s do or die time right here. 5 hr chart still has MACD sell signal valid which is good.
I see 5 waves, with 5th extended. Usually after 5th ext. correction is severe and consumes the whole 5th. I see that this correction is double zz. It should be over here.
Amazing analysis and video thanks Lara.
Thanks for sharing your comment. AD Lara’s mid day clarification.
Looks like gold wants to pop towards $1270 to complete minuette wave ii. If Lara’s main count is correct, I just can’t help wonder if we are going to test $1180ish once again before rocketing higher in wave 3.
your timely comments here are very helpful to understand EW. If gold is expected to go up in wave 3 means gold has a major trend change.
Thanks
A look at GDX