
The middle of a third wave down has just passed, exactly as expected.
Summary: The middle of a third wave has just passed. The target for it to end is still at 1,224 which may be met on Monday. Be aware Gold sometimes exhibits strong fifth waves and if this target is wrong it may not be low enough. A second possible target for the middle of this third wave may be at 1,194. The mid term target for the larger third wave at minute degree is still either 1,196 or 1,140. The mid term target may be met in one to one and a half weeks.
Click on charts to enlarge.
Main Daily Wave Count
At this stage I judge this main wave count to have an even probability with the alternate below. I will let the structure of downwards movement, and momentum, tell us which wave count is correct over the next few weeks. At this stage they both expect more downwards movement so there is no divergence in the expected direction.
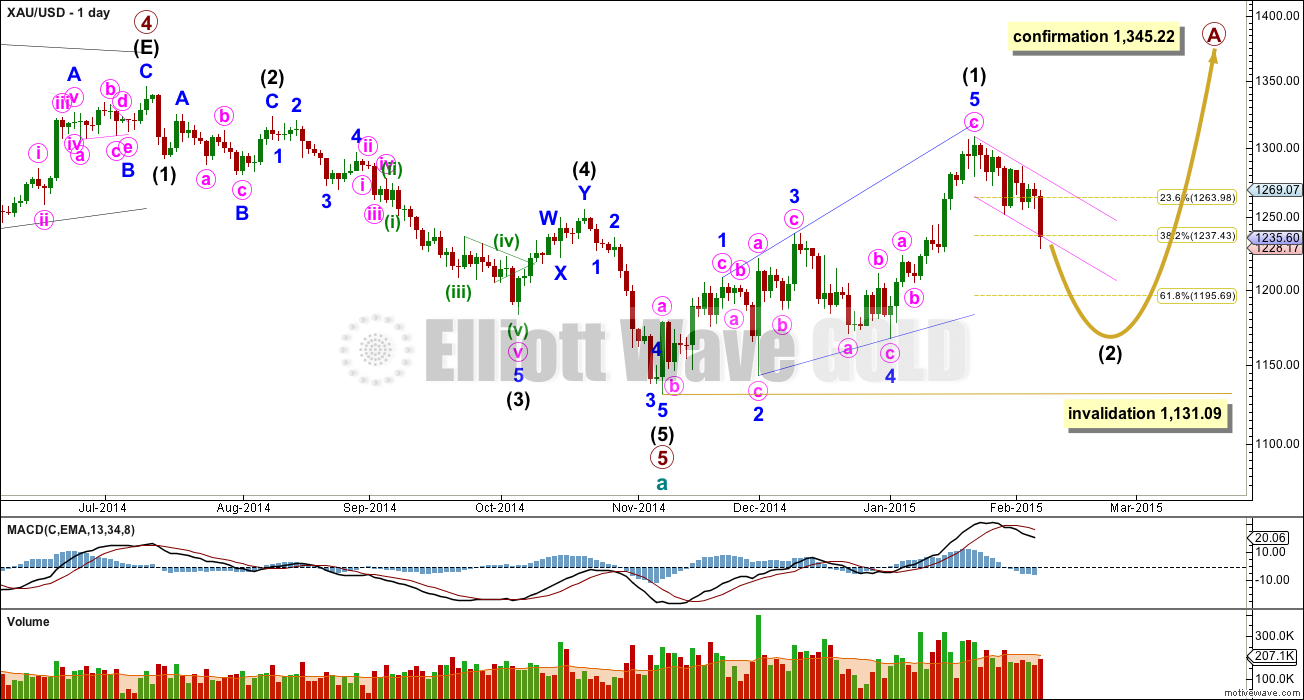
This wave count sees a five wave impulse down for cycle wave a complete, and primary wave 5 within it a completed five wave impulse. The new upwards trend at cycle degree should last one to several years and must begin on the daily chart with a clear five up.
The first five up may be a complete leading expanding diagonal. Within leading diagonals the second and fourth waves must subdivide as zigzags. The first, third and fifth waves are most commonly zigzags but they may also be impulses. This wave count sees minor waves 1, 3 and 5 as zigzags.
Leading diagonals are almost always followed by deep second wave corrections, sometimes deeper than the 0.618 Fibonacci ratio. This wave count expects a big deep correction downwards, and it should subdivide as a clear three on the daily chart (the alternate below expects a five down).
My biggest problem with this wave count, and the reason I will retain the alternate, is the structure of intermediate wave (2) within primary wave 5. This is a rare running flat but the subdivisions don’t fit well. Minor wave C should be a five wave structure, but it looks like a clear three on the daily chart. If you’re going to label a running flat then it’s vital the subdivisions fit perfectly and this one does not. This problem is very significant and this is why I judge the two wave counts to be about even in probability.
Intermediate wave (5) looks like a zigzag rather than an impulse, and has a corrective wave count. This is also a problem I have with this wave count.
Intermediate wave (2) is most likely to subdivide as a zigzag, which subdivides 5-3-5. When this 5-3-5 is complete then how high the following movement goes will tell us which wave count is correct.
Intermediate wave (2) of this new cycle degree trend may not move beyond the start of intermediate wave (1) below 1,131.09.
From January 23rd onwards, since the expected trend change, volume is highest on down days. This supports the idea that we may have seen a trend change and the trend is now down. Volume for Silver is even clearer, with a big spike on the down day there for 29th January.
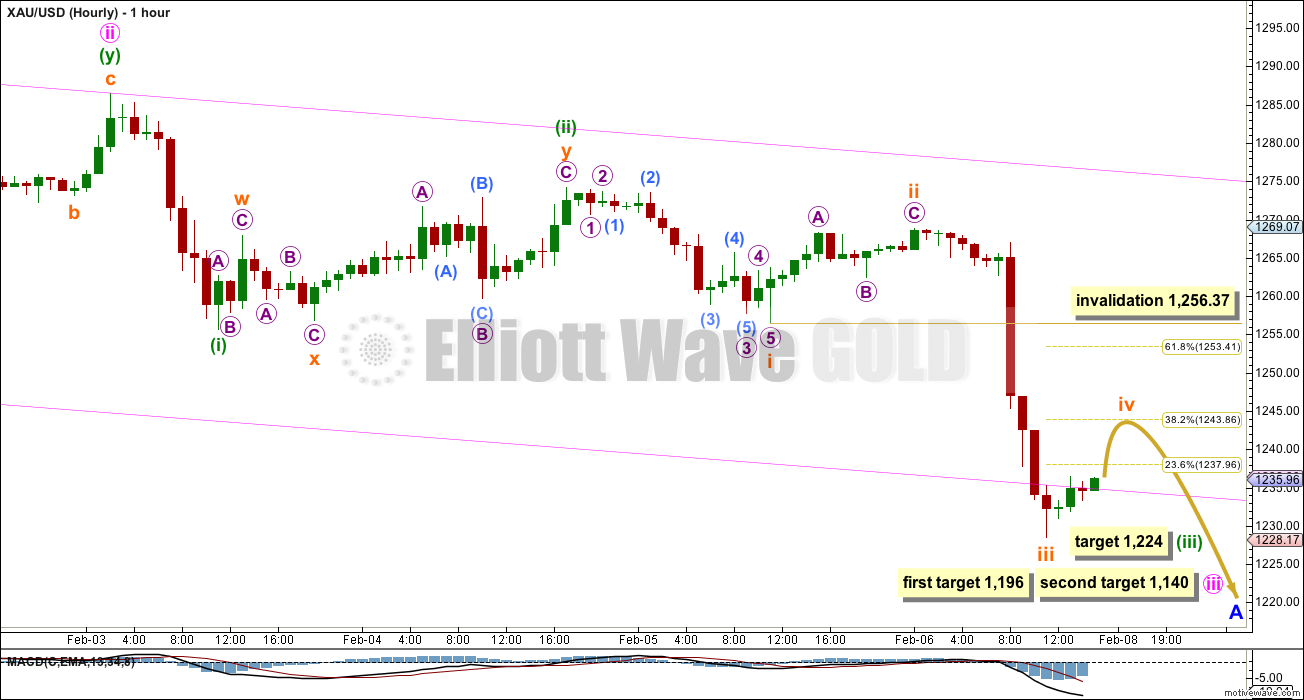
The strong downwards movement with a strong increase in momentum is exactly what a third wave should look like. There is no Fibonacci ratio between subminuette waves i and iii so I will expect to see a Fibonacci ratio between subminuette wave v and either of i or iii. When subminuette wave iv is complete then I can add to the target calculation for minuette wave (iii) at a second wave degree, so the target of 1,224 may widen into a small zone or it may change.
At 1,224 minuette wave (iii) would reach 1.618 the length of minuette wave (i).
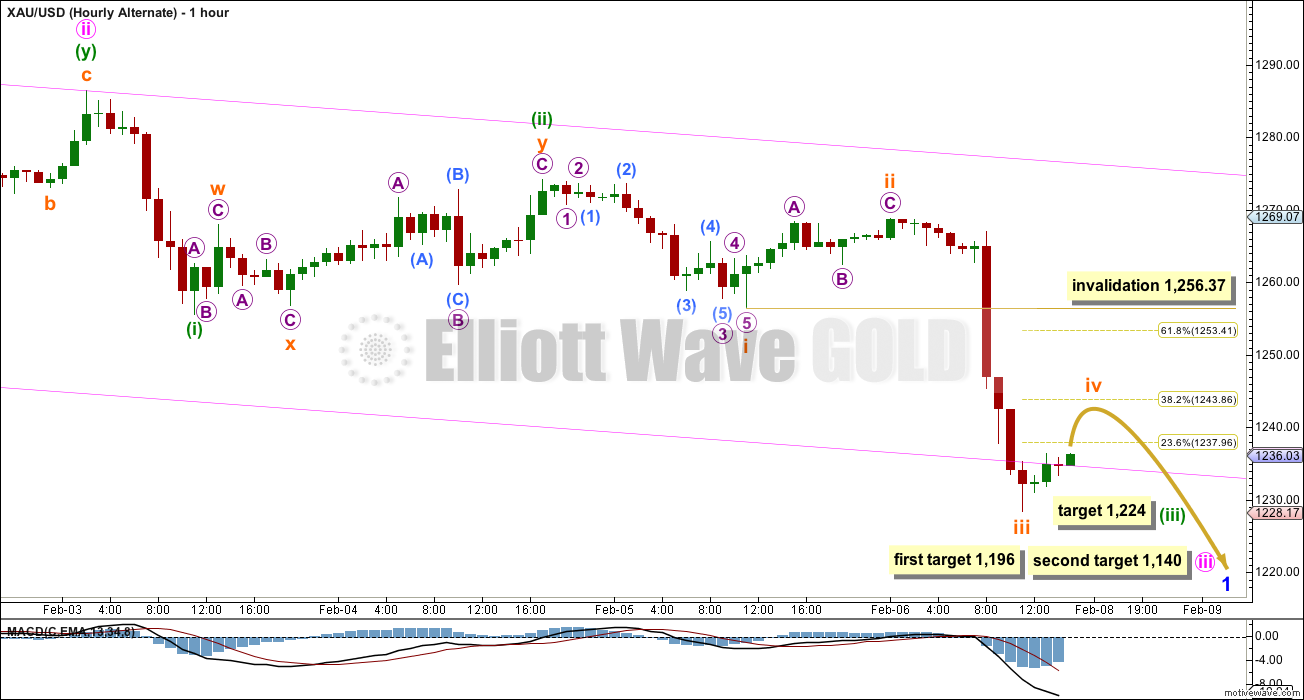
Subminuette wave ii was a deep 70% zigzag correction lasting 12 hours. Importantly, it does not show up on the daily chart. I would expect subminuette wave iv to also not show on the daily chart which means I expect a new low on Monday. Subminuette wave iv is most likely to be a shallow sideways correction ending at either the 0.236 or 0.383 Fibonacci ratios of subminuette wave iii.
Copy the base channel from the daily chart to the hourly chart. The lower edge is slightly breached. The third wave of minute wave iii should have the power to break below support of this lower pink trend line, and once there it should remain below that trend line.
Be aware that Gold often exhibits strong fifth waves, sometimes stronger than its third waves. When each fourth wave correction is over we may see another strong increase in downwards momentum. If the target for minuette wave (iii) at 1,224 is wrong it may be too high. If subminuette wave v is a strong fifth wave typical of commodities then it may end below this target. At 1,194 minuette wave (iii) would reach 2.618 the length of minuette wave (i). This lower target for the middle of this third wave fits only with the lower target for minute wave iii at 1,140.
Subminuette wave iv may not move into subminuette wave i price territory above 1,256.37.
Alternate Daily Wave Count
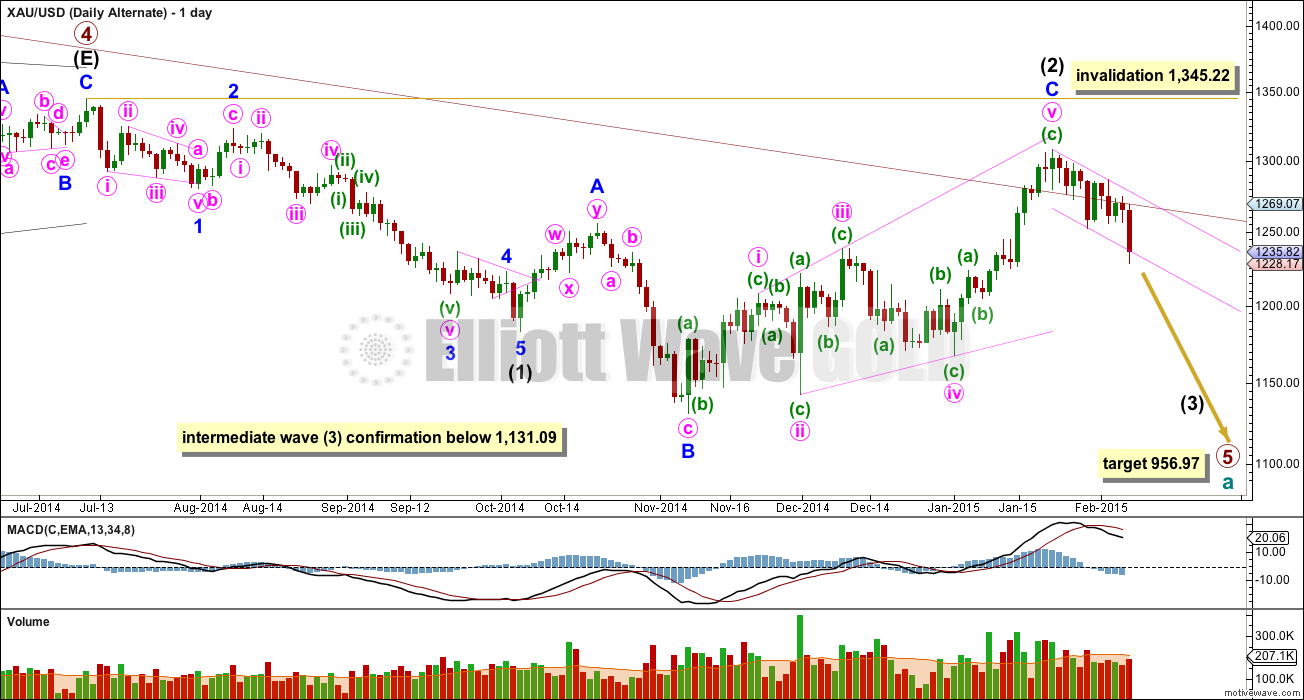
The maroon channel about cycle wave a from the weekly chart is now breached by a few daily candlesticks, and is now also breached on the weekly chart by one weekly candlestick. If cycle wave a is incomplete this channel should not be breached. For this reason and this reason only this wave count, despite having the best fit in terms of subdivisions, only has an even probability with the main wave count. It will prove itself if we see a clear five down with increasing momentum on the daily chart.
Draw the maroon trend line on a weekly chart on a semi-log scale, and copy it over to a daily chart also on a semi-log scale (see this analysis for a weekly chart).
Within primary wave 5 intermediate wave (1) fits perfectly as an impulse. There is perfect alternation within intermediate wave (1): minor wave 2 is a deep zigzag lasting a Fibonacci five days and minor wave 4 is a shallow triangle lasting a Fibonacci eight days, 1.618 the duration of minor wave 2. Minor wave 3 is 9.65 longer than 1.618 the length of minor wave 1, and minor wave 5 is just 0.51 short of 0.618 the length of minor wave 1.
Intermediate wave (2) is now a complete expanded flat correction. Minor wave C is a complete expanding ending diagonal. Expanded flats are very common structures.
This wave count has more common structures than the main wave count, and it has a better fit.
Within an ending diagonal all the sub waves must subdivide as zigzags. The fourth wave should overlap first wave price territory. The rule for the end of a fourth wave of a diagonal is it may not move beyond the end of the second wave.
Although Gold almost always adheres perfectly to trend channels, almost always is not the same as always. This wave count is still possible. The trend channel breach is a strong warning that this wave count may be wrong and we need to heed that warning with caution at this stage.
A new low below 1,131.09 would confirm that a third wave down is underway.
When the first 5-3-5 down is complete on the daily chart this wave count would see it as minor 1-2-3 and the main wave count would see it as minor A-B-C. The following upwards movement will tell us which wave count is correct. If it moves back into price territory of the first 5 down (minor wave A on the main wave count and minor wave 1 for this alternate) then it can’t be a fourth wave correction so the main wave count would be correct. If it remains below the price territory of the first five down then it would be a fourth wave correction and this alternate would be correct. This divergence will not begin for a few weeks.
At 956.97 primary wave 5 would reach equality in length with primary wave 1.
Intermediate wave (2) may not move beyond the start of intermediate wave (1) above 1,345.22. If this invalidation point is passed this wave count would be fully invalidated.
The short term structure, targets and invalidation points are still the same for both wave counts at this stage. They probably won’t diverge for a few weeks.
This analysis is published about 04:03 p.m. EST.
I thing we are in 5 big wave down. I get confirmation down trend on my chart. Daily and weekly.
Lara I understand u also trade PM sector. If I amy ask u to post your trades based on the EWG projections. It will give us some direction.
You market time is different than NY..
Thanks
Papudi – Lara cannot do this as it would be construed as advice. This is not the service on offer.
That is not true if it is written as trade set up not as advise. Many analysts are doing by stating “I bot”.
I rarely trade, and usually only Forex.
I do not have the intention of turning this site into a trading advice site, and I don’t want to have to offer up my trading account to public scrutiny nor to scrutiny from authorities.
Lara, thanks for your work!
Are you doing similar analysis for Forex (EUR/USD, GBP/USD, etc.)?
Mostly ATM for NZD/USD.
EW analysis and lots of trend line analysis.
I publish my NZD/USD here for members only periodically.
Here is my count for subminuette wave iv. If incorrect please clarify.
a – 1,243.69 at 5:29 am
b – 1,236.16 at 8:59 am
c – 1:53 pm in wave 3 of c which may top above 1,243.69 then wave 5 will top above that and below 1,256.37 invalidation point.
Then subminuette wave v down may begin.
Earnings Reports to Test Mettle of Miners ETFs Feb 9, 2015
http://finance.yahoo.com/news/earnings-reports-test-mettle-miners-163031772.html
Miners earnings reports coming out over next two weeks.
Meanwhile the money is moving out of GDX into DUST.
Will a break of 1244 take up into the 60’s? Hmmm, expected a continuation today, but appear to be handing back Friday’s gains.
I think that it requires more time, not depth. It is possible it is over already.
There is a confluence of retracement levels at 1261-62 which should provide resistance. On the other hand, a break above 1251-52 opens up 1270-71.
Subminuette iv is starting to get out of proportion with i. This will change hourly count but I’m not seeing an alt hourly at the moment.
With 1236/35 holding, gold price appears to be heading for 1246-47 with 1253/54 on the outside. Looks like gold price is heading for an inside day.
Under alt wave Lara wrote: “The fourth wave should overlap first wave price territory. The rule for the end of a fourth wave of a diagonal is it may not move beyond the end of the second wave.”
Any one pls explain price range of first wave price territory and which second wave?? 1285?. 1269?
I hope Lara includes prices in such important messages. Some of new to EW can not recognizes which waves??
The full paragraph is:
“Within an ending diagonal all the sub waves must subdivide as zigzags. The fourth wave should overlap first wave price territory. The rule for the end of a fourth wave of a diagonal is it may not move beyond the end of the second wave.”
Don’t take just one part of the paragraph, its intended to be read as a whole.
I’m referring there to the big structure for minor wave C, the big ending diagonal.
Keen to appreciate the difference between Target 1224 and First Target 1196.
There is a big difference.
Gold hit 1,242.74 at 3:31 am only $1 from subminuette wave iv target of $1,243.86. I was looking for that target to buy DUST again.
I have bought JDST this afternoon. However, miners have had a boost today so may regret this decision.
The difference is time. 1,224 is a short term target.
1,197 is a longer term target.
I am seeing silver for sale at $0.49 over spot. I don’t have any historical data to prove this, but I seem to recall in the past that low premiums over spot was a danger sign.
I’ve seen same thing for years. IMO it accurately reflects public sentiment, and is a useful medium-term indicator.
Similar to the premium on ETF. For example the PSLV silver ETF sold for 20-30% premium during the run from $17-$50. As silver collapsed, the premium got wiped out and went slightly negative.
Weekend reading material .
This post from Rambus on PM sector annihilation /capitulation yet to come.
http://www.kitco.com/ind/Tablish/2014-09-26-Precious-Metals-Bear-Phase-III-Dead-Ahead-Part-1.html
http://www.kitco.com/ind/Tablish/2014-11-03-Precious-Metals-Bear-Market-Phase-III-Part-III-The-Strategy.html
LARA has been ahead of this road map. AND soon the alt wave will be the main wave.
Updated GDXJ chart is posted below:
Papudi, nice chart, your final target is $15.30 GDXJ?
Sorry It is not mine but the author of the report. I have been watching this annihilation develop since middle of 2014.
Updating a COT analysis chart from last week. This is obviously lagging data. Supports the counts above and some other charts people are posting. The Bank Participation Report looks scary bearish.
GDX H-A daily chart shows .618 fib from last summer high was reversal point this week.
Hi. It would be interesting to see how much of a downside punch gold price can pack in. Gold price bounced off from just above 50dma / lower Bollinger coming in around 1226/27…. Stochastic is oversold, hourly RSI is tagging below 30 and ADX is being supportive for some upside, a good advance is possible from current levels…. Upside limitations apply but on the downside, there is a confluence of retracement levels 61.8% of 1167/1308 and 50% of 1132/1308 both coming in at about 1220/19. So really, for gold price to get below 1228 very quickly looks to be a tough ask and it will be very interesting to see Gold price chisel away and break below this restrictive zone for target 100dma at 1216 taking the Bollinger down wit it!! YES!
After reviewing gold charts alt daily wave count is coming closer to becoming primary wave. May be in a 2 to 3 weeks.
Time for 3xetf trades. Miners are in impulse move down soon.
Here is an example of GDXJ HnS the 1st NL is broken and next week the second.
I was watching this in real time all day. More later. Because of Lara EW I was anticipating GDXJ will gap down from 9ema below the NL.
The trendline from the recent low might be attracting GC down. POG pretty bearish. An overshoot by 5-6 bucks might be the 1194-1196 overshoot. Perfect wave iv opportunity and a chance for POG to show its stuff (if its got any). Personally, I believe $1,000 will be tested before all is said and done. The miners are *still* way undervalued to the POG.
I really like this Rambus Feb 4th chart showing the HUI (Miners Index) dropping more than 50% from where it is today. From 220 down to 110 or even 88.
Below is a slightly different look at the downtrend channel that I originally showed you about 4 or 5 months or so ago. It’s what they call a double downtrend channel where you have an outside trendline, dashed, on both sides of the main downtrend channel. As you can see the HUI is now in its third week of testing the outer black dashed trendline from below. The higher pink shaded area shows the first impulse move down in time and price. I’ve added the lower pink shaded area, which is exactly the same size as the higher one, that may show us where to look for the ultimate low in November of this year.
http://static.safehaven.com/authors/rambus/36602_g_large.png
This is from much longer Rambus article.
http://www.safehaven.com/article/36602/wednesday-reportthe-chartology-of-the-hui-past-present-and-future
Currency analyst is looking for a test of the next support level at $1,221 an ounce. He added that he could see gold prices fall to $1,210 an ounce, “because we have seen a significant breakdown of the technical pattern.”
http://www.kitco.com/news/2015-02-06/Gold-Could-Suffer-Next-Week-As-Market-Expectations-Shift-To-June-Rate-Hike-Analysts.html
Only problem with that is as soon as they mainstream gets bearish , the move down is probably over . I would prefer to hear more bullish talk , bottom picking etc .
But he does add at end of article that he is bullish long-term so that’s good .
Hehe….
Friday analysis is published about 04:03 p.m. EST.
I didn’t see an email yet!
A lot of us just pay for advice… We don’t need all of this excessive rah, rah, rah, rah, rah, rah, rah, rah all of the time. It’s gets to be very irritating…and it’s not just you…
Lara’s email went out at 4:55 pm. I sent notice at 4:06 pm that may of disturbed you yet made the day for others hoping to do after hours trading once they get the new analysis.
Those who aren’t interested in any positivity around when the counts make us profits are entitled to their opinions. However we who enjoy celebrating our successes and thus attracting more successes according to the Law of Attraction are entitled to our opinions. Being happy, we won’t let you rain on our parade.
If these comments upset you you are entitled to switch them off at your end, since you say you don’t need them. I don’t do anything irritating. That is only your perception.
Lara will send you the advice even if you shut this comment section off, which is for members to share opinions, strategies, advice, concerns, associated information, and rah, rah, rah, celebration that things went well and we made profits our number one goal here.
Have a great weekend. I will.
For a guy with a 3 monitor resume every time gold makes a move you sure seem to be lost. Constantly asking for help. Asking for help is fine but don’t pretend to be something you’re not. Time to grow up and Man up…
hey scott, i think I’m a little technically challenged so I don’t get the hits on my cell that r annoying u. I like the diaspora of ppl that contribute to the trading group. No need to hate, it ain’t high school, they all take their losses and gains in dollars like us so who cares? Why not short the ideas that don’t vibe as another indicator? In the US, we have free speech, and respect that for our inherent strength. Figure it out and use it to your adv bro. Just saying….or contribute to the group with something useful out of the box kinda vibe and add to the brain-drain melting pot (if that works for u). sry… I’m eccentric as it is…but just saying.
Richard, with all due respect you have had mulitple people come out asking you to quit clogging up things with comments that do not have any bearing in helping someone trade, such as the time and date stamp lara writes an analysis everyday and how good or bad your trade goes. I’m all for everyone commenting and learning but all people ask is to keep it to pertinent info only. Some people like to go through the comments looking for credible traders advice to help them make trading decisions and it takes forever because 90% of the comments are yours which are filled with laras quotes from the day before and your emotional feelings from recent trades.
I don’t find your comment respectable or accurate however you are entitled to your opinion.
I have made a reply to this portion of the comments thread, which has touched on this matter before, in the following day’s video. Right at the start.
I will ask that all members all of the time have a polite and respectful tone. I will enforce this standard of tone.
There are comments in this portion of this thread which do not meet this standard. Please read the comments policy.
I’m conflicted here, but I do think that comments threads are turning into a “hangout” for members, which is actually a good thing.
I don’t have a problem with members communicating to each other real time while they’re trading here.
I don’t have a problem scrolling through looking for comments directed towards myself which I need to answer.
I don’t read all of the comments.
All I ask is that members read the comments policy, are polite and respectful towards each other, and exercise tolerance and patience.
I don’t think it has to be one or the other; what some judge useful information (which others may judge not useful) vs a hangout place for traders.
I just can’t see why it cannot be both.
I just scroll. Fast.
Scott, please read the comments policy.
tol·er·ance
ˈtäl(ə)rəns/
noun
1.
the ability or willingness to tolerate something, in particular the existence of opinions or behavior that one does not necessarily agree with.
Richard, I think it would be better if you post inside the conversation for the *previous* day that Lara’s new analysis is out. I think other(s) here were simply pointing out that posting within the new analysis that the new analysis is out, is rather redundant. Hope that helps.