
A shallow fourth wave correction was expected, but I had expected it to be more brief than it is turning out to be.
Summary: When this fourth wave correction is over a fifth wave down should unfold. The target for this next wave down is 1,224, but be aware sometimes Gold exhibits strong fifth waves typical of commodities. If the next wave down is particularly strong a second target may be 1,193. Low volume for the green candlestick of 9th February supports the wave count.
Click on charts to enlarge.
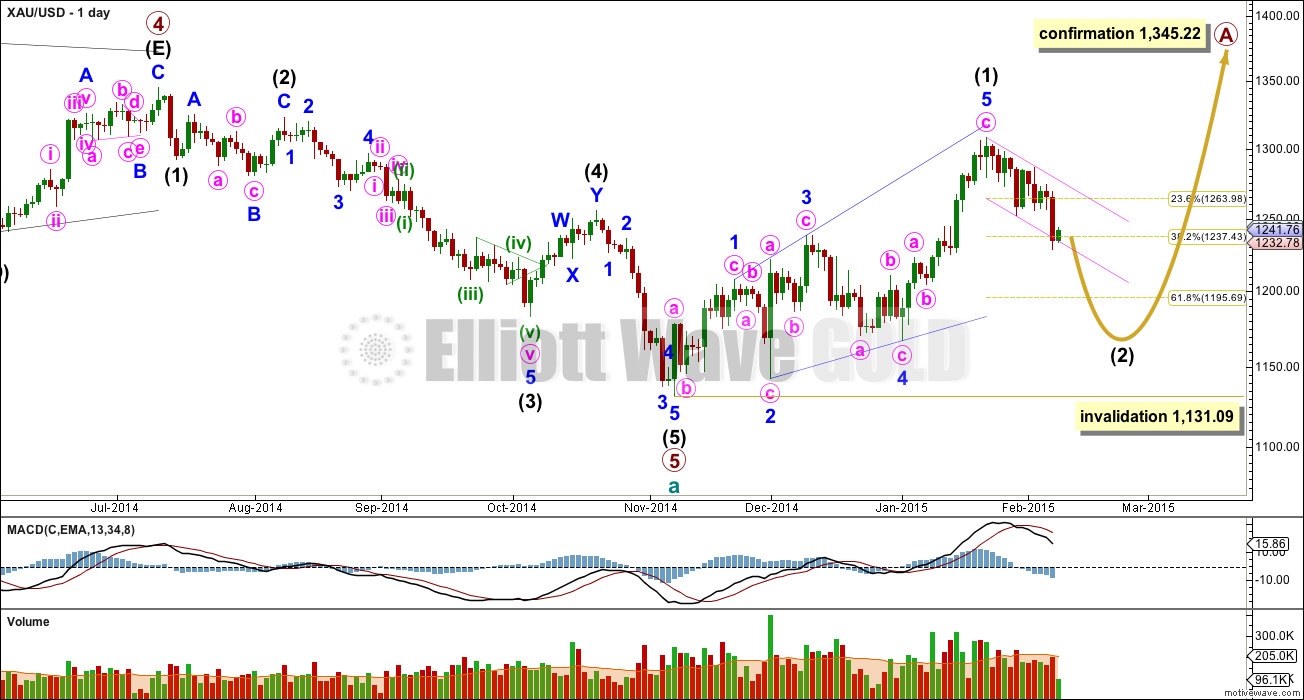
Main Daily Wave Count
At this stage I judge this main wave count to have an even probability with the alternate below. I will let the structure of downwards movement, and momentum, tell us which wave count is correct over the next few weeks. At this stage they both expect more downwards movement so there is no divergence in the expected direction.
This wave count sees a five wave impulse down for cycle wave a complete, and primary wave 5 within it a completed five wave impulse. The new upwards trend at cycle degree should last one to several years and must begin on the daily chart with a clear five up.
The first five up may be a complete leading expanding diagonal. Within leading diagonals the second and fourth waves must subdivide as zigzags. The first, third and fifth waves are most commonly zigzags but they may also be impulses. This wave count sees minor waves 1, 3 and 5 as zigzags.
Leading diagonals are almost always followed by deep second wave corrections, sometimes deeper than the 0.618 Fibonacci ratio. This wave count expects a big deep correction downwards, and it should subdivide as a clear three on the daily chart (the alternate below expects a five down).
My biggest problem with this wave count, and the reason I will retain the alternate, is the structure of intermediate wave (2) within primary wave 5. This is a rare running flat but the subdivisions don’t fit well. Minor wave C should be a five wave structure, but it looks like a clear three on the daily chart. If you’re going to label a running flat then it’s vital the subdivisions fit perfectly and this one does not. This problem is very significant and this is why I judge the two wave counts to be about even in probability.
Intermediate wave (5) looks like a zigzag rather than an impulse, and has a corrective wave count. This is also a problem I have with this wave count.
Intermediate wave (2) is most likely to subdivide as a zigzag, which subdivides 5-3-5. When this 5-3-5 is complete then how high the following movement goes will tell us which wave count is correct.
Intermediate wave (2) of this new cycle degree trend may not move beyond the start of intermediate wave (1) below 1,131.09.
From January 23rd onwards, since the expected trend change, volume is highest on down days. This supports the idea that we may have seen a trend change and the trend is now down. Volume for Silver is even clearer, with a big spike on the down day there for 29th January. The very low volume for Monday 9th February session further supports the idea the trend is currently down.
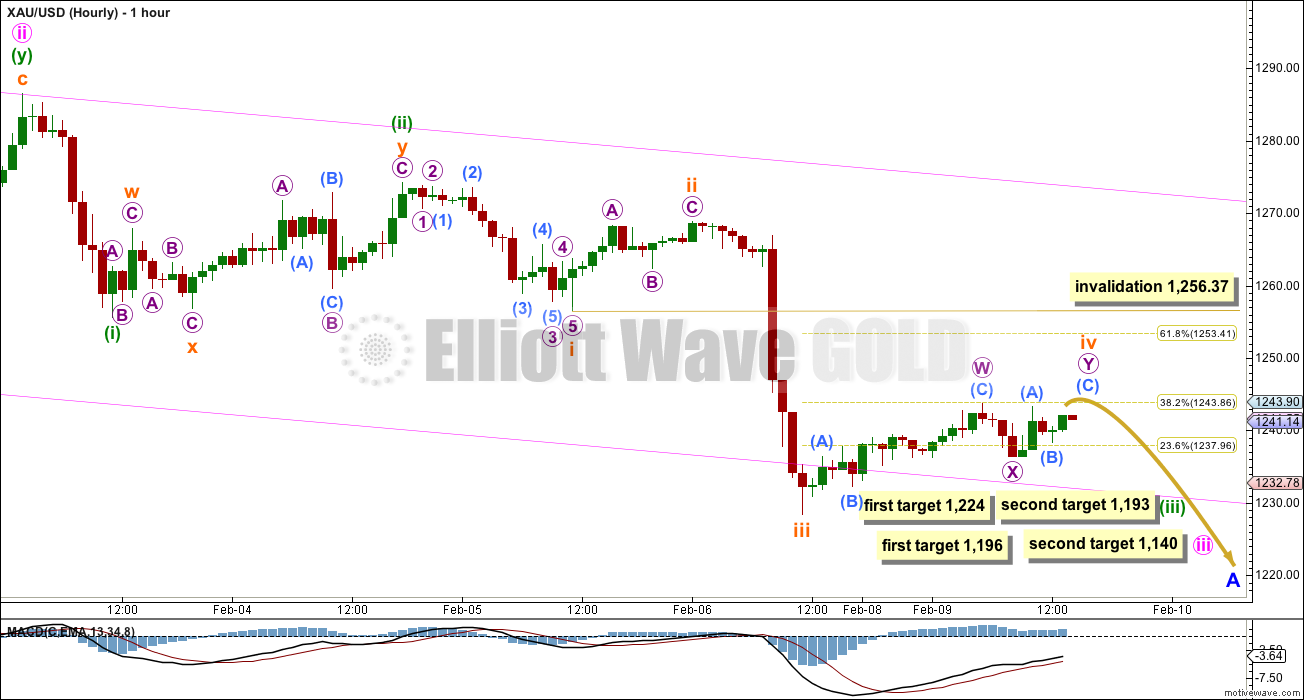
Subminuette wave iv is showing up on the daily chart as a green candlestick which was not what I had expected. However, I am struggling to see minuette wave (iii) as completed, and so I cannot see how this current correction is minuette wave (iv). This wave count, despite subminuette wave iv being longer in duration with subminuette wave ii, still has mostly the right look at the hourly chart level. The structure is incomplete and I expect more downwards movement.
At this stage subminuette wave iv may be a double zigzag which is incomplete, or it may yet morph into a double combination which would provide better alternation with the single zigzag of subminuette wave ii. It is exhibiting alternation in depth: subminuette wave ii was a deep correction and subminuette wave iv is so far shallow. I would not expect it to end much above the 0.382 Fibonacci ratio.
At 1,224 minuette wave (iii) would reach 1.618 the length of minuette wave (i). If subminuette wave v is a long strong fifth wave typical of commodities then this first target may be too high. A second target at 1,193 would see minuette wave (iii) reach 2.618 the length of minuette wave (i).
Copy the base channel from the daily chart to the hourly chart. The lower edge is slightly breached. The next wave down should have the power to breach support at this trend line, and once that is done price should remain below that line.
Subminuette wave iv may not move into subminuette wave i price territory above 1,256.37.
Alternate Daily Wave Count
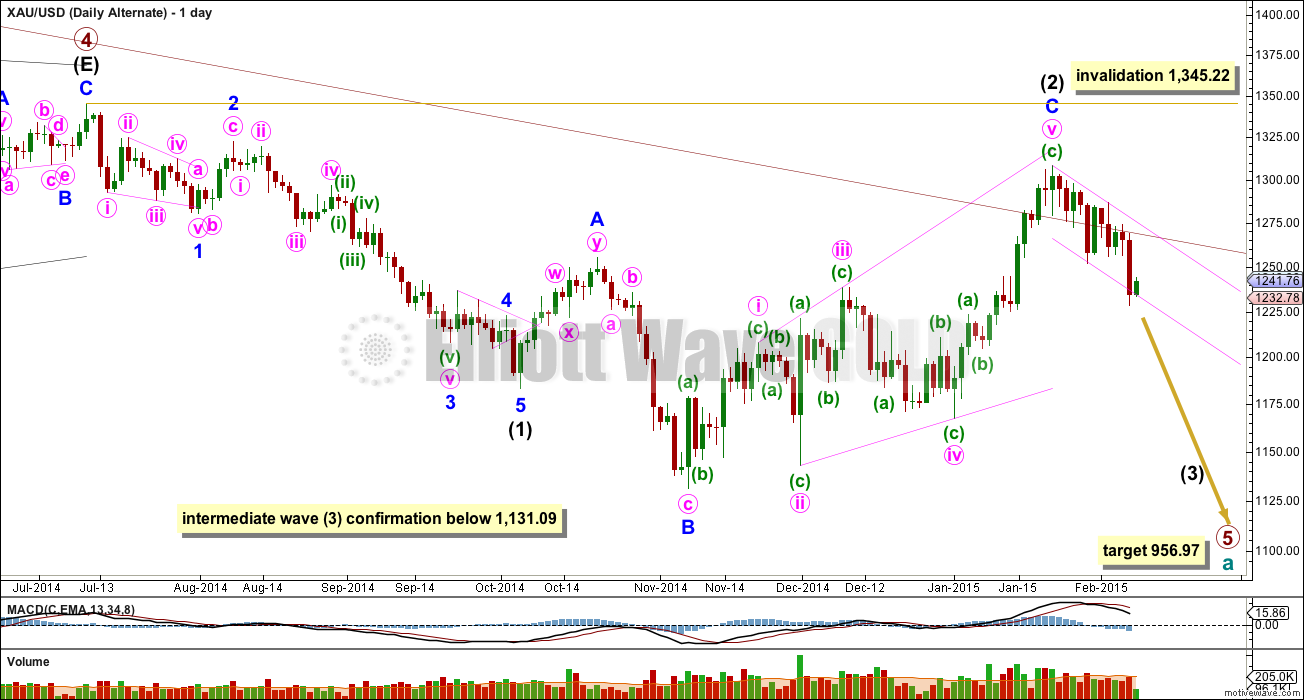
The maroon channel about cycle wave a from the weekly chart is now breached by a few daily candlesticks, and is now also breached on the weekly chart by one weekly candlestick. If cycle wave a is incomplete this channel should not be breached. For this reason and this reason only this wave count, despite having the best fit in terms of subdivisions, only has an even probability with the main wave count. It will prove itself if we see a clear five down with increasing momentum on the daily chart.
Draw the maroon trend line on a weekly chart on a semi-log scale, and copy it over to a daily chart also on a semi-log scale (see this analysis for a weekly chart).
Within primary wave 5 intermediate wave (1) fits perfectly as an impulse. There is perfect alternation within intermediate wave (1): minor wave 2 is a deep zigzag lasting a Fibonacci five days and minor wave 4 is a shallow triangle lasting a Fibonacci eight days, 1.618 the duration of minor wave 2. Minor wave 3 is 9.65 longer than 1.618 the length of minor wave 1, and minor wave 5 is just 0.51 short of 0.618 the length of minor wave 1.
Intermediate wave (2) is now a complete expanded flat correction. Minor wave C is a complete expanding ending diagonal. Expanded flats are very common structures.
This wave count has more common structures than the main wave count, and it has a better fit.
For this alternate wave count the diagonal is an ending diagonal for minor wave C. Within an ending diagonal all the sub waves must subdivide as zigzags. The fourth wave should overlap first wave price territory. The rule for the end of a fourth wave of a diagonal is it may not move beyond the end of the second wave.
Although Gold almost always adheres perfectly to trend channels, almost always is not the same as always. This wave count is still possible. The trend channel breach is a strong warning that this wave count may be wrong and we need to heed that warning with caution at this stage.
A new low below 1,131.09 would confirm that a third wave down is underway.
At 956.97 primary wave 5 would reach equality in length with primary wave 1.
Intermediate wave (2) may not move beyond the start of intermediate wave (1) above 1,345.22. If this invalidation point is passed this wave count would be fully invalidated.
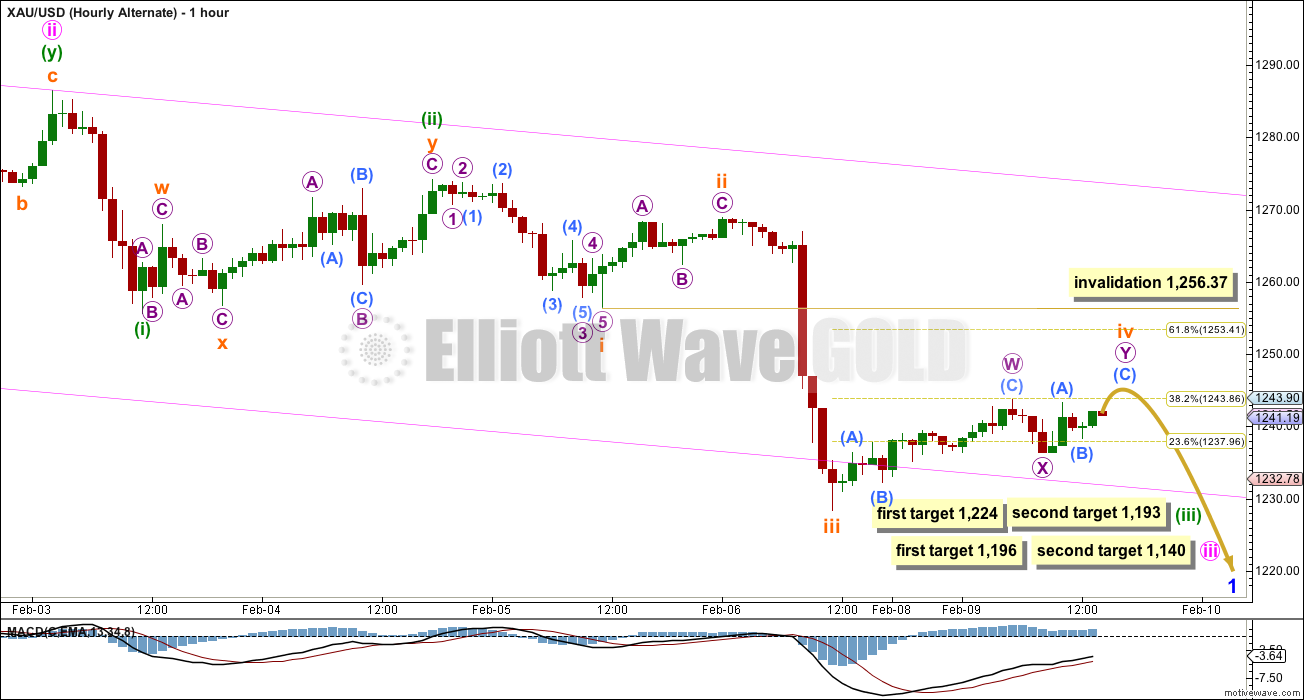
The short term structure, targets and invalidation points are still the same for both wave counts at this stage. They probably won’t diverge for a few weeks.
This analysis is published about 03:22 p.m. EST.
Feb 10 report is posted
Nice.
I believe wave 4 of minuette wave (iii) retraced to 1,239.94 at 10:46 am very close to .618 of the drop from 1,245.99 high at 1:05 am down to 1,232.36 low at 9:36 am. I believe gold is in wave 5 of minuette wave (iii) now.
With 1233/32 holding, I am just
wondering if the downside target of minuette wave iii has been met at 1232.xx
instead of projected 1224? Or is there more downside to follow for a break
below 1232 with 1241/45 curtailing? Interesting!
Now gold is in wave 5 of minuette III. This must move below the bottom of 3rd. i dont see the reason to question the count at this stage.
Lara, I’m going to throw this suggestion out to you and the members… I noticed many of you are trading DUST and I’m wondering if GDX is the correct index?. When I began trading gold we used $hui until $gdx became the popular goto index, perhaps we should re-review and ensure we are following the right chart/s. For exmaple… Occasionally I play Canadian leveraged ETFS and they follow the S&P/$TSX global fund index. $sptgd on Stockcharts.com or $ttgd on Barcharts.com I find that this index better suits Lara’s main gold count. It may be wise for us to examine this question and find out which index is better suited for our needs rather than to follow what’s popular. Anyone else questioning GDX? Comments welcome…
GDX, DUST, and NUGT are all based on the same Underlying Index: NYSE Arca Gold Miners Index. No need for a change.
Arca gold miners index is $GDM not ETF GDX
True. GDX still works well.
Actually it doesn’t work well, that’s why we’re struggling with its reflection on pog
Jaff–GDX is “the real thing”, GDX is it’s own unique real thing.
GDX is not and was not ever meant to be a reflection of POG, No index of miners can ever be a true reflection of the POG.
True that. They are different things. Back in the days when you couldn’t practically trade gold, some folks used gold stocks as a proxy for gold. But then gold was securitized and made into derivatives, which took over, and price correlation has worsened ever since.
Jaff–from Yahoo Finance profile on GDX.
“seeks to replicate as closely as possible, before fees and expenses, the price and yield performance of the NYSE Arca Gold Miners Index”
So do you want the replica or the real thing?
Exactly my point.
Sure. If members want me to provide charts for something other than GDX then let me know, and please provide a link to a data source where I can download data in .csv format. Yahoo Finance is a great source, anything there is easy for me to get.
Lara–I vote to stick with GDX. As Oliver Twist in classic Charles Dickens novel said: May I have more GDX please!
Charting GDX supports not only GDX but also DUST and NUGT. Many in USA with retirement accounts are legally restricted from using gold options so use DUST and NUGT as leverage. Volume is high–GDX, DUST and NUGT becoming rapidly more popular.
I agree with using GDX as it is the biggest gold mining ETF in the world with even a lot more volume than GLD.
Yeah but, GLD value is 6X higher than gdx. Also, you you are comparing an entire index against a single . That is like comparing one city with an entire continent.
GDX trades about $100-billion a year. I thkink GLD trades somewhat more, or used to before GLD holdings plunged.
But $1.5 Trillion of gold is traded annually just on FXCM. So that one platform trades 1500X more GOLD than the global trade for gdx. That’s why gold is a far superior trading instrument with 24-hour trading and much better data feeds.
J. Does the recent near bankruptcy of FXCM cause alarm, do you still consider FXCM a safe place to have funds?
Good question.
All customer accounts and positions must be kept in segregated accounts, such as in Bank of America in the case of FXCM. Bank of America isn’t a great bank IMHO.
So your exposure is: 1) are client accounts truly segregated (recall that at MF Global they weren’t, fraudulently);
2) How solvent is the custodian?
The EURCHF peg break did cause some brokerages and even small banks to fail, especially those offering significant FX trading, as customers couldn’t cover their sudden huge losses. In other cases, some banks had bad proprietary trades (personally, I think banks should be banned from prop trading and Glass-Steagall should never have been repealed). I’m cautious, even paranoid, about where I keep assets. Numerous financial institutions should fail in the coming years whenever another so-called black swan lands. For example, some banks are likely already in trouble with the sudden and sustained collapse in oil.
I figured that would be the knee jerk reaction…
Here’s a summary written by Lorimer Wilson:
(Note, GDX is not pure gold)
The HUI Index
The AMEX Gold BUGS (Basket of Unhedged Gold Stocks) Index (HUI) is a modified equal dollar weighted index of 16 large-cap (80%) and medium-cap (19.5%) gold mining companies that do not hedge their gold beyond 1.5 years. The 3 largest companies make up 41% of the index by weight with the remaining 13 companies, at 4% – 5% each, making up the balance. Go here for current information.
The XAU Index
The Philadelphia Gold and Silver Sector Index (XAU) contain 16 large (83%) and medium (15%) capitalization weighted companies engaged in the mining of gold, silver and copper. The same 3 largest companies as in the HUI account for 51% of the index by weight. As such, the XAU has a large-cap bias. Go here for current information.
The SPTGD (XGD) Index
The S&P/TSX Global Gold Index (SPTGD) consists of 64 modified market capitalization-weighted companies (78% large-cap; 19% medium-cap) involved in precious metals (primarily gold) mining. The 3 largest cap companies dominate the index with 42% by weight. A proxy for the index is the XGD which trades in Canadian dollars on the Toronto Stock Exchange. As such, the XGD has a currency bias which is explained below. Go here and here for current information.
The GDM (GDX) Index
The NYSE Arca Gold Miners Index (GDM), as represented by the GDX etf (seehere for details), is a modified market capitalization weighted index of 30 companies (72% large cap; 22% medium cap) involved primarily in the mining of gold and silver. The 3 largest cap companies again dominate the index (at 30% by index weight) but to a much lesser extent than in the HUI (41%), the XAU (51%) or the XGD (42%). As such, the GDM/GDX has a medium-cap bias. Gohere for current information.
The CDNX Index
The S&P/TSX Venture Composition Index (CDNX) consists of 558 micro cap companies of which 44% are involved in the early stages of the exploring, developing and/or mining and 18% in oil and gas exploration. This is the only index that gives insight into the price trends of micro-cap companies almost exclusively (99.4%). The CDNX is valued in Canadian dollars and, as such, has a currency bias like the XGD. Go here for current information.
How Best to Apply the Various Gold:Gold Stock RatiosThe Gold/HUI, Gold/XAU and Gold/GDX Ratios The Gold/HUI, Gold/XAU and Gold/GDX ratios divide the daily close of the price of gold by the daily close of the value of the particular index and, when charted over time, provide an excellent running representation of relative strength and weakness between the two variables. That being said there are significant differences between these indices, as follows:
the Gold/XAU ratio emphasizes what is happening primarily in relation to the large-cap producers;
the Gold/HUI ratio emphasizes what is happening in relation to the large/medium-cap producers;
the Gold/GDX ratio emphasizes what is happening primarily in relation to the medium-cap producers
The Gold/XGD and Gold/CDNX Ratios The Gold/XGD and Gold/CDNX ratios, on the other hand, compare gold denominated in U.S. dollars with stocks denominated in Canadian dollars. This has the potential of skewing the results depending on the strength of the two currencies relative to each other and, as such, should not be used when evaluating the trends of their constituent stocks with that of gold bullion.
(To develop your own G/GS ratio chart go to http://www.stockcharts.com and type in $GOLD:$HUI, $GOLD:$XAU, etc. for the time frame you wish to examine.)
The CDNX/XGD Ratio To identify developing macro trends between large/medium cap producers and micro/nano precious metal explorers (the juniors) the ratio to follow closely is that of the CDNX/XGD which, in addition to highlighting the two different ends of the spectrum, are both valued in Canadian dollars.
As mentioned above, the XGD index follows the performance of 64 large, medium and small-cap companies and the CDNX that of 558 micro-cap companies. Comparing the divergence of each index to the other is an ideal way to determine if a developing trend is equally affecting all mining shares in general, just the large/medium/small-cap sector or just the micro-cap venture capital sector.
The CDNX to XGD comparison works better than that of the CDNX to any one of the other mining sector indices in that both the CDNX and the XGD are traded on the Toronto Stock Exchange in Canadian dollars whereas the HUI, XAU and GDX indexes are denominated in U.S. dollars and, as such, are susceptible to the influence of exchange rate variances when comparing any one of them with the CDNX.
Gold sector analysts and commentators always assume that the large-cap dominated indices, either alone or in relation to gold, indicate the true current trend of the entire precious metals mining sector but that is simply not the case. In doing so they ignore the health and, as such, the price performance of the micro-cap gold and silver exploring/developing/mining companies which represents in excess of 80% of the total number of companies in the precious metals sector. A comparison of the CDNX with the XGD reveals a much more accurate picture of what is truly happening in the gold mining sector.
Conclusion
So there you have it. You now know the strengths and weaknesses of the more popular gold stock indexes, which ones to use when determining their relationship with gold bullion based on their market cap and how to compare the performance of the large/medium cap sector with the micro/nano-cap sector.
Never again put any credence in any analysis you read that has not made the distinctions discussed above. All gold stock indexes are not the same. Each has its own bias. Each tells its own – and different – story.
Lorimer Wilson is Editor of http://www.FinancialArticleSummariesToday.com (F.A.S.T.) and http://www.MunKnee.com (Money, Monnee, Munknee!) and an economic analyst and financial writer. He is also a frequent contributor to this site and can be reached at editor@munknee.com.”
Furthermore, Here is the Popular Horizon Beta Pro ETF from their website
The Horizons BetaPro S&P/TSX Global Gold Bull+ ETF (HBP Gold Bull+ ETF) and the Horizons BetaPro S&P/TSX Global Gold Bear+ ETF (HBP Gold Bear+ ETF) seek daily investment results equal to 200% the daily performance, or inverse daily performance, of the S&P/TSX Global Gold Index™, before fees and expenses. The Index consists of securities of global gold sector issuers listed on the TSX, NYSE, NASDAQ and AMEX
Lara, how about US Oil and Silver, please? Oil has been extremely volatile but there has not been an oil chart for over a month. Silver also went a month before an update Jan 15.
No cares whether or not there are gold-stock updates for some interested folks here, except that, sadly, these appear to have come at the loss of oil and silver updates? It’s been raised as a question on a trading forum by some of us longtime subs and fans there.
Thank you.
Something just doesn’t feel right about the short term wave count and I can’t put my finger on it
possible subminuette IV wave count
Now big deal task is to recognize where Minuette III ends and how deep will minuette IV be. Any signs that point to one of the scenarios drew by Lara?
Minuette iv bounce can be expected to be .618 fib from end of minuette iii?????. target iii is 1224 or 1196???
In my opinion higher target of 1224 should be moved to 1226, because end of IV was 2 pts higher than expected. But most important is to recognize if it ends somewhere there or continues lower. Perhaps it will bounce from there anyway… so reducing position there and see how it unvails can be good way of playing it.
“I would expect the upcoming
minuette wave (iv) to also show on the daily chart and to last at least two
days.” As per February 5th analysis.
Thanks mate!
Gold heading for Lara’s target today. Sell DUS/JDST when gold bottoms and wait for wave iv correction. ????
yeeha ! !
Lara,
Regarding “…subminuette wave iv may be a double zigzag which is incomplete, or it may yet morph into a double combination…”
Would a double combination mean the current Micro labels W-X-Y would become A-B-C (W) and the first part of combo “W” is near complete? Or, how would the first part of a double combo be labeled? Thank you for your help with this.
A double combination and a double zigzag are labeled the same: W-X-Y. What I mean with that comment is the second zigzag in the double, Y, could morph into a flat correction making the whole structure a combination (zigzag – X – flat) rather than a double zigzag.
I would anticipate minuette wave (iv) to be shallow because minuette wave (ii) was deep %
oh, Thank you for that explanation. It clarifies alot. So it means with a Y morphing – if thats even what happens- structure just pushes the Y ending point out further….. Can hardly wait for your analysis today… where are we?
testing a personal and novel astrological concept with respect to the movement of the Sun within its current nakshatra span (panchak, Sun in 2nd pada Dhanishta) – could wave 4 ended around 3pm EST today? Thx in advance for any insight.
hi jay,it’s looking u have deep knowledge of panchang and astrology,
can u suggest any books on astrology?
Astrology of the Seers by Dr. David Frawley.
I believe subminuette wave iv ended at 1245.99 at 1:05 am Tuesday.
yeeha!
Lara, can you _p_l_e_a_s_e_ find a way to adjust the color of your submicro chart labels? They are not showing up as auqa, which you have identified in your legend. It really throws me off when perusing. Or maybe the legend should be changed to show a light blue and a darker blue. P_l_e_a_s_e_.? Thank you for considering.
Okay. I’ll relabel it light blue rather than aqua.
If I make the blue lighter they’ll be even harder to see.
Oh thank you! 🙂 But darn that aqua it can’t be charted/seen. It really is pretty