
Elliott wave analysis of TSE:TTGD, in response to requests from members.
The data is from a Google feed (I think) sent to me in .csv format from a member, Aleks.
The data only goes back to 13th Feb, 2013 so this analysis cannot give a long term prediction for this market.
I noticed the same problems as I have with GDX. Specifically, I cannot see time frames below daily, the market appears to have quite a few gaps (which may actually be useful from a more traditional TA point of view), it does not have typical looking Elliott wave structures, and either exhibits truncations readily or its threes don’t look always like threes and its fives don’t always look like fives.
For these reasons I expect that my analysis of this market will not be as reliable as my analysis of Gold.
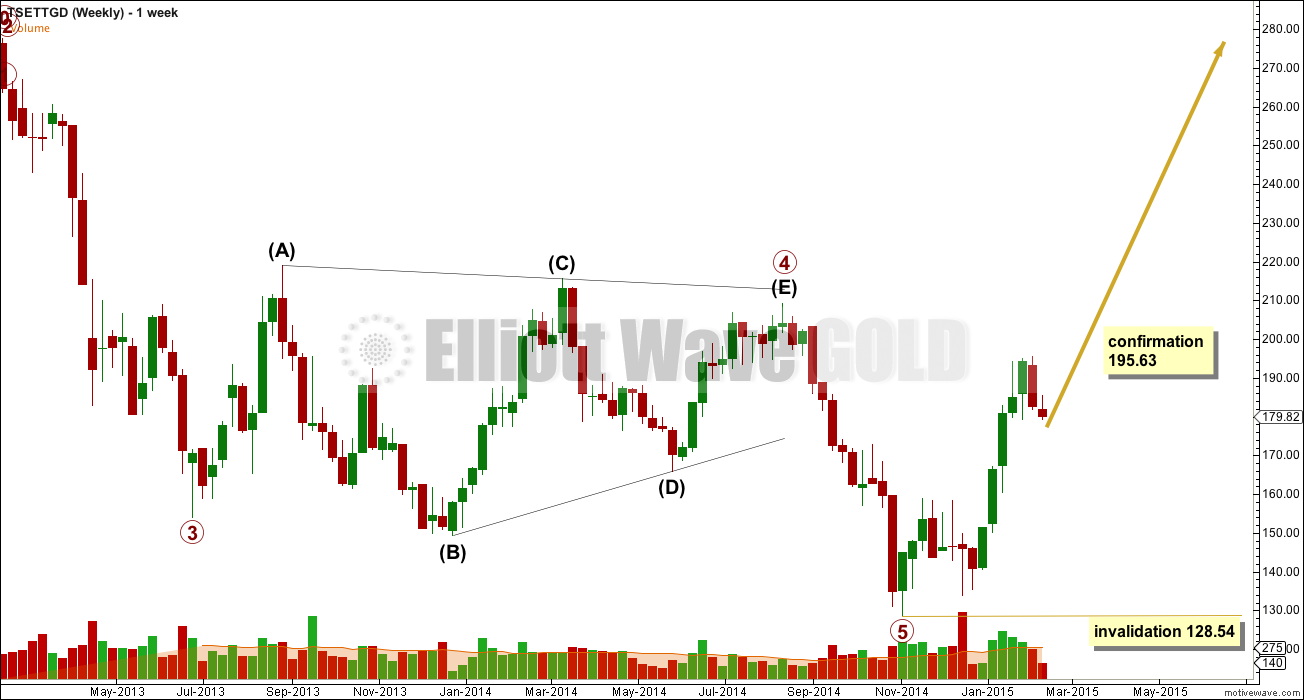
I cannot know where primary wave 3 began, and I cannot know how long primary wave 2 lasted. I am making some assumptions with this wave count: that it follows the same five down form as Gold, GDX and Silver. Although this seems a safe assumption, the fact that it is made reduces the reliability of this analysis.
Because I cannot see how primary waves 1, 2 and the start of 3 unfolded for this market, I cannot be sure how primary wave 5 should look. I also am unable to draw a channel about this downwards movement, and so I do not know if a channel has been breached or not.
The size of the recent upwards movement from the low looks like a new wave. It looks like (with the limitations on the data I have) that a new bull market should be beginning. This requires confirmation from two things:
1. A new high above 195.63.
2. The completion of a clear five wave impulse upwards.
If a new bull market has begun then a five up is close to completion.
This market has horrible Fibonacci ratios within its waves (or my analysis is completely wrong, but I don’t think so).
Within the downwards trend:
I am seeing intermediate wave (2) as a relatively deep .55 zigzag, and intermediate wave (4) as a shallow 0.25 double zigzag. There is alternation in depth but inadequate alternation in structure (or this part of the wave count is wrong). The double zigzag does not look like a double zigzag: the second zigzag in the double should deepen the correction, not end short of the first. I don’t think this is a double combination because there is no flat in either minor waves W or Y.
Within primary wave 5 there are no Fibonacci ratios between intermediate waves (1), (3) and (5).
Within intermediate wave (1) there are no Fibonacci ratios between minor waves 1, 3 and 5.
Within intermediate wave (3) there are no Fibonacci ratios between minor waves 1. 3 and 5.
Within minor wave 3 there are no Fibonacci ratios between minute waves i, iii and v.
Within minor wave 5 there is no Fibonacci ratio between minute waves i and iii, and minute wave v is .06 short of equality with minute wave iii.
Within intermediate wave (5) there are no Fibonacci ratios between minor waves 1, 3 and 5.
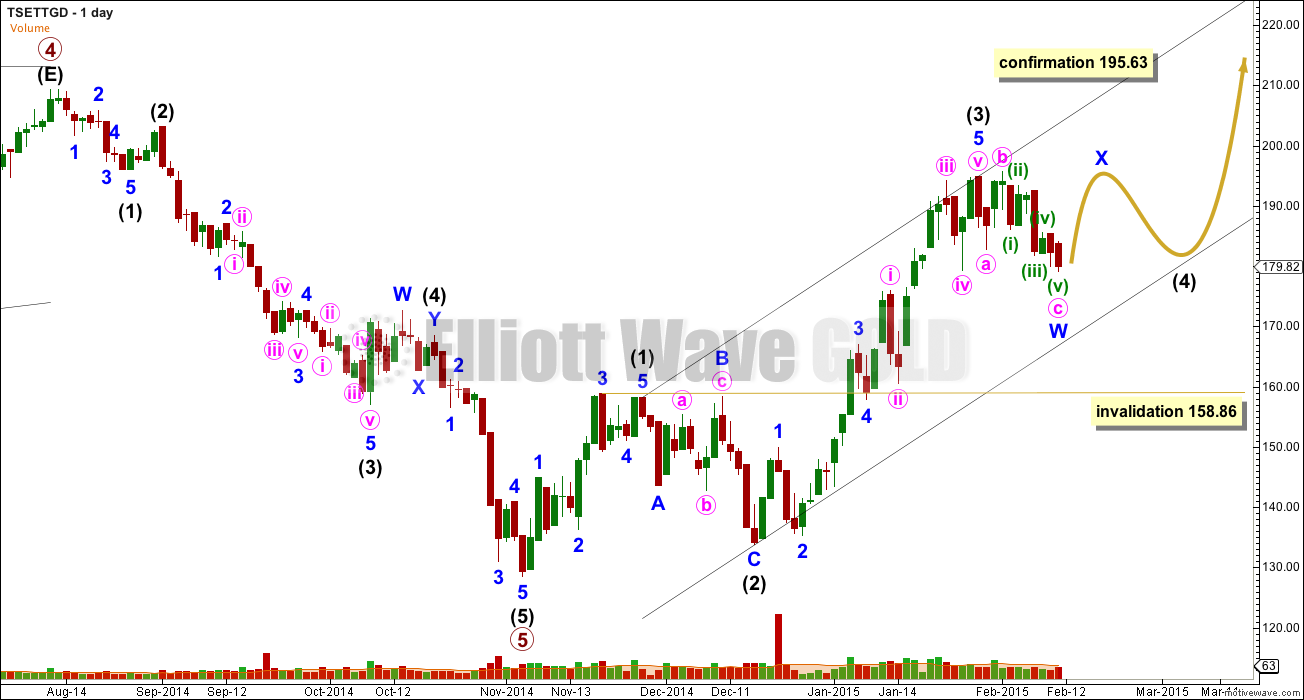
Within the new upwards trend:
There is no Fibonacci ratio between intermediate waves (3) and (1).
Within intermediate wave (1) there are no Fibonacci ratios between minor waves 1, 3 and 5.
Intermediate wave (2) is seen as a regular flat correction, with a rather long C wave. Minor wave C is .35 longer than 1.618 the length of minor wave A.
Within minor wave B there is no Fibonacci ratio between minute waves a and c.
Within intermediate wave (3) there are no Fibonacci ratios between minor waves 1, 3 and 5.
Within minor wave 5 there are no Fibonacci ratios between minute waves i, iii and v.
Intermediate wave (2) lasted 14 days. Intermediate wave (4) could be over as a single zigzag lasting 10 days (moving the degree of labelling within minor wave W all up one degree) or it could continue sideways as a combination. It looks like it needs to continue further to have better proportion with the rest of the structure.
Intermediate wave (4) may not move into intermediate wave (1) price territory below 158.86.
Alternate Wave Count
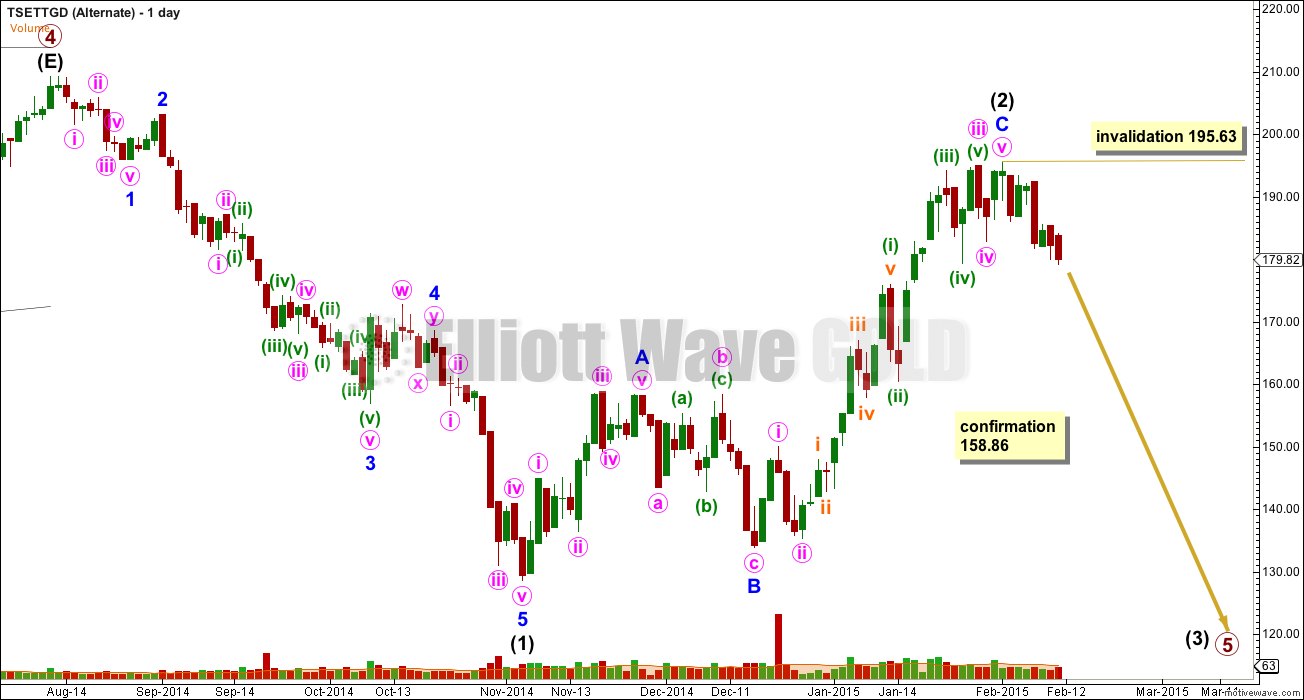
By simply moving the degree of labelling within primary wave 5 all down one degree, it is entirely possible that the bear market remains intact and recent movement is a deep second wave zigzag.
Conclusion:
I do not have confidence in my analysis of this market. I think it does not have enough volume for a reliable Elliott wave analysis. I have learned the hard way with my analysis of equities (most specifically and publicly AAPL) that Elliott wave really only works on markets with very high volume. I have learned what are the signs on a chart to look for to indicate inadequate volume, and I see them all here.
I will not be doing another analysis of this market, and I do not advise using this analysis with any degree of confidence.
I understand that members want me to provide you with analysis of other markets. My analysis of Silver I am comfortable with, but my analysis of GDX and TSE:TTGD I am not comfortable with. Elliott wave does not work on these markets well enough for the analysis to be reliable.
I will provide occasional updates of GDX, and I will always follow Gold for that analysis. My GDX analysis should be read in conjunction with Gold. I will continue to provide analysis of Silver as well.
This index is a mishmash of gold stocks & cad currency on low vol
Even GDX is low volume: Gold trades 1500X more $$ than GDX
IMO, better to trade Gold and Cad separately. Both have better vol and adhere to trends. See the trade from the separate charts below
.
Lara, a thoughtful and solid decision. I echo Jaf in saying thanks for your effort.
“I will provide occasional updates of GDX, and I will always follow Gold for that analysis. My GDX analysis should be read in conjunction with Gold. I will continue to provide analysis of Silver as well.”
Lara,
Thank you for your efforts,
While analyzing gold is relatively straightforward I’ve always questioned gold stock TA because each index is designed with a specific purpose; some analyze Large Cap’s, others focus on Medium & Small Cap’s and
we even have one that analyzes micro caps.
Regardless, if you look at the main indices: hui, xau, gdm/gdx,
sptgd/xgd, there is a common denominator.
Canadian mining companies represents about 60% of their diversity. GDX (56.6% Canadian) XGD (65.64% Canadian) etc…. So our question is which one is proper “specifically” for Elliott Wave – if any at all? You see, we are probably one of the first discussion groups on the internet to ask this question. It is very likely that most ellioticians accept GDX only because it is popular. But as Lara has demonstrated, SPTGD could be
showing us a completely different story.
So, if we take this exercise one step further and break these indices down to their rudimentary components, Barrick Gold, Goldcorp and Newmont are the top three companies by weight (Mkt.Cap). What happens if we focus on any (or all three) of these companies. Is
this sufficient for E.W.A? Do we need small cap analysis for E.W.A? Will an exploration company contribute to proper E.W.A?
In my experience, investors buy exploration plays and to some extent
mid-tier gold producing exploration plays based on the assumption that there is a lot of gold on their property.
Traders can push up a stock price based on geological predictions “regardless of the gold price”. Do we need this component
in “our” index? It doesn’t appear to give us any value in
terms of where the future price of gold is heading? Perhaps we need an index pioneered specifically for our own niche requirements? Maybe
we are the pioneers? In any case, take a look at Barrick. This is a Canadian company based in Toronto. It trades on
the TSX and the NYSE. I have posted up both charts and they are slightly different (different price tops/date). One is in Canadian dollars and the other is in American dollars. Which one would
you use for EWA? Some posters will automatically
default to USD’s because our gold price is in USD. But isn’t it cleaner to analyze a “Canadian” company in its own currency without introducing an exchange bias?
I find this an interesting debate because we have the potential to give ourselves an edge over other Ellioticians or maybe this whole exercise will demonstrate how pointless gold stock analysis really is?
Regards,
Jaf
My 2 cents worth: analysis of any market with insufficient volume is worse than useless, it is potentially confusing the picture. While I’ll continue with GDX from time to time, it will always come with the caveat that GDX appears to have insufficient volume for a reliable EW analysis.
EW analysis of any single equity will never be reliable enough.
EW analysis of an index can be useful, but it needs to have great volume.
Interesting…
So if volume or market cap is an underlying component to successful Elliott wave analysis (beyond everything else we’ve discussed) then I should add more priority to the resource rich Toronto stock exchange index..?
I’ve always tracked the $tsx for major trend change reassurance with success but this adds some weight to traditional TA..
In Canada, High cost oil sand producers are closing doors in response to the oil exodus and the Canadian government has responded with a surprise monetary policy move… Cracks are visible. Your gold alternate may have more validity then what we give it.. Thanks for the tip.
The look of this daily chart has more of a V-shape than the GDX daily chart, because this chart is denominated in CAD while GDX is measured in USD. The currency effect can make a big impact, like in this case with the 20% surge in USDCAD.