I have a new bullish Elliott wave count for GDX for you. The bearish Elliott wave count will be an alternate, in line with Gold.
Click charts to enlarge.
GDX does not appear to have sufficient volume for Elliott wave analysis of this market to be reliable. It exhibits truncations readily, and often its threes look like fives while its fives look like threes. I will let my Gold analysis lead GDX, and I will not let GDX determine my Gold analysis for this reason.
Main Wave Count
I have learned the hard way, specifically with AAPL, that in a market with insufficient volume (even at a monthly chart level) if a movement looks like a three or a five that this apparent clear structure may not be relied upon.
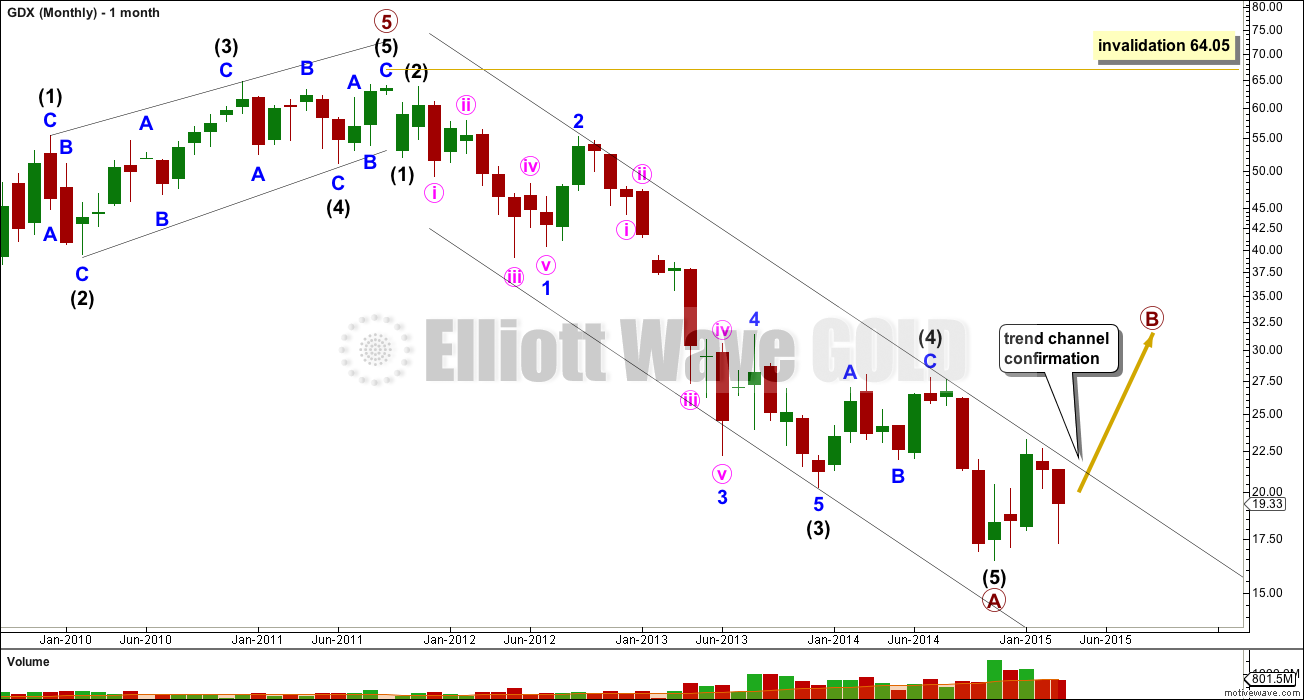
For GDX this downwards movement looks like a five wave impulse which may be complete. This wave count would required a clear breach of the channel before I have confidence in it.
If primary wave A is a five then primary wave B may not move beyond its start above 64.05.
Primary wave A lasted 38 months.
B waves exhibit the greatest variety in form and structure. Primary wave B may be a quick movement, or it may take longer. At this stage there are multiple corrective structures it may be unfolding as.
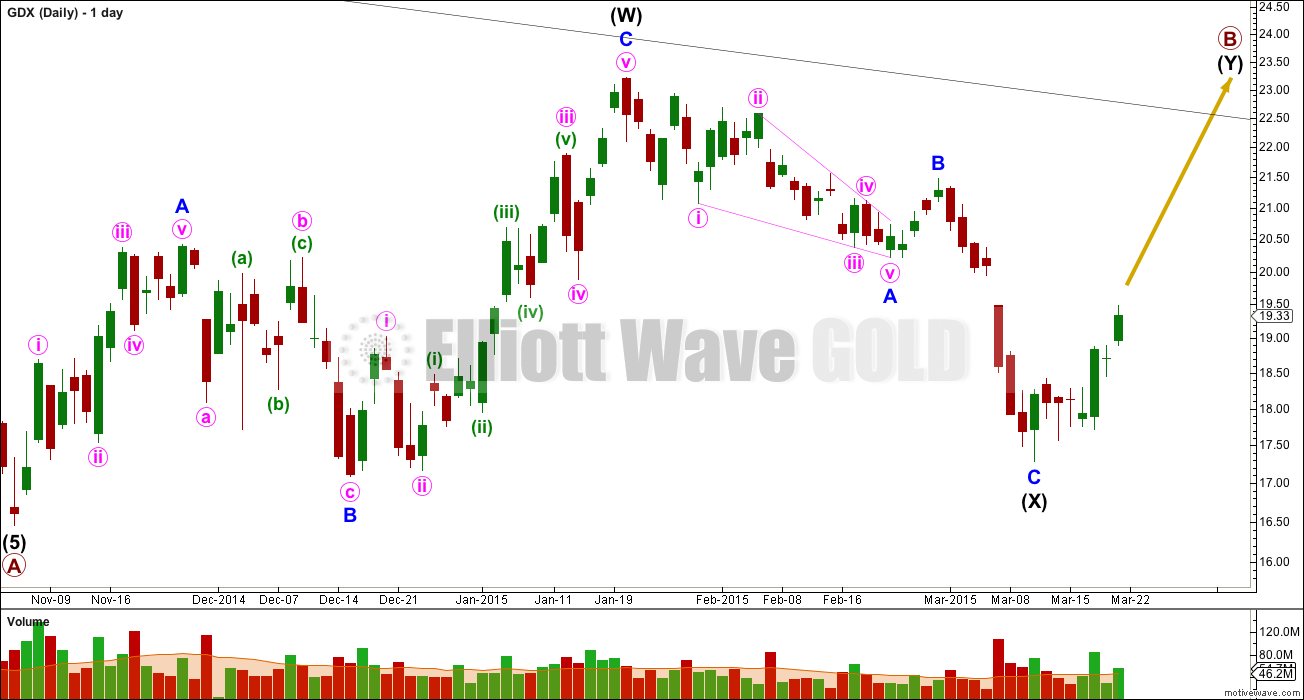
If primary wave B has begun then it may be unfolding as a double zigzag (as labelled), or a single zigzag with a leading diagonal incomplete for primary wave A, or a double combination or a triangle. All possible corrective structures are still open.
Because the downwards wave labelled intermediate wave (X) is less than 90% the length of intermediate wave (W), this cannot be a flat correction unfolding and may only be a double zigzag or double combination.
The second corrective structure may be either a zigzag, flat or triangle, and can make a new low below the start at 16.45. There can be no lower invalidation point.
The only thing I am reasonably confident of for this main wave count is that overall GDX should be in an upwards trend for the next several weeks.
Intermediate wave (W) lasted 51 days and intermediate wave (X) lasted a Fibonacci 34 days. Intermediate wave (Y) may be expected to most likely last a Fibonacci 55 days.
Alternate Wave Count
This was the only wave count up until today. I am letting Gold determine the wave count for GDX.
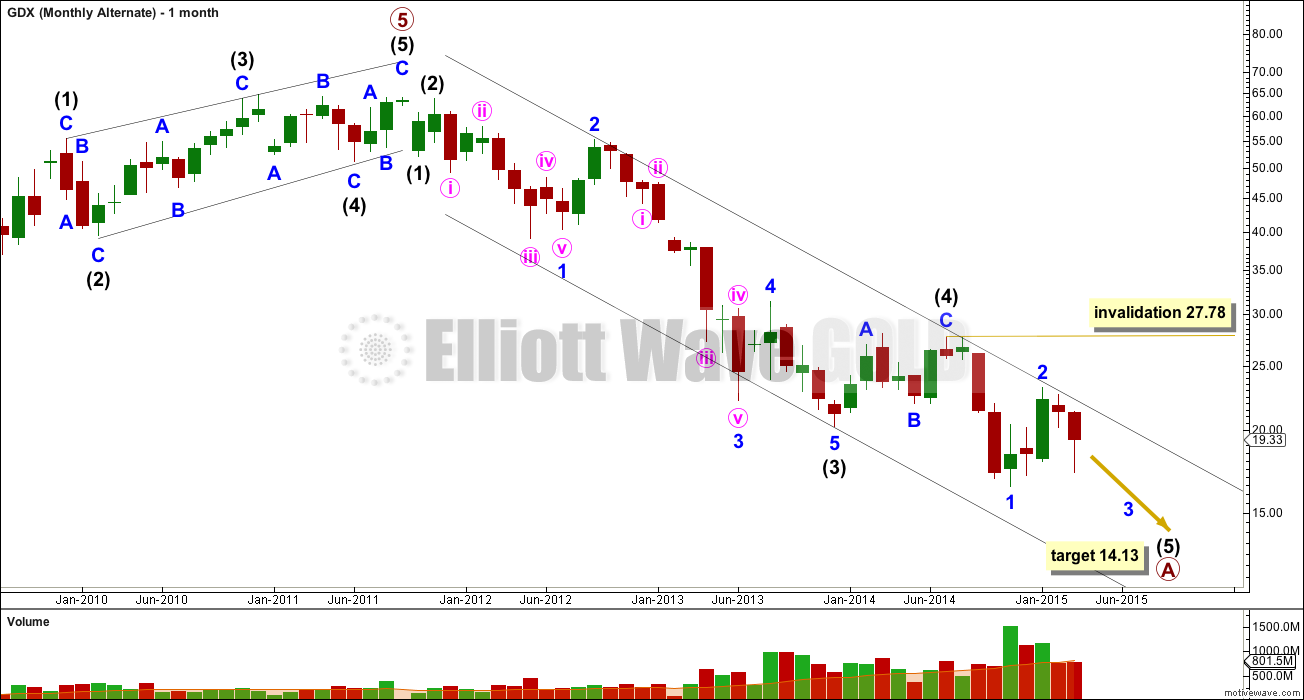
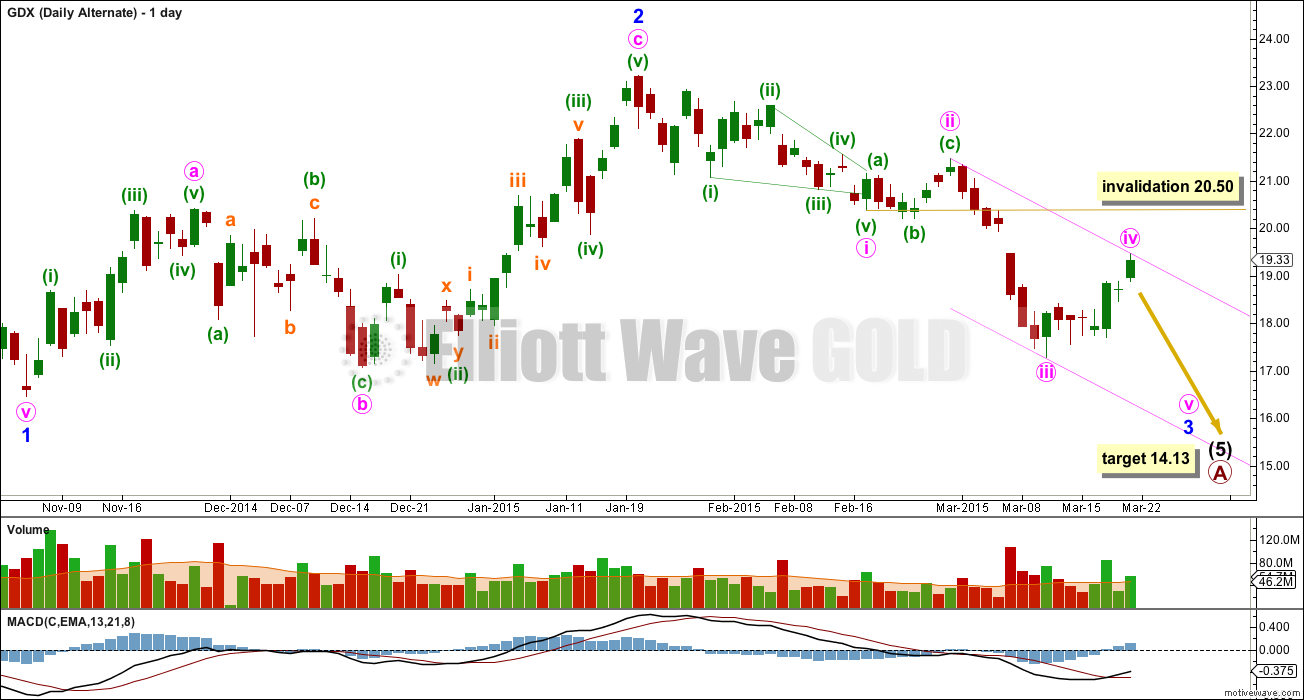
It is possible that intermediate wave (5) is incomplete. At 14.13 intermediate wave (5) would reach equality in length with intermediate wave (1). Within it minor wave 2 may not move beyond the start of minor wave 1 above 27.78.
Minor wave 3 must move below the end of minor wave 1 at 16.45.
There is no Fibonacci ratio between minute waves i and iii.


Mark, sorry about only just now releasing your comment from moderation. You’re now on the “whitelist” so your comments should appear immediately from now onwards.
Options Expiration Keeping Gold Near $1,200 – iiTrader
Wednesday March 25, 2015 9:26 AM
Commodity analysts at iiTrader say that April’s options expiration Thursday could be why gold has managed to hold on to its recent gains and continues to push towards the $1,200 an ounce level. “With large open interest at the $1,200 strike for both calls and puts this can give a glimpse as to why the market is slowly gravitating to the $1,200 level,” they say. However, despite gold’s recent performance, they note there is strong resistance at the 100-day moving average at $1,206.70 an ounce, with the next level coming in at the 50-day moving average at $1,220.30 an ounce. Comex April gold futures last traded at $1,198.50, up 0.6% on the day.
Lara – your alternate daily chart suggests a similar outcome as my daily chart which is based on pattern analysis and A/D line trends. It will be interesting to see if all roads lead to Rome.
http://scharts.co/1C8ExHL