
Another red candlestick was expected for Thursday’s session. The session is close to ending, and so far the candlestick remains red.
Summary: A small fourth wave correction is either over or may continue slightly higher / sideways. In the very short term a new high above 1,158.22 would indicate the correction is not over; it may end as a flat correction with a target 1,168 – 1,173, or it may continue sideways as a regular contracting triangle. Alternatively, a new low below 1,148.68 would indicate the correction is over and the final fifth wave down is underway to a target at 1,139. The downwards trend is almost complete for the mid term. I expect another red candlestick for Friday, and possibly Monday. Thereafter, I expect another second wave correction upwards to begin which may last either 3 or 5 days.
Click on charts to enlarge.
Main Daily Wave Count
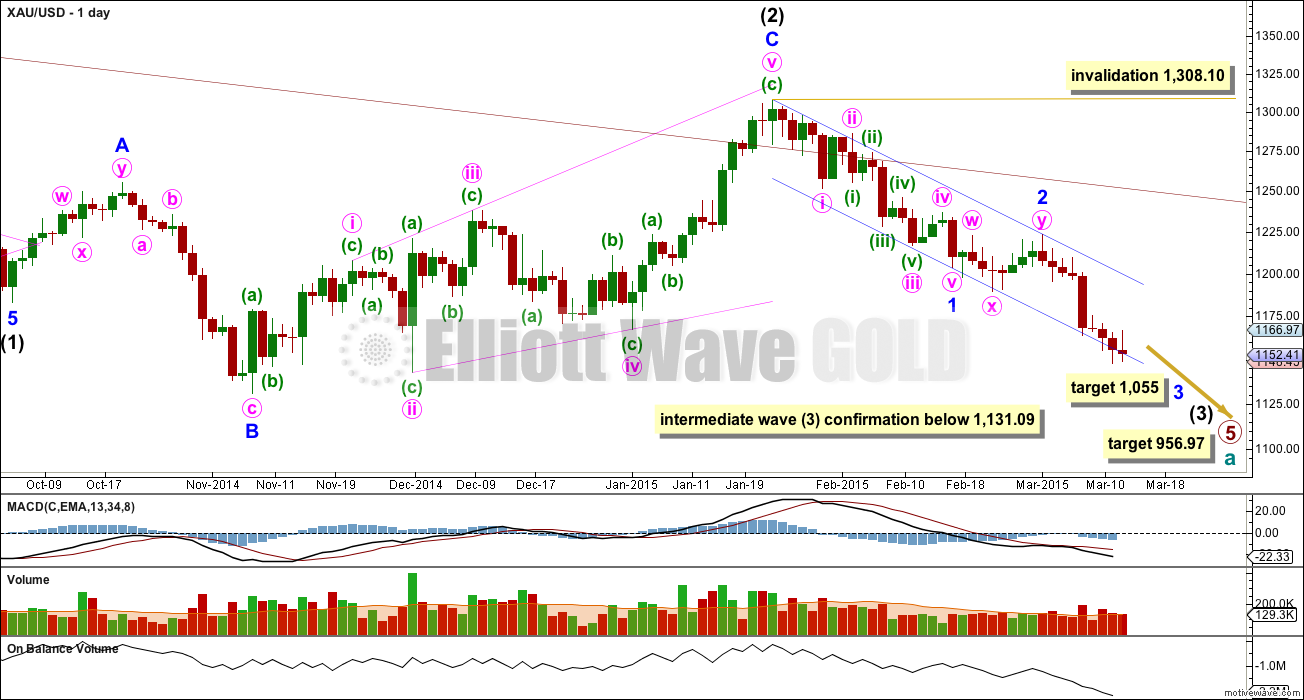
This main wave count sees Gold as still within a primary degree downwards trend, and within primary wave 5 intermediate wave (3) has begun. At 956.97 primary wave 5 would reach equality in length with primary wave 1. For Silver and GDX this idea, that the primary trend is down, is the only remaining wave count. This main wave count has a higher probability than the alternate below.
Within cycle wave a primary wave 1 lasted a Fibonacci 3 weeks, primary wave 2 lasted 53 weeks (two short of a Fibonacci 55), primary wave 3 lasted 37 weeks (three more than a Fibonacci 34), and primary wave 4 lasted 54 weeks (one short of a Fibonacci 55).
Primary wave 5 is now in its 35th week and the structure is incomplete. The next Fibonacci number in the sequence is 55 which would see primary wave 5 continue for a further 20 weeks, give or take up to three either side of this number. Although I am expecting primary wave 5 to be equal in length with primary wave 1 that does not mean it must also be equal in duration.
The maroon channel about cycle wave a from the weekly chart is now breached by a few daily candlesticks and one weekly candlestick. If cycle wave a is incomplete this channel should not be breached. The breach of this channel is a warning this wave count may be wrong, and so I will still retain the alternate.
Draw the maroon trend line on a weekly chart on a semi-log scale, and copy it over to a daily chart also on a semi-log scale (see this analysis for a weekly chart).
To see daily charts showing the whole of intermediate wave (1) from its start at 1,345.22, and an explanation of why this main wave count has a higher probability than the alternate, see the last analysis showing charts to that date here.
A new low below 1,131.09 would confirm that intermediate wave (3) down is underway.
I am moving the invalidation point for this daily chart down today. Looking at the structure on the weekly chart, if primary wave 5 is incomplete then within it intermediate wave (2) should be over because to see intermediate wave (2) continue further would not have the right look. Within intermediate wave (3) no second wave correction may move beyond its start above 1,308.10.
Within intermediate wave (3) minor wave 1 is a completed impulse lasting 18 days. Minor wave 2 is a completed double flat correction which lasted 9 days, exactly half the duration of minor wave 1. Because this is a second wave correction within a third wave one degree higher I would expect it to be more shallow than normal.
Minor wave 3 may total either a Fibonacci 21 or 34 days, depending on how long the corrections within it take. So far it has lasted only 8 days. At 1,055 minor wave 3 would reach 1.618 the length of minor wave 1.
Draw a base channel about minor waves 1 and 2. Minor wave 3 should have the power to break through support at the lower edge. Along the way down upwards corrections should find resistance at the upper edge. While the lower edge is not breached (so far it is only overshot and not clearly breached) the alternate wave count should be considered as a possibility.
Since the top labelled intermediate wave (2) volume is still strongest on down days.
On Balance Volume continues to agree with the downward trend for price.
Main Hourly Wave Count
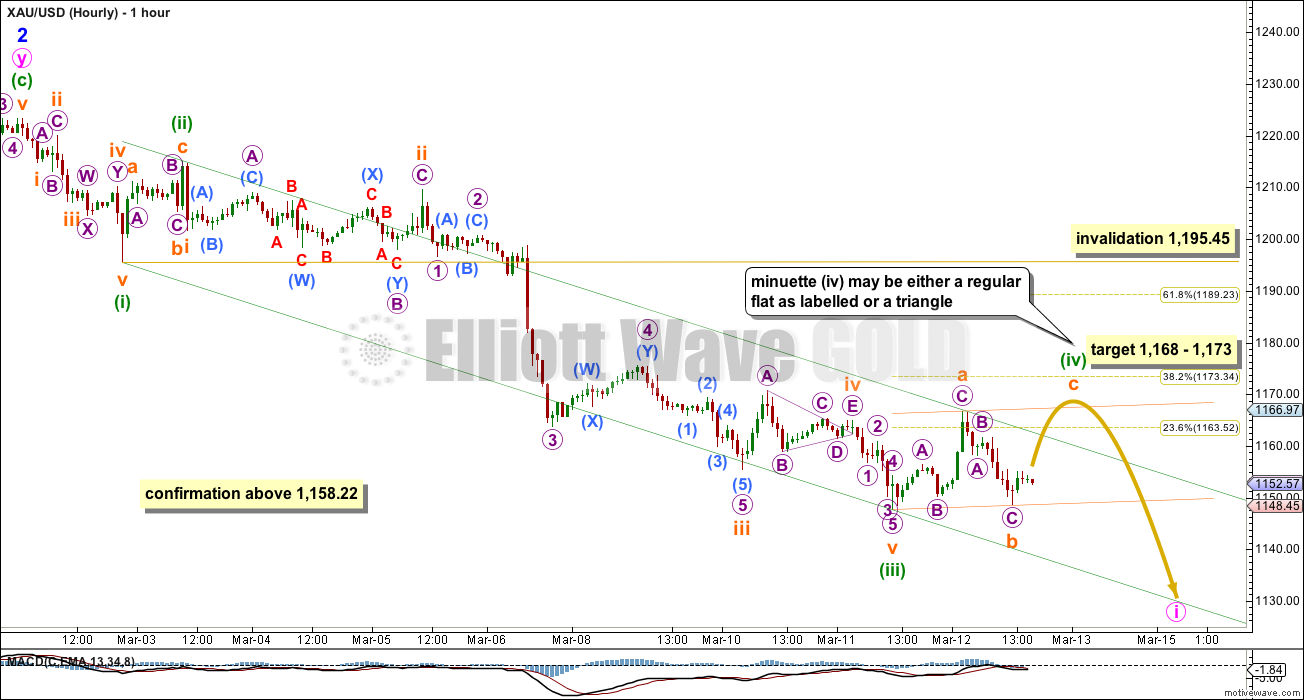
This is the main hourly wave count only because it expects to see better alternation between minuette waves (ii) and (iv).
Minuette wave (ii) was a deep 0.70 zigzag. Within it subminuette wave c is shortest, and only 0.29 longer than 0.618 the length of subminuette wave a. Subminuette wave b within it was an expanded flat correction.
Minuette wave (iv) is least likely to be a zigzag, and more likely to be a flat, combination or triangle, in order to exhibit structural alternation with minuette wave (ii). Minuette wave (iv) is likely to be shallow, ending at either the 0.236 or 0.382 Fibonacci ratios, and within (or close to) the price territory of the fourth wave of one lesser degree above 1,155.35 and below 1,170.63.
So far if minuette wave (iv) is incomplete the first wave up within it is a three. This indicates either a flat or triangle as the most likely structures. The following downwards wave is so far a completed three and is over 90% the length of the prior upwards wave, so the minimum depth for subminuette wave b of a flat correction is met. A triangle is also possible.
If minuette wave (iv) is a flat then it would be a regular flat. Subminuette wave b is 0.94 of subminuette wave a. At 1,168 subminuette wave c would reach equality in length with subminuette wave a, the most typical ratio for a C wave within a regular flat. Subminuette wave c may end when price touches the upper edge of the small upwards sloping orange channel drawn about minuette wave (iv). Regular flats often are nicely contained within their channels.
If minuette wave (iv) is a triangle then it would be a regular contracting triangle (although an expanding triangle is technically possible they are so extremely rare, maybe even the rarest of all Elliott wave structures, so I will not consider this possibility unless it shows itself to be true). A regular contracting triangle would expect choppy overlapping sideways movement in an ever decreasing range. MACD should hover about the zero line, and volume should decline towards the apex of the triangle.
A new high in the very short term above 1,158.22 would invalidate the hourly alternate wave count below and provide confident in this main hourly wave count.
Minuette wave (iii) is 5.68 short of 2.618 the length of minuette wave (i) (this variation is less than 10% the length of the third wave, so I consider it to be acceptable). The final fifth wave down for minuette wave (v) is very likely to be equal in length with minuette wave (i) at 27.88.
Minuette wave (iv) may not move into minuette wave (i) price territory above 1,195.45.
Redraw the channel now that minuette wave (iii) has ended. Draw the first trend line from the lows of minuette waves (i) to (iii), then place a parallel copy on the high of minuette wave (ii). So far minuette wave (iv) is finding resistance at the upper edge of the channel, but fourth waves are not always contained within these channels. This is why Elliott had a second technique to use when fourth waves breach the channel. If this main wave count is correct, when the fourth wave is over redraw the channel using his second technique: draw the first trend line from the ends of minuette waves (ii) to (iv), then place a parallel copy on the end of minuette wave (iii). Minuette wave (v) may find support and may end at the lower edge of the channel.
At this stage because minuette wave (iii) is a long extended wave it is more likely that minuette wave (v) will be shorter and equal in length with minuette wave (i). However, remain aware that the less likely possibility of a strong extended fifth wave remains. If the lower edge of the redrawn channel is breached by downwards movement and momentum is increasing then consider an extended fifth wave which may be very strong, typical of commodities. In that case it may be equal in length with minuette wave (iii) at 67.31.
A new low below the end of subminuette wave b at 1,148.68 in the very short term would make subminuette wave b look like a five wave structure on the hourly chart. It may only be a three wave structure. At that stage the alternate hourly wave count below would be preferred, and would have a higher probability.
If this main hourly wave count is correct then minute wave i may be over within 24 to 48 hours.
Alternate Hourly Wave Count
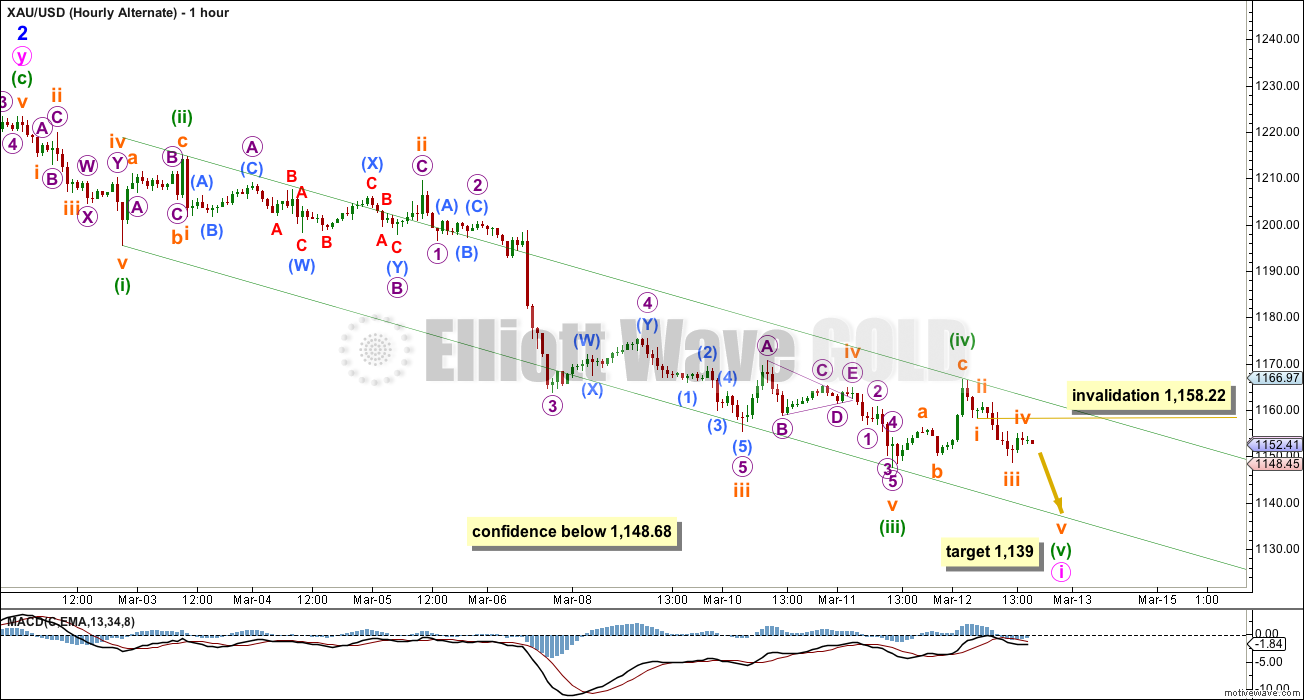
Alternatively, it is possible that minuette wave (iv) is over. This has a lower probability only because both minuette waves (ii) and (iv) would be zigzags.
Minuette wave (ii) was a deep 0.70 correction and minuette wave (iv) may have been more shallow at 0.28. Minuette wave (ii) has a long wave for subminuette wave a and a shorter wave for subminuette wave c, and minuette wave (iv) may have had a short wave for subminuette wave a and a long wave for subminuette wave c. Within them their subminuette waves b are quite different. There is some alternation within structure, and good alternation in depth. This is a viable wave count.
Minuette wave (iv) may have ended exactly at the upper edge of the channel drawn about minute wave i using Elliott’s first technique.
At 1,139 minuette wave (v) would reach equality in length with minuette wave (i). It may find support and end at the lower edge of the channel.
A new low below 1,148.68 would provide confidence in this wave count. At that stage the downwards wave from the end of minuette wave (iv) would look like a five on the hourly chart.
In the very short term subminuette wave iv may not move into subminuette wave i price territory above 1,158.22.
If this wave count is correct then minute wave i will very likely be over within the next 24 hours. The following correction for minute wave ii should show up on the daily chart, may last about 3 or 5 days, and may be a relatively shallow correction because it is a second wave within a third wave one and two degrees higher. The invalidation point for it is at 1,223.33.
Alternate Daily Wave Count
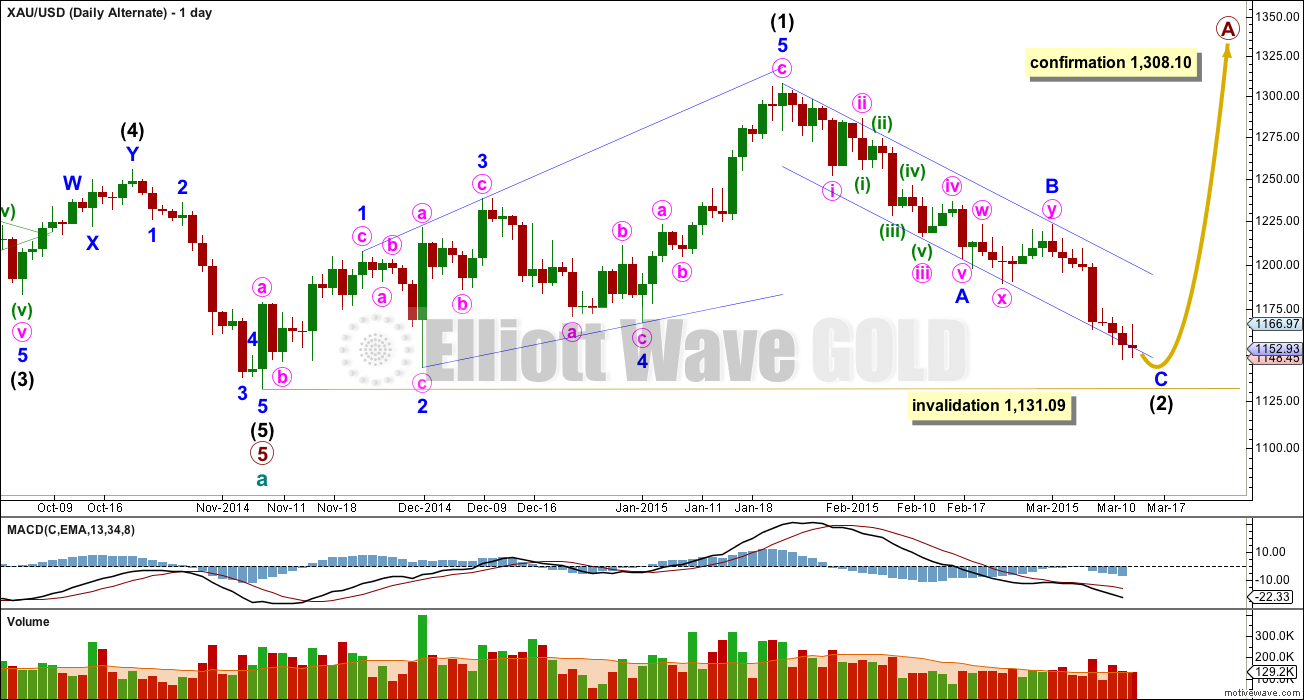
At this stage I judge this alternate wave count to have a lower probability. The structure of downwards movement, and momentum, will determine which wave count is correct over the next few weeks. At this stage they both expect more downwards movement so there is no divergence in the expected direction.
This wave count sees a five wave impulse down for cycle wave a complete, and primary wave 5 within it a completed five wave impulse. The new upwards trend at cycle degree should last one to several years and must begin on the daily chart with a clear five up.
The first five up may be a complete leading expanding diagonal. Within leading diagonals the second and fourth waves must subdivide as zigzags. The first, third and fifth waves are most commonly zigzags but they may also be impulses. This wave count sees minor waves 1, 3 and 5 as zigzags.
Leading diagonals are almost always followed by deep second wave corrections, sometimes deeper than the 0.618 Fibonacci ratio. Intermediate wave (2) is now deeper than the 0.618 Fibonacci ratio and the structure of minor wave C is close to completion.
For this alternate wave count minor wave C down must subdivide as a five wave structure. The hourly chart would see the subdivisions exactly the same as the main wave count above, so to keep the number of charts at a minimum I will publish only for the main wave count. For this alternate minor wave C may not exhibit a Fiboancci ratio to minor wave A.
Minor wave C is overshooting the lower trend line. Sometimes C waves do this. It is close to an end. When minute wave i for the main wave count can be seen as a completed five wave structure then this alternate would see minor wave C as complete. The price point which differentiates the two daily wave counts at that stage will be 1,223.33. This alternate will require movement above 1,223.33 and the main wave count would be invalidated with movement above 1,223.33.
Intermediate wave (3) must move beyond the end of intermediate wave (1) at 1,308.10.
Intermediate wave (2) of this new cycle degree trend may not move beyond the start of intermediate wave (1) below 1,131.09.
This analysis is published about 05:06 p.m. EST.
Analysis just published, but I fear minutes too late before NY close.
I can trade in after hours market thanks Lara.
Lara, I take it that when gold gets to the end of the triangle on perhaps Monday that gold will crash drop out of the bottom in downward rally to the low of either 1,161.88 – 27.88 = 1,134 or if strong extended 5th wave 1,161.88 – 67.31 = 1,094.57
My target is 1,128. I have subminuette wave c of the triangle ending at 1,161.85, not subminuette wave e.
The final wave of subminuette wave e is either over already, or it is extremely close.
Maybe no Analysis before close until April 5th
Maybe after NYSE close daily. That is MY guess. That is based on Lara saying a day or two ago that due to New Zealand DST daylight saving time adjustment will be April 5th that the daily analysis will be late until April 5th.
I’m here now. Should have text and charts published in about an hour.
It looks like minuette wave (iv) is a sideways triangle with only the final E wave to complete.
Minute wave i may end on Monday.
Lara : Minute wave i end on Monday.
I understand target for min wave i is 1139.
Gold will reach 1139 on Monday???
Pls clarify.
1139 is target for hourly alternate not for main.
Maybe
1,161.88 – 27.88 = 1,134 or if strong extended 5th wave 1,161.88 – 67.31 = 1,094.57
My IMO it may happen on Wednesday post FOMC minutes.
Lara thinks gold may bottom Monday.
Maybe gold goes up until FOMC meeting Wednesday 2 pm then crashes down towards 1,055?
1,129 on Monday, or maybe (less likely) Thursday if minute i lasts a Fibonacci 13 days total. That would see a slow moving fifth wave though.
Use the green channel. See that minuette wave (iv) continues to find resistance about the upper edge. Expect the fifth wave down to also find support, and likely end when price touches the lower edge.
What is the wave count now. Did we just finish 3rd or 5th down at 11:05 am EST?
Please see my latest post below.
Peak was at 1,161.88 at 10:46 pm Thursday.
1,161.88 – 27.88 = 1,134
or if strong extended 5th wave 1,161.88 – 67.31 = 1,094.57
Lara said “The final fifth wave down for minuette wave (v) is very likely to be equal in length with minuette wave (i) at $27.88.
“remain aware that the less likely possibility of a strong extended fifth wave… If the lower edge of the redrawn channel is breached by downwards movement and momentum is increasing then consider an extended fifth wave which may be very strong, typical of commodities. In that case it may be equal in length with minuette wave (iii) at $67.31.”
Simply simply all gold price needs to do is break below 1147 to flush out 1140….
That is absolutely correct, but it does not give a lucrative tradeable setup these couple of days. I intend to trade minuette 5, preferably its third wave.
Tham That is good idea, thank you :o)
Peak of 5th in a 3rd wave and a 5th wave both offer great profits. Great profits in your pocket is much better than higher profits your competition took from you later on when you missed your chance.
Profits is Most important goal.
When you are offered great profits in the day take them or they may not be offered again that day.
While you are enjoying your profits you can enjoy working on improving your trading strategies$$$
My interpretation of the price movement so far:
1147.38 (minuette 3) – 1166.97 (sm a/w) – 1148.75 (sm b/x) – 1161.92 – 1154.16 (or lower) – ??
Both the regular flat and the contracting triangle are still in play.
If it is a regular flat, the wave structure is double zigzag w-x-y.
1148.75 (sm x) – 1161.92 (micro a) – 1154.16 or lower (micro b) – (> 1161.92, micro c, sm y, minuette 4).
If it is a triangle, then it is 1161.92 (sm c) – 1154.16, preferably lower to touch the triangle trendline (sm d) – (< 1161.92, sm e, minuette 4).
I reckon that 1161.92 is the dividing point. If ongoing price movement fails to break 1161.92 and instead turns south, then a triangle has formed. If price rises above 1161.92, a regular flat forms.
The first inkling occurs when current price movement fails to go lower than 1154.16 because for a triangle price usually touches the trendline. In that case, the case for the triangle becomes less robust.
Let's see how it plays out. I sense that most of us are eagerly waiting to short the minuette 5 movement. We just need to exercise patience.
Price has just dropped to 1152.85, but to touch the trendline, we need a little lower.
Price appeared to have stopped dropping at 1151.54 at 11 am ET and bounced up.
If that is the bottom, I don’t think it hit the triangle trendline yet for the d wave.
I am leaning towards the double zigzag of the flat.
1148.75 (sm x) – 1161.92 (micro a) – 1151.54 (micro b) – (1168, micro c, sm y, minuette 4).
why do you think the wave d should hit the trendline?
as far as I know there is no such rule.
Extremums of B and D waves form a BD trendline, the one that matters
Does gold need to go much higher or is it working it’s way down in minuette wave 5.
Am I mistaken, it sounds like minuette wave 4 hasn’t peaked yet, which is strange considering gold last night 10:46 high 1161.88 and got into Lara’s range above 1155.35 up to 1173.
What was 1156 at 1:32 was that just hitting upper trend line on continued way down?
Think Gold completed wave c at 1161.5 (on my charts) and cannot move higher than that and right now is completing wave e
Sorry. Just woke up from my sleep. You are right. We have completed d and just waiting to finish up e.
minuette iv looks to be a triangle and currently in wave d targeting $1150ish
Wave C in a triangle can be long and convoluted, so I think it is possible we are still in wave C.
if it goes below 1155 then it could be an ending diagonal on the hourly?
After wave 3 completion gold’s seasonal high in March-April will come into play. Gold rise in wave 4 to around 1200 can be expected or may be even higher.
According Lara’s main daily count the future intermediate wave 4 cannot rise above 1182 if the primary wave 5 is expanding as impulses
The rise you suggested is possible if the primary wave 5 is an ending diagonal
Once I proposed the ending diagonal idea but Lara said that wanted to have counts manageable and it seems wise. But duration of this primary wave 5 makes me feel that this idea is more and more possible.
From Gary Wagner EW at Kitco Thursday
http://www.kitco.com/ind/Wagner/images/gld312aa.jpg
Hi Lara, you said “I expect another red candlestick for Friday, and possibly Monday. Thereafter, I expect another second wave correction upwards to begin which may last either 3 or 5 days.”
How deep do you expect the second wave correction upwards to be? or is it too early to know? Thanks
The retrace shouldn’t go any further than the blue trend line on the daily chart for the main count. If it goes higher than that, Lara would likely switch to the alternate count.
It is too early to tell as minuette 4 and minuette 5 are yet to complete. But, if minuette 5 and hence minute 1 completes at 1139, then minute 2 would likely retrace to somewhere close to the end of minuette 4 as this is a common retrace. I reckon it would not rise beyond 1191, the 61.8% retrace. This is a very rough estimate based on common retracement points, just to give some sense of proportion and should be treated as such.
On a daily chart gold may not retrace beyond wave 1 at 1190; .618 fib from 1223 to 1139.
TKL is there an EW analysis of the ratio of xau /gold from 1980 to present? If not is it possible can you attempt to do it? Thanks.
Hi papudi. I don’t have it. You may try Lara’s archives. She might have it.
I have this in an historic analysis on 7th June, 2014: http://elliottwavegold.com/2014/06/gold-elliott-wave-technical-analysis-grand-supercycle-7th-june-2014/
Fed meeting statement next Wed may initiate the next leg down, so minute wave 2 may be brief, maybe 3 days.
I’d expect it to be relatively shallow, to the 0.382 Fibonacci ratio of minute wave i maybe, because it’s a second wave correction within a third wave one and two degrees higher. There should be a strong downwards pull.
I cannot give a price point because we don’t know where minute wave i has ended, so we don’t know where those Fibonacci ratios are.
The other thing to look for will be the upper edge of the blue channel now only on the daily chart. Minute wave ii if it gets that high should find strong resistance there, it is very unlikely to breach that trend line.
Great work Lara!!!!: In the very short term a new high above 1,158.22 would indicate the correction is not over; it may end as a flat correction with a target 1,168 – 1,173,”
At 8:30 PM EST Gold traded at 1258.25 and now at 9:45PM at 1258 45.
Alternate hour wave count invalidated!!!!!
At 8:33 pm EST Gold already moved above 1158.22 and confirmed Main Hourly Wave Count
Hi Lara. I have some difficulties in seeing Micro A of Subminuette a as a 5 wave structure on the 15min chart. Is this a problem? Could you please show how you would label it?
The most important thing is subminuette wave a is a three.
It’s a clear three on the hourly chart.
It may be as labelled a-b-c single zigzag, but it may also be labelled w-x-y double zigzag. That would make absolutely zero difference to the main hourly wave count. So it doesn’t matter.