
I expected another red candlestick for Friday’s session. So far there is a small green candlestick, which may end as a green doji or it may end red. The main hourly Elliott wave count was confirmed, and minuette wave (iv) is an almost complete triangle.
Summary: The last small fourth wave correction is almost complete as a regular contracting triangle. The final wave E up is either over already or may be very soon indeed. It may not move above 1,161.85. The target down for minute wave i to end is at 1,128. It may end on Monday, or it may possibly be slow and last four days so minute wave i totals a Fibonacci 13, although this is less likely. The possibility of a swift strong fifth wave remains, but it too is less likely in this case.
Click on charts to enlarge.
Main Daily Wave Count
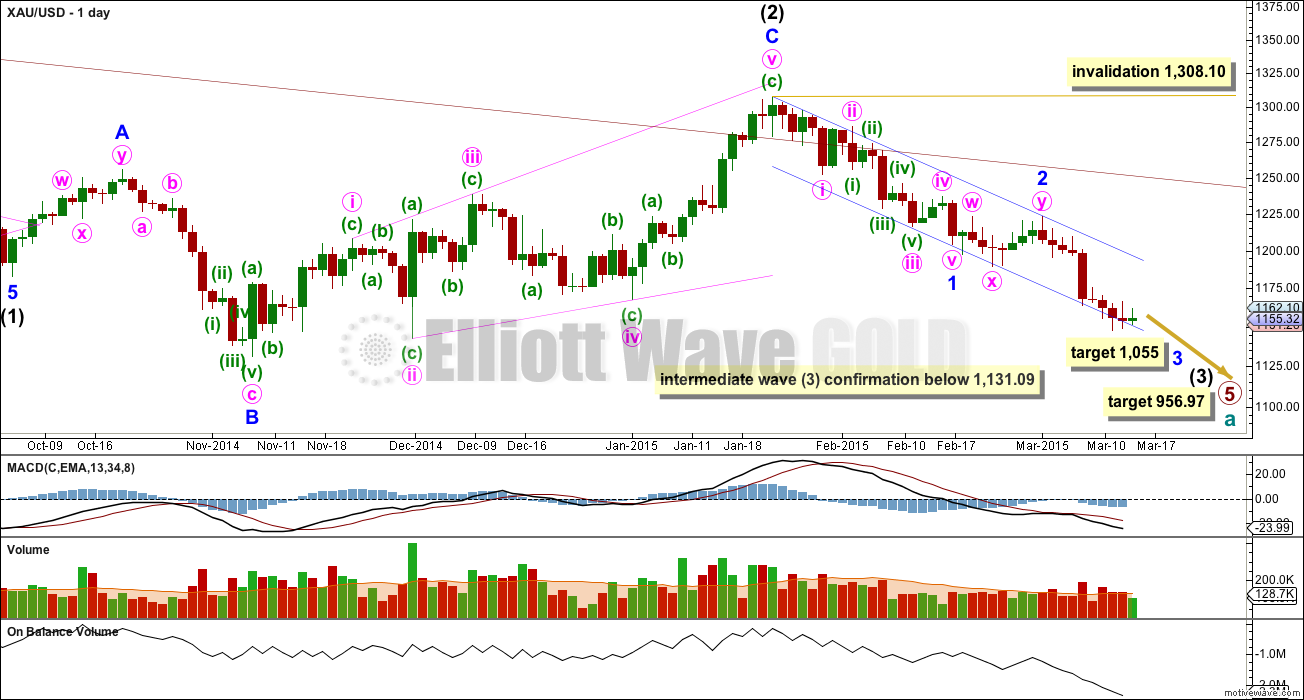
This main wave count sees Gold as still within a primary degree downwards trend, and within primary wave 5 intermediate wave (3) has begun. At 956.97 primary wave 5 would reach equality in length with primary wave 1. For Silver and GDX this idea, that the primary trend is down, is the only remaining wave count. This main wave count has a higher probability than the alternate below.
Within cycle wave a primary wave 1 lasted a Fibonacci 3 weeks, primary wave 2 lasted 53 weeks (two short of a Fibonacci 55), primary wave 3 lasted 37 weeks (three more than a Fibonacci 34), and primary wave 4 lasted 54 weeks (one short of a Fibonacci 55).
Primary wave 5 is now ending its 35th week and the structure is incomplete. The next Fibonacci number in the sequence is 55 which would see primary wave 5 continue for a further 19 weeks, give or take up to three either side of this number. Although I am expecting primary wave 5 to be equal in length with primary wave 1 that does not mean it must also be equal in duration.
The maroon channel about cycle wave a from the weekly chart is now breached by a few daily candlesticks and one weekly candlestick. If cycle wave a is incomplete this channel should not be breached. The breach of this channel is a warning this wave count may be wrong, and so I will still retain the alternate.
Draw the maroon trend line on a weekly chart on a semi-log scale, and copy it over to a daily chart also on a semi-log scale (see this analysis for a weekly chart).
To see daily charts showing the whole of intermediate wave (1) from its start at 1,345.22, and an explanation of why this main wave count has a higher probability than the alternate, see the last analysis showing charts to that date here.
A new low below 1,131.09 would confirm that intermediate wave (3) down is underway.
I am moving the invalidation point for this daily chart down today. Looking at the structure on the weekly chart, if primary wave 5 is incomplete then within it intermediate wave (2) should be over because to see intermediate wave (2) continue further would not have the right look. Within intermediate wave (3) no second wave correction may move beyond its start above 1,308.10.
Within intermediate wave (3) minor wave 1 is a completed impulse lasting 18 days. Minor wave 2 is a completed double flat correction which lasted 9 days, exactly half the duration of minor wave 1. Because this is a second wave correction within a third wave one degree higher it is more shallow than normal due to the strong downwards pull of intermediate wave (3).
Minor wave 3 may total either a Fibonacci 21 or 34 days, depending on how long the corrections within it take. So far it has lasted only 9 days. At 1,055 minor wave 3 would reach 1.618 the length of minor wave 1.
Draw a base channel about minor waves 1 and 2. Minor wave 3 should have the power to break through support at the lower edge. Along the way down upwards corrections should find resistance at the upper edge. While the lower edge is not breached (so far it is only overshot and not clearly breached) the alternate wave count should be considered as a possibility.
Since the top labelled intermediate wave (2) volume is still strongest on down days.
On Balance Volume continues to agree with the downward trend for price.
Main Hourly Wave Count
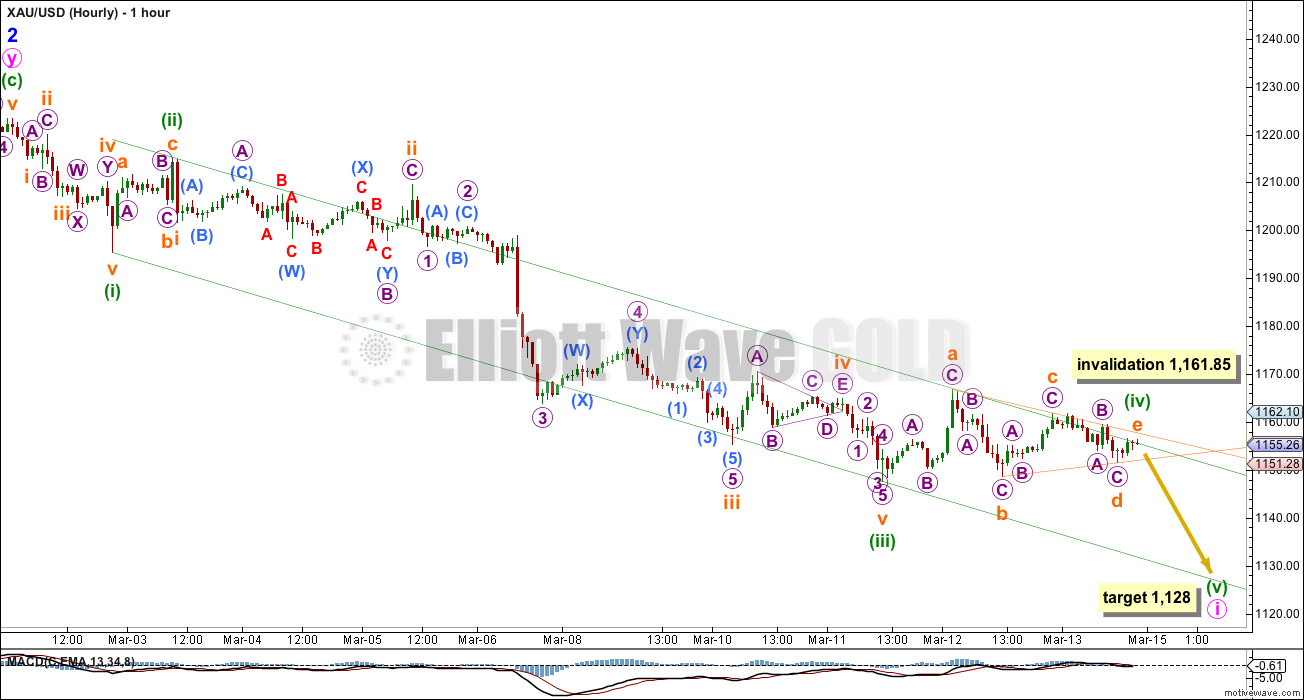
Minuette wave (iv) subdivides perfectly as a regular contracting triangle, which continues to find resistance at the upper edge of the channel about minute wave i.
Draw the channel using Elliott’s first technique: draw the first trend line from the ends of minuette waves (i) to (iii), then place a parallel copy on the end of minuette wave (ii).
While the triangle is unfolding MACD is hovering about the zero line. This is exactly how MACD should behave if a triangle is unfolding, and so I have confidence in my labelling of minuette wave (iv) as a triangle.
Subminuette wave e of the triangle may be ending or may have just ended. E waves most often fall short of the A-C trend line, sometimes they overshoot the trend line but this is less common. In this case the upper edge of the green downwards sloping Elliott channel may provide strong resistance causing subminuette wave e to fall short of the orange a-c trend line, giving this triangle the most typical look.
Subminuette wave e may not move beyond the end of subminuette wave c above 1,161.85.
At 1,128 minuette wave (v) would reach equality in length with minuette wave (i). Because minuette wave (iii) is a long extension, close to 2.618 the length of minuette wave (i), it is most likely that minuette wave (v) will not also be extended.
Minuette wave (v) may find support and may end when price comes to touch the lower edge of the Elliott channel.
If the lower green trend line is breached and if downwards momentum begins to build then look out for the less likely possibility that minuette wave (v) may be a long swift and strong fifth wave, typical of commodities. In that case it may reach equality in length with minuette wave (iii) at 1,089. I think this is very unlikely though.
If subminuette wave e is not over and continues it may unfold as a triangle, turning minuette wave (iv) into a nine wave triangle. This would require the green Elliott channel to be breached though, so it is more likely that subminuette wave e is either over already or will be before the market closes. When the lower orange b-d trend line of the triangle is breached this would indicate that the triangle is over.
Extend the triangle trend lines out to the right on the hourly chart. The point in time at which they cross over may see the end of minuette wave (v). This does not always work, but it works often enough for it to be something to look out for. This indicates that minuette wave (v) may end in another 16 hours.
If price moves above 1,161.85 I would consider the alternate below.
Alternate Hourly Wave Count
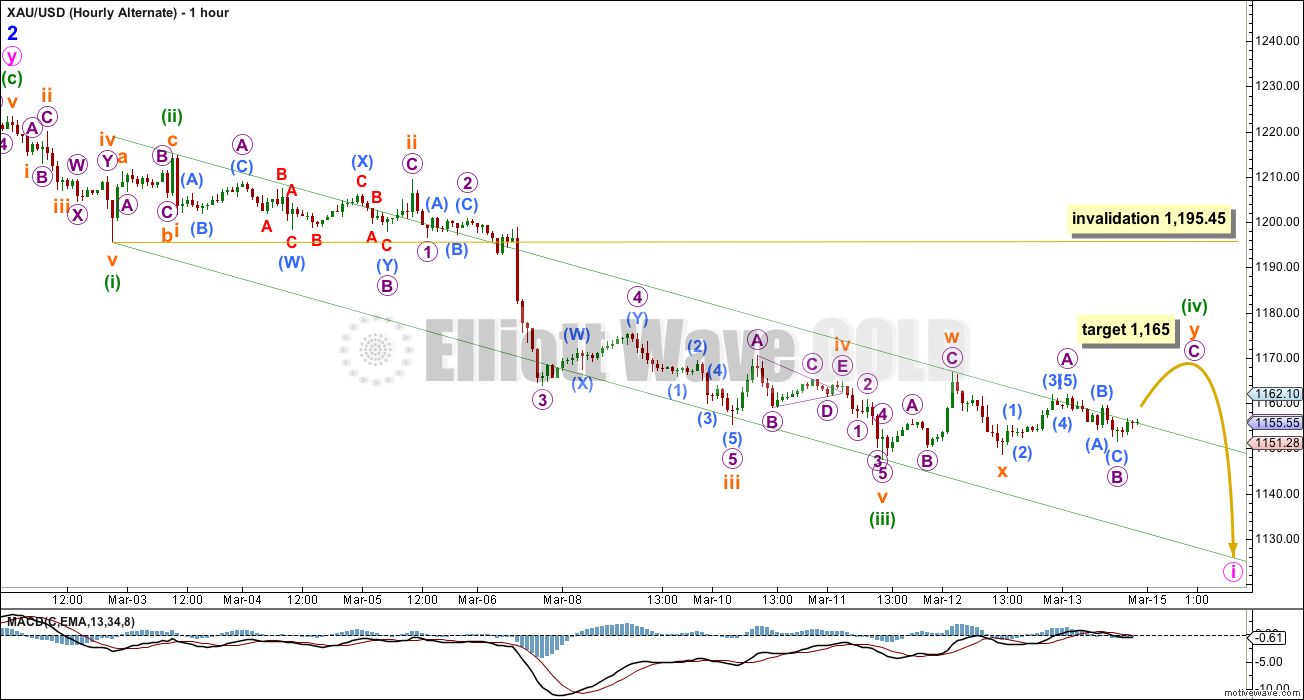
I am only publishing this alternate as a “what if?” because the invalidation point on the main hourly wave count is so close by.
I am discarding the idea that minuette wave (iv) may be a regular flat correction because upwards movement from the low labelled subminuette wave x does not look like an unfolding five wave structure. It would require too much more upwards movement to complete as a five, would be too long in duration, and would have to breach the green channel by too much for the wave count to have the “right look”.
Neither subminuette waves w nor y have B waves 90% or more the length of their A waves, so neither of these corrections are flats and they would both be zigzags. Within micro wave A of subminuette wave y the fifth wave of submicro wave (5) is slightly truncated (only by 0.02).
Minuette wave (iv) may be a multiple, but if it is then it is a double zigzag. The purpose of double zigzags is to deepen a correction when the first zigzag does not move price deep enough. Double zigzags normally have a clear slope against the main trend, they are not sideways structures. This movement is sideways and does not look like a double zigzag.
At 1,165 micro wave C would reach equality in length with micro wave A within subminuette wave y.
This alternate has an exceptionally low probability. Minuette wave (iv) may not move into minuette wave (i) price territory above 1,195.45.
Alternate Daily Wave Count
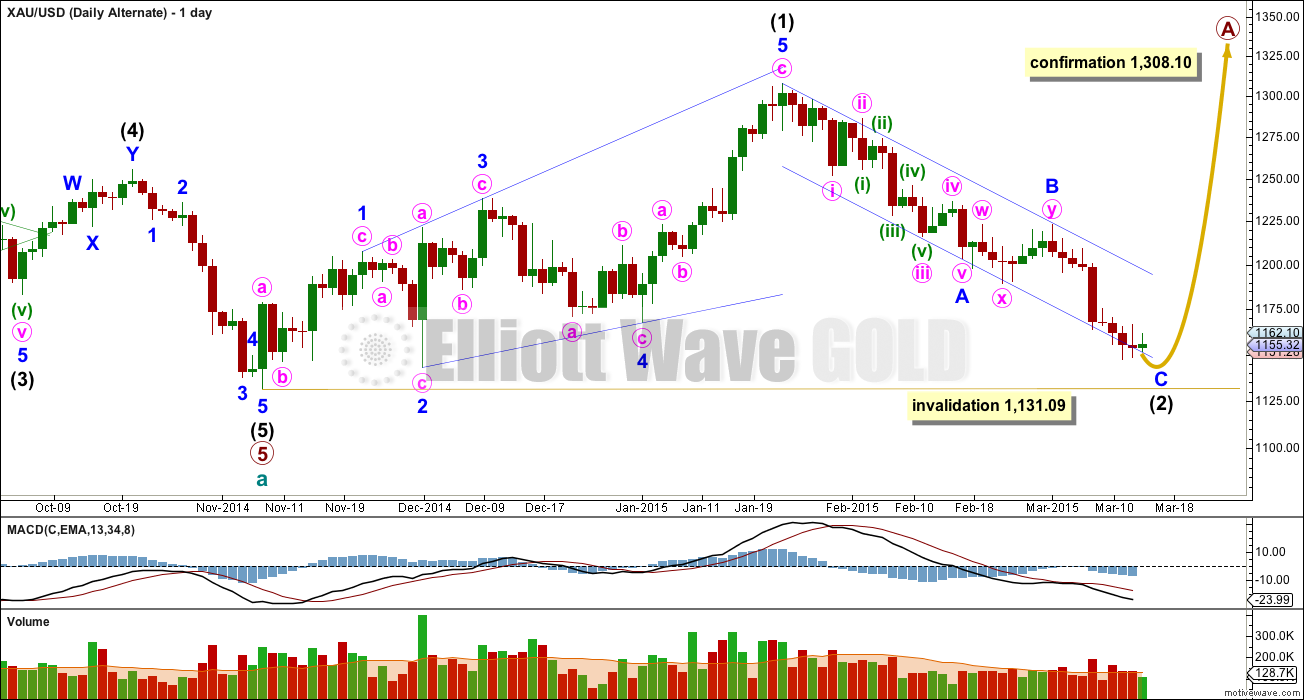
At this stage I judge this alternate wave count to have a lower probability. The structure of downwards movement, and momentum, will determine which wave count is correct over the next few weeks. At this stage they both expect more downwards movement so there is no divergence in the expected direction.
This wave count sees a five wave impulse down for cycle wave a complete, and primary wave 5 within it a completed five wave impulse. The new upwards trend at cycle degree should last one to several years and must begin on the daily chart with a clear five up.
The first five up may be a complete leading expanding diagonal. Within leading diagonals the second and fourth waves must subdivide as zigzags. The first, third and fifth waves are most commonly zigzags but they may also be impulses. This wave count sees minor waves 1, 3 and 5 as zigzags.
Leading diagonals are almost always followed by deep second wave corrections, sometimes deeper than the 0.618 Fibonacci ratio. Intermediate wave (2) is now deeper than the 0.618 Fibonacci ratio and the structure of minor wave C is close to completion.
For this alternate wave count minor wave C down must subdivide as a five wave structure. The hourly chart would see the subdivisions exactly the same as the main wave count above, so to keep the number of charts at a minimum I will publish only for the main wave count. For this alternate minor wave C may not exhibit a Fiboancci ratio to minor wave A.
Minor wave C is overshooting the lower trend line. Sometimes C waves do this. It is close to an end. When minute wave i for the main wave count can be seen as a completed five wave structure then this alternate would see minor wave C as complete. The price point which differentiates the two daily wave counts at that stage will be 1,223.33. This alternate will require movement above 1,223.33 and the main wave count would be invalidated with movement above 1,223.33.
Intermediate wave (3) must move beyond the end of intermediate wave (1) at 1,308.10.
Intermediate wave (2) of this new cycle degree trend may not move beyond the start of intermediate wave (1) below 1,131.09.
This analysis is published about 04:26 p.m. EST.
I bought all my DUST back and extra and all much cheaper before it jumped the last ten minutes. Gold target $1,136 in about one day.
Has gold already peaked during market hours today at 1,155.26 at 1:30 pm EST or may it still go up to 1,158.51 or area today?
Perhaps it is just finishing B portion now at 2:36 pm of ABC correction up from 1,150.47 at 11:01 am?
Just want to make sure I buy back DUST today before market close and hoping gold moves up from now to close?
Yes, I think so. My target is 1,136 to be met in about one day.
Lara, thanks, if publishing a full EW analysis before market closes is not possible just a brief sentence like “target is 1,136 to be met in about one day” is a big help.
I was trying to get it done before 4:30… and didn’t quite manage it.
Could we have completed minute wave iv at 1164, completed subminutte wave i at 1153, completed subminutte wave ii at 1159, and are now in subminutte wave iii of minute wave v (micro wave 1 to 1150, microwave 2 at 1154, and now in microwave 3).
I like the concept of a regular 5th wave down like you are mentioning although the triangle concept with gold bouncing up and down in the triangle in interesting. However Lara said 16 hours to bottom of minute wave i and not 16 hours until gold bottoms out of the triangle. It is clear that gold will take more than 16 hours to bottom but Lara’s 5th wave down may still be valid instead of bouncing way bat up to 1,160 or higher.
May be time to buy more DUST as I sold mine at 10:24 WHEN dust near high of the day?
The triangle invalidated itself and the hourly alternate was confirmed.
The time estimate was based on the triangle trend lines crossing over. No triangle means that estimate is redundant.
micro 2 could reach up as high as 1158.51, but with the rest I concur perfectly. Alternatively your micro 2 could be subminuette 4, as it does not reach up into wave 1 price territory. … and there are other alternatives at micro degree – as always ;-(
ghaneesh
$1,158.51 would be amazing for me to buy DUST again after selling near high today, thanks a lot.
Will watch closely for a gold peak from here up to there and DUST low.
If gold breaks below 1,153 support then 1,130 is next support then 1,000 is next support. – Gary Wagner of Kitco March 13, 2015
Also explains the effect of the strong US dollar on gold July 2014 until now.
http://www.kitco.com/news/video/show/Chart-This/941/2015-03-13/FOMC-Already-Baked-Into-Golds-Cake—Gary-Wagner
Looks to me like we are in a revised triangle about half way through wave D. I would not be surprised if this triangle stretches out to Wednesday at 2 pm. Fifth waves coming out of triangles can sometimes be short.
Thanks, that looks plausible to my novice eyes. May be completing ‘d’ wave now. Anyone else?
Does that mean gold now has a small short bounce up?
That would be my understanding of an ‘e’ wave here, yes, but don’t follow me/see ghaneesh above.
I would expect wave d of the triangle to drift down to about 1148 and then wave e would go up to perhaps 1160-1162. Wave d has to stay above the end of wave b for this revised triangle idea to remain valid.
hmm. A triangle should have only one complex subwave. Wave A is already a double zigzag, so would be also wave C in such a revised triangle. I think we are indeed in v down now.
Unless I am looking at a different thing than you, it seems Lara labeled wave a of the triangle as a plain ABC on her main hourly.
yes. I asked this question. Lara’s reply is the second comment of march, 12th. At 1148.56 this triangle will be invalidated. Lets see…
I would be inclined to say that gold will indeed remain in a holding pattern until Weds. After that gold gyrates briefly in one direction, then shoots off in the other.
I thought that looked good too… but when you chart it and put trend lines on it, the trend lines aren’t converging very much. It doesn’t look right. I’ve discarded that idea.
50-Year Gold Price Projection
Avi Gilburt March 15, 2015
http://www.gold-eagle.com/article/50-year-gold-price-projection
In next decade AVI is calling for 10 fold Gold price. Pls visit EWG gold historical chart.
Lara just confirmed me that analysis still holds.
Gold is in Grand super corrective wave IV and it will last 55 years. That means gold price not to go higher than 2011 at $1923. Lara may have to revise the duration if gold goes above 1923.
AVI did not provide his super wave chart for us to review.
I question his analysis.
May be TKL can study grand super cycle of gold by Lara.
Good day.
I have done that already when she first published it. I still stand by her analysis.
Gold moved above 1,161.85 at 1:40 am Monday so
we now use the alternate hourly wave count, which has an upper price target of
1,165 and upper invalidation point of 1,195.45 and has no lower price target,
however the minuette wave (v) and minute
wave i circle appears at the same lower target area on the chart (about 1,125) as
the main hourly count but has no price beside it. It may take 16 hours and end on Monday or less likely take four days. A new
low below 1,131.09 would confirm that intermediate wave (3) down is underway
and invalidate alternate daily wave count.
Maybe for who is interested I have a small alternate for Lara’s alternate which is a little bit more likely – but does not change much in respect to expected direction and target. My first target would be 1137.30 (i = v). Projected fib-levels have already a nice match.
It sees the triangle as x in a combination. Problem I have with this (and also with Lara’s alternate) is that the first ((A)) of w is a three and not a five.
That looks good. And you’re right, it makes no difference to the target or expectation of one more wave down.
This
could take the better part of the day: With 1155 currently holding, hard to see
gold price break below 1149-47 in a hurry; upside risk 1206 opens up subject to
a sustained break above 1164-65….Let’s see what happens…. !
Spot gold has just gone up to 1163.21, thus invalidating the triangle. We will need to revert back to the double zigzag.
yes. Price hit 1164.21 and has now turned down. Do you think the C wave is complete?
The surest way to tell is if it drops below 1151.28, from which it started. I was quite sure the point 1164.21 was the third (of 5) subwave of the C wave. But it looks like the current drop went into the first subwave territory, so it is dubious whether it is the fourth subwave. Perhaps 1164.21 really is the fifth subwave and wave C has ended.
Trust in Lara
Agreed. But she has not gone that far yet in time, unless she updates. We are making best guesses based on the most probable future path as and when fresh data presents itself. This is a difficult task as the guess has a good chance of becoming wrong. That is why I don’t see many analysts try to analyse the market on the fly. It is much easier to do so on hindsight when more information is complete.
Thanks a lot for your guidance Tham.
This makes me very nervous. Trust in your own judgement, and use my analysis as one tool in your toolkit.
Sometimes, as you know, I’m wrong. When that happens you need to have your own TA to make decisions from.
You are correct thank you.
It takes a courageous person to admit that he/she is wrong. Like I said in my response to Richard just now, very few analysts dare to put out their neck and give a running commentary on the market. There are just too many possibilities at any point in time, too many probable paths that price could follow. The market is akin to Wonderland that Alice encountered in which logic may or may not be correct. However, we as day traders have to make do with whatever inferences that we can deduce from the information available. Some time tested momentum indicators and candlestick analysis could help.
Price dropped to a low of 1153.95. It is just higher than the end of subwave 2 of C, so subwave 4 may still be correct. Let’s see if the bounce brings us higher than 1164.21. If so, subwave 5 is underway to complete at probably 1166. If it does not break 1164.21 then minuette 5 is underway.
Price has settled below 1151.28, so either the double zigzag is invalidated, or else minuette 4 has ended at 1164.21 (I am not too satisfied with this point) and we are now in minuette v down.
I also quite like the revised triangle idea mooted by fencepost above, by shifting the micro c and d points to 1164.21 and 1150.47 (the recent low) respectively. Then this wave up will be micro e to terminate the triangle.
It is a breakout from triangle and target is below 1195.
Yes double zigzag.
Gold Commitments of Traders Report
Dan Nocini
Let me take a moment here to express my utter disdain at the charlatans in the gold cult who are once again out making more excuses for their pathetic predictions of soaring gold prices, etc., By now you know the usual drill – make fearless (and idiotic) predictions of “this is it”; “gold to soar”; “Chinese and Indian buying to take gold to new highs”, blah, blah and more blah. When gold drops lower and their useless predictions are found to be vapid, they trot out the usual “this is official sector selling of the gold market to suppress the price”, drivel.
Read more below…………
http://www.kitco.com/ind/Norcini/2015-03-10-Gold-Commitments-of-Traders-Report-Speculators-In-a-World-of-Hurt.html
Nine consecutive red daily candlesticks is longest streak in 40 years. Price is hovering around the lower daily trendline. I see a quick new low below $1146 which briefly breaks this trendline before a bounce begins. $1131 will hold for now.
Lara: Why invalidation for Hour count is 1161.85?
EW wave (i) green is near 1195. Wave (iv) green should not enter the price point of wave(i) green.
Thanks.
That is point for invalidation of the triangle because wave e cannot move higher than wave c
Exactly.
NZD chart showing bearish pattern along with all major currencies of the world. Strong USD leading the charge. Later a combo chart of USD and Gold will be posted.
The weekly chart for NZD shows its bull market top was a 5 point
triangle reversal pattern. Eight weeks ago it broke out of a little red bearish falling flag with a backtest two weeks ago. (Rambus)
I just realised I’ve not updated my NZDUSD charts on Elliott Wave Gold for you all. It finished a second wave correction and now is in a third wave of a third wave down. I have a sell on this which is profitable (it was in the first day, yay!) and I intend to hold my trade for a few weeks.
We have had Tropical Cyclone Pam head down and just past New Zealand in the last 24 hours, it’s off our east coast. My internet connection is down and I’m using a mobile connection which is not so good. When my line is repaired I’ll update those charts for you all. I should have uploaded one when I saw the sell opportunity set up.
Interesting Papudi that your traditional TA points to the same thing; down.
Lara, I wasn’t even aware of Cyclone Pam till you posted. I pray you stay safe. Glad the storm has weakened and so sorry for the people in Vanuatu. Keep us posted on your wellbeing!
Gold price remains bearish but with 1152/51 holding is showing signs of bottoming here…. In a late move, gold price has spiked to 1158/59…. Upside 1162-65 is still seen limiting and remains to be seen if gold price can break above these levels; a short term rally (up move) is expecting…. With an inside day, I’d be cautious of a break on either side of the range….
In the Alternate Hourly could Y be a leading diagonal taking us to 1166ish?
so W would be A , X would be B and Y would be C which is a leading diagonal? I Guess if I dont ask I wont learn.
Your idea is correct, only your nomenclature isn’t.
Yes, minuette wave (iv) could be a flat correction labelled subminuette waves a, b, c. Subminuette wave c would be an ending diagonal, not leading though. Not so much difference really. The main difference is ending diagonals must have all their sub waves as zigzags.
I’m not publishing that idea though because it would see subminuette wave c move substantially outside of the green downwards sloping channel. Because price is finding good resistance there it looks like that may continue.
This idea would see minuette wave (iv) take quite a lot longer to complete.
Thank you.
Also if you do notice a high probability turning point for US Oil can you pls let us know as it should be lucrative
Me too.
According to my computations, oil is completing Intermediate 4 Minor B pretty soon. Minor C ought to give some chance of profits before the large drop of Intermediate 5 to new lows (another profitable setup).
Great report Lara!!!
So Monday thru Wednesday the daily alternate may get invalidated once gold meets the target of 1128.
Yes, if the target is met.
If the target is not met then how high the next bounce goes may tell us which wave count is correct. If the bounce finds strong resistance at the upper blue trend line and doesn’t breach that, the main count will be strongly preferred.