The target for upwards movement to end was at 1,191 – 1,193. So far price has reached up to 1,191.72.
Summary: Monday’s candlestick is closing outside of the base channel, so as warned I must swap the wave counts over. The main wave count expects more upwards movement, with the target at 1,320 which may be met in another 30 sessions. The new alternate (which was the second alternate in last analysis) also expects more upwards movement, but only to 1,203 – 1,205 to be reached tomorrow.
Click on charts to enlarge.
Main Daily Wave Count
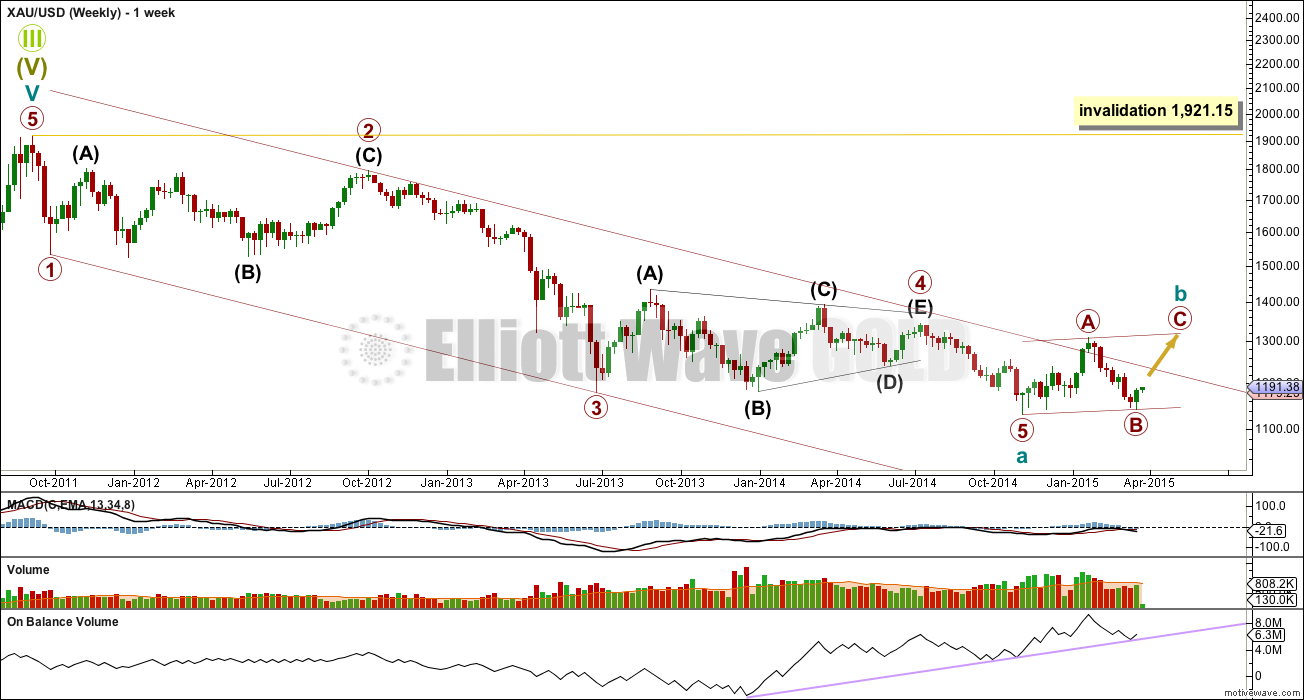
This new main wave count sees a five down complete at the weekly chart level for cycle wave a.
Within cycle wave a there is perfect alternation between the deep 0.68 running flat of primary wave 2 and the shallow 0.27 triangle of primary wave 4.
Ratios within cycle wave a are: primary wave 3 is 12.54 short of 1.618 the length of primary wave 1, and primary wave 5 has no Fibonacci ratio to either of primary waves 1 or 3. Primary wave 1 lasted a Fibonacci 3 weeks, primary wave 2 lasted 53 weeks (two short of a Fibonacci 55), primary wave 3 lasted 37 weeks (three more than a Fibonacci 34), primary wave 4 lasted 54 weeks (one short of a Fibonacci 55) and primary wave 5 lasted 17 weeks (no Fibonacci duration nor ratio to other primary waves).
Cycle wave a lasted 37 months, three longer than a Fibonacci 34.
Cycle wave b should last one to several years in total. Because cycle wave a subdivides as a five, cycle wave b may not move beyond its start above 1,921.15.
Cycle wave b must be a corrective structure. So far the first upwards wave within it labelled primary wave A subdivides only as a five wave structure. This indicates cycle wave b is either a simple zigzag or the first structure in a double is a zigzag. The degree of labelling within cycle wave b may be moved down one degree, and may be that primary wave A is unfolding as a zigzag with cycle wave b a flat correction.
In the first instance a zigzag is unfolding upwards. When it is complete then alternate wave counts will be required to manage the structural possibilities for cycle wave b. It may be that it is a relatively quick zigzag which would be over there, or that may be the first zigzag in a double zigzag, or the first structure in a double combination, or only wave A of a flat correction or triangle.
There is strong divergence with price and On Balance Volume at the end of cycle wave a. Primary wave 5 was a relatively short wave, which is common for fifth waves following triangles. If this wave count is correct then while cycle wave b unfolds OBV should find support at the trend line drawn. A breach of that trend line would favour the alternate wave count.
Since the low of cycle wave a volume for the weekly chart is higher for up weeks than down. This favours this main wave count at the weekly chart level.
I must swap the wave counts over with a breach of the black channel about primary wave B downwards. I consider this main wave count and the alternate below to have about an even probability at this stage.
After consideration at the weekly chart level I have moved the degree of labelling within cycle wave b up one degree.
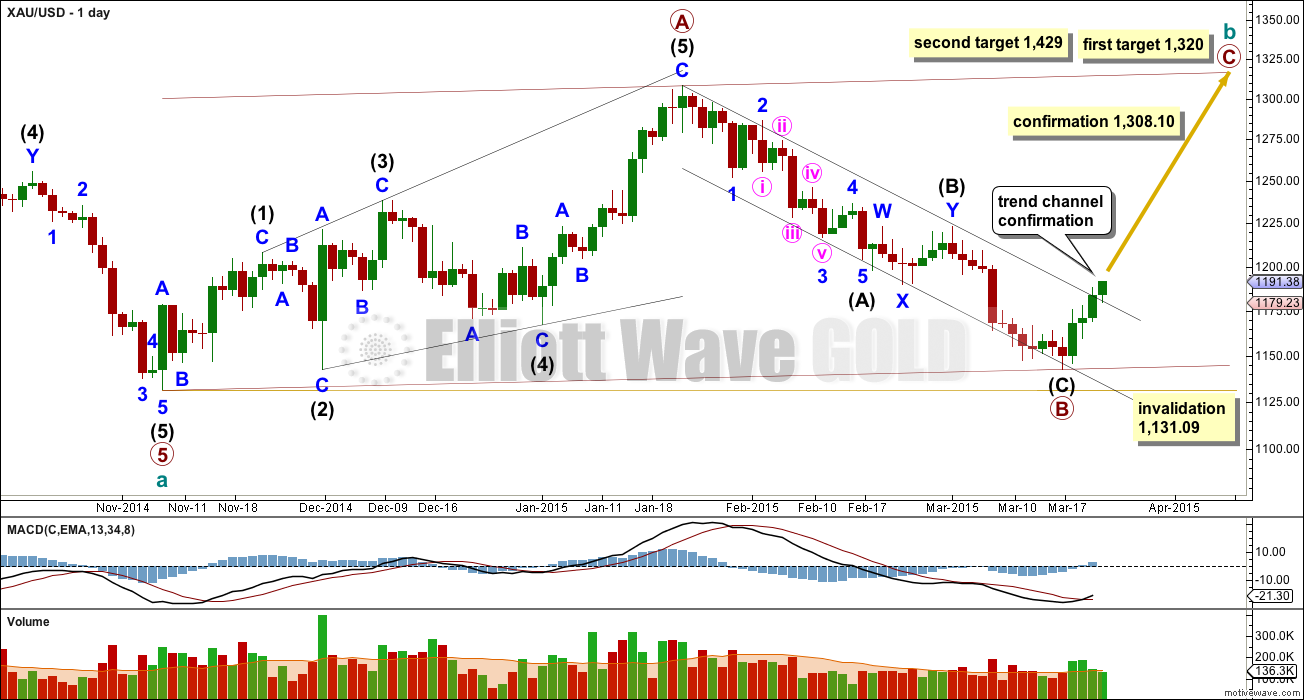
A new high above 1,308.10 would invalidate the alternate and confirm this main wave count.
I have checked to see if primary wave A could be seen as a three wave structure and I cannot see this as a possibility which meets all EW rules. I am confident that this piece of movement is correctly labelled as a five wave diagonal.
Primary wave B may not move beyond its start below 1,131.09 because primary wave A subdivides as a five.
At 1,320 primary wave C would reach equality in length with primary wave A. This would complete a 5-3-5 zigzag trending upwards. At that stage alternate wave counts would be required to manage the various possibilities for cycle wave b.
At 1,429 primary wave C would reach 1.618 the length of primary wave A.
Because primary wave A is a diagonal then it is highly likely primary wave C will be an impulse in order to exhibit alternation. Primary wave C may end about the upper edge of the channel drawn about cycle wave b.
This wave count sill has problems of structure within primary wave 5 of cycle wave a:
– within primary wave 5 intermediate wave (2) is a running flat within its C wave, looking like a three and not a five.
– within intermediate wave (5) the count is seven which is corrective; either minor wave 3 or 5 will look like a three wave structure on the daily chart where they should be fives.
Primary wave C must subdivide as a five wave structure, most likely an impulse. Within it the first five up is incomplete.
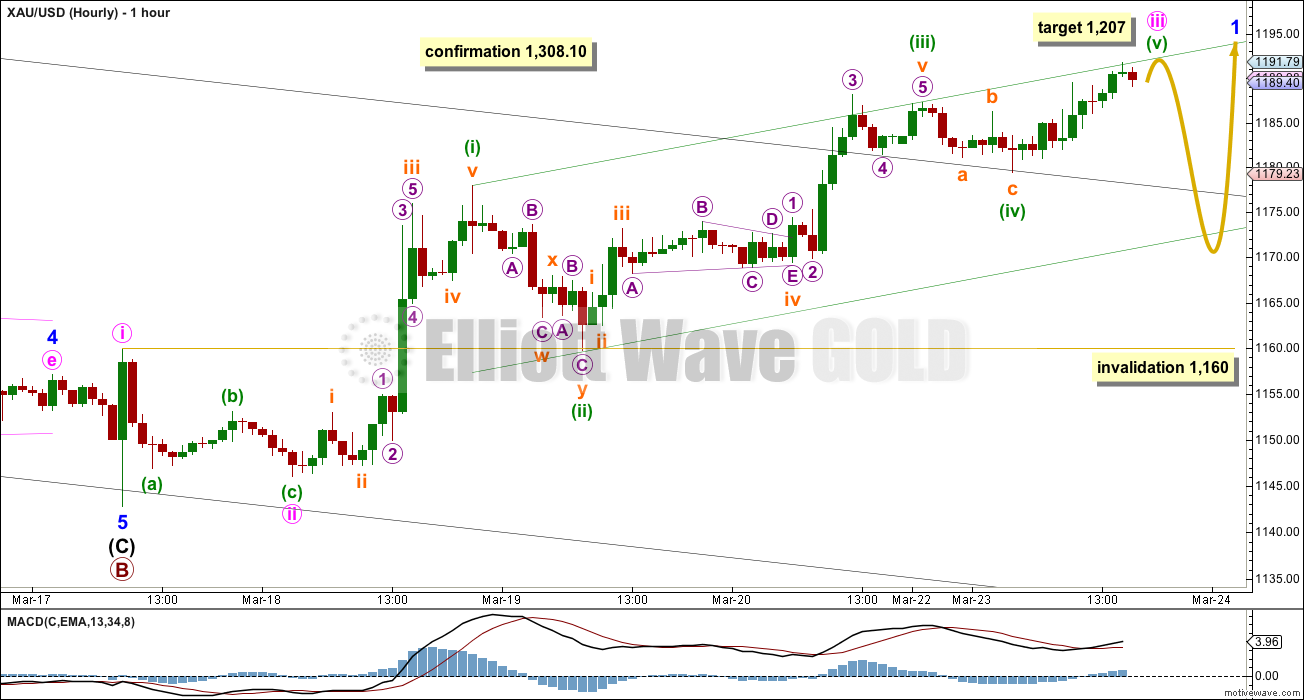
The low of minuette wave (ii) at 1,159.72 overlaps the high of minute wave i at 1,160, slightly, so this cannot be a fourth wave correction. Because of this small overlap upwards movement is an incomplete five, beginning with two overlapping first and second waves, and a third wave now may be seen as complete.
My concern today is mostly with this hourly wave count because it does not agree with momentum: minuette wave (iii) is weaker than minuette wave (i). Sometimes this happens, and as long as the third wave has not the weakest momentum of 1, 3 and 5 then it may be acceptable.
There is no Fibonacci ratio between minuette waves (iii) and (i). At 1,207.03 minuette wave (v) would reach equality in length with minuette wave (iii). This target is also a maximum for minuette wave (v) because a third wave may never be the shortest.
When minute wave iii is a complete impulse then minute wave iv should unfold. It may be quick and not show on the daily chart because minute wave ii does not show on the daily chart. Minute wave iv is most likely to be shallow and sideways. It may not move into minute wave i below 1,160.
Draw a channel about minute wave iii using Elliott’s technique: draw the first trend line from the highs of minuette waves (i) to (iii), then place a parallel copy on the low of minuette wave (ii). When this channel is breached (if?) then minute wave iii would be confirmed as complete and minute wave iv as underway. Minuette wave (v) may end about the upper edge of the channel or it may overshoot this trend line. The structure of minuette wave (v) on the five minute chart is very difficult to see as complete at this stage.
Alternate Daily Wave Count
This was a new second alternate for yesterday’s analysis.
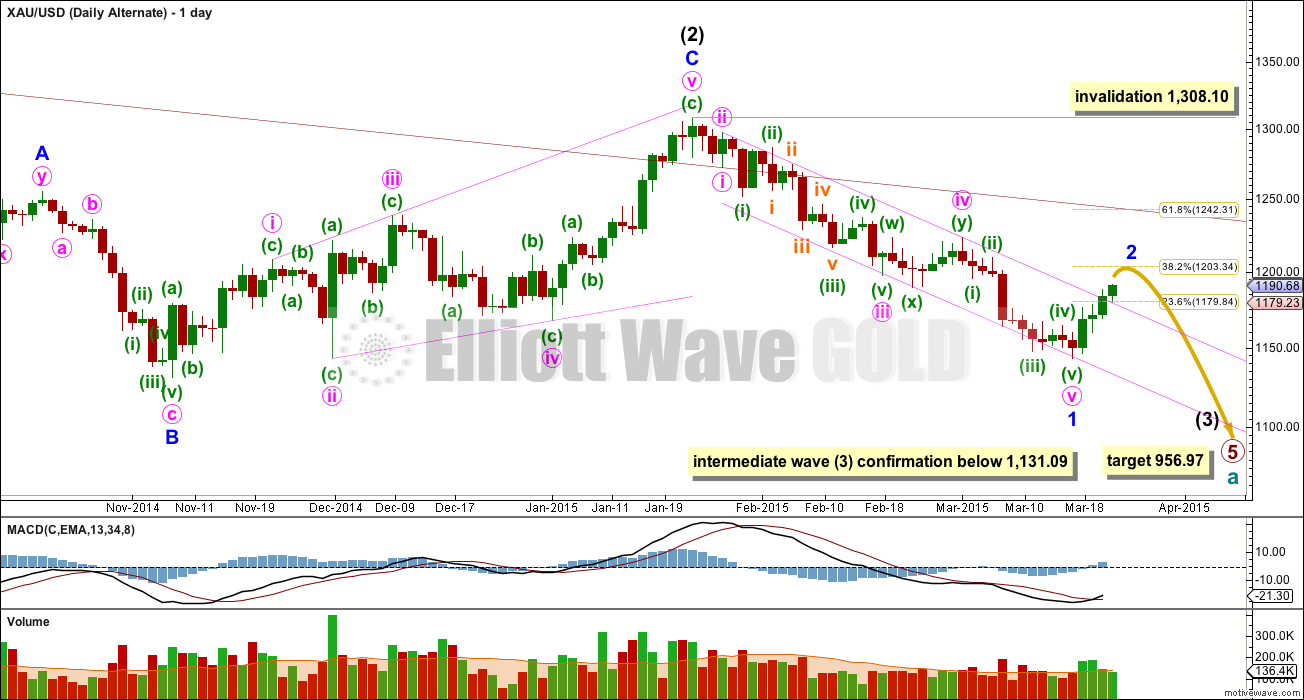
This alternate wave count sees Gold as still within a primary degree downwards trend, and within primary wave 5 intermediate wave (3) has begun. At 956.97 primary wave 5 would reach equality in length with primary wave 1.
At 956.97 primary wave 5 would reach equality in length with primary wave 1. Primary wave 5 may last a total Fibonacci 55 weeks. So far it is now beginning its 36th week.
The maroon channel about cycle wave a from the weekly chart is now breached by a few daily candlesticks and one weekly candlestick. If cycle wave a is incomplete this channel should not be breached. The breach of this channel is a warning this wave count may be wrong.
This wave count still has a better fit in terms of better Fibonacci ratios, better subdivisions and more common structures within primary wave 5, in comparison to the main wave count above.
Within intermediate wave (3) minor wave 1 is a long extension. Within minor wave 1 minute waves iv and ii are grossly disproportionate, with minute wave iv more than 13 times the duration of minute wave i.
Minor wave 2 may not move beyond the start of minor wave 1 above 1,308.10. Minor wave 2 may complete in one more day to total a Fibonacci five. It may end about the 0.382 Fibonacci ratio. Because this is a second wave within a third wave one degree higher it should be expected to be more brief and shallow than a second wave correction normally is.
A new low below 1,131.09 would confirm that intermediate wave (3) down is underway.
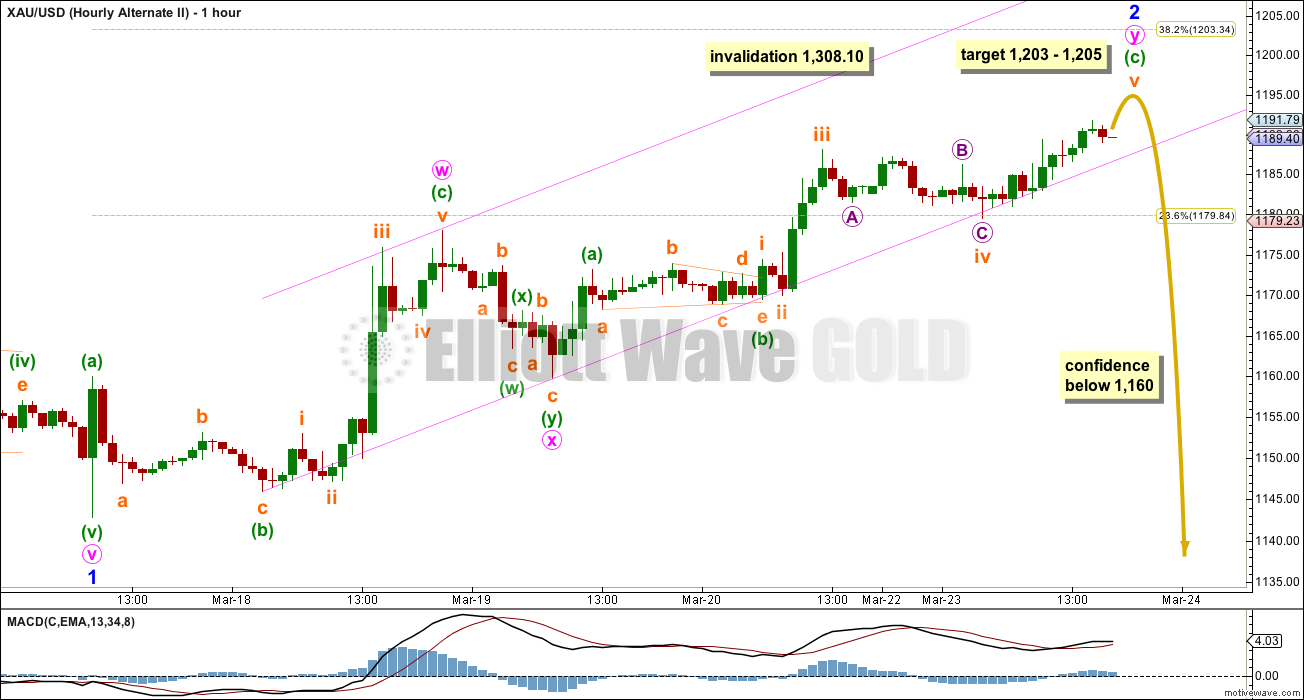
The structure at the hourly chart level at this stage has a better fit than the main wave count, particularly the triangle labelled minuette wave (b) within minute wave y.
Minor wave 2 may be unfolding as a double zigzag, with the second zigzag in the double close to completion. At 1,205 minuette wave (c) would reach 2.618 the length of minuette wave (a), and at 1,203 minor wave 2 would reach the 0.382 Fibonacci ratio of minor wave 1.
Once the final fifth wave upwards is complete, thereafter a new low below 1,160 would add some confidence to this wave count. It would still require a new low below 1,131.09 for full confidence in the downwards trend at primary degree.
At the hourly chart level the decrease in momentum would be expected. This hourly wave count fits better with MACD.
This analysis is published about 05:44 p.m. EST.

1193 is going to be hard to top with momentum dropping
Analysis just issued for GDX and SILVER
GDX and gold are disconnected today. Looks like GDX is extra vulnerable for a drop if gold falls.
Miners need momentum to stay high, they got pumped up full of bullish sentiment for 5 days and today stalling, bullish sentiment starts to fade away people losing interest and take profits. Yes GDX reacts more to gold drop today as less buying interest.
Lara
Is minute wave iii circle (1,200 area) over already or is gold just in the process of heading up to finish it now? If not finished do we still have the same upper targets then lower targets?
I was thinking of buying DUST for the minute wave iv circle move down. If that hasn’t started yet when might it finish?
I think minute iii is over already and this chop is minute wave iv as a running triangle. It needs only the final minuette wave (e) to complete the triangle.
So I’ll be looking for one last short gasp when that’s done; minute wave v will likely be short and brief.
Then minor wave 1 will be done and minor wave 2 should unfold down for two or three days.
Any idea when minute wave v, minor 1 may end?
Would that be overnight or during Wednesday’s session?
As I’m looking to buy DUST for minor wave 2 down?
Most likely during Wednesday’s session. I expect one more green candlestick or doji for Wednesday to make a new high.
This fits with gold options expiration which has a sweet spot of about 1200 for tomorrow.
Next stop 1188?
price should now find strong resistance @ 1193 correct anyone?
I expect gold to do it’s regular corrections on the way up to finishing the target in the 1,200 area Lara gave for gold today.
Up to 1205? After reaching 1205. where do you expect gold to drop to?
IF IF IF minute wave iii circle isn’t over yet then from upper zone of, upper trend line to 1,207 max, then gold may drop in minute wave iv circle to breach the lower green channel and possibly even below 1,160. There is no lower target just to breach the lower green channel. Should be short and quick and not show up on the day chart.
I am not familiar with your use of the word “circle” in your posts.
Waves are labeled in circle or () on Hour chart.
I can’t type a number with a circle around it here but the circle shows up on the charts.
Main hourly beside target 1207 iii, which has a circle around iii for minute wave iii, circle.
It may happen after hour . AND tomorrow morning gold start going down to your target.
If gold goes below 1160 that will invalidate the current bullish count.
Richard
According to primary wave now gold is expected to correct to 1170 or so. There is no fib target for this corrective wave and supposed to last brief. Not to show up on daily chart.
Am I right?
Yes except.
I was still looking for gold to finish going higher first to 1,200 area before heading down to 1,170 or to below 1,160.
However nobody agreed with me even though I presented my count that 1,186.06 at 9:40 am only finished the subminuette wave iv of minuette wave (v).
Gold did go down fast today with pressure from rumours from a Fed President today who wants interest hikes to happen in June. That slowed gold from going back up earlier.
Still gold is slowly working it’s way back up today and may still hit 1,200 area today then it could drop to the lows people want right now.
Rising wedge
and narrowing down…. but can break downwards and can see 1168-1170 level
Yes, I’m following the rising wedges in GDX and bonds (TLT) with negative OBV divergences.
Yellen set the trap and williams just triggered it!
FEDSPEAK for don’t run to the safe haven assets just yet!
The View from Here: The Economic Outlook and Its Implications for Monetary Policy
Presentation to Australian Business Economists
San Francisco, CA
By John C. Williams, President and CEO, Federal Reserve Bank of San Francisco
For delivery on March 23, 2015What I see when I look at the data that strip out the short-term volatility is an economy that’s got a good head of steam and is getting close to full employment and an inflation trend that’s running about 1½ percent based on the trimmed-mean measure. That’s why, as things continue to get better, I see the strengthening domestic economy overwhelming the energy and currency valuation impacts, and inflation gradually moving back to 2 percent.
Inflation expectations from business and consumer surveys are generally consistent with that forecast. On the other hand, financial markets are sending mixed signals, with declining yields on inflation-indexed securities suggesting that inflation expectations may have fallen. It’s always important to listen to what financial markets are saying. But it’s also important to note that the research shows the meaning of these movements is not definitive.7 And while markets are important, interpreting their fluctuations is not a substitute for the economic research and analysis we look to when thinking about economic developments and determining appropriate policy.
http://www.frbsf.org/our-district/press/presidents-speeches/williams-speeches/2015/march/monetary-policy-federal-funds-rate-normalization-sf/
I also think GLD is at a very interesting level here.
Looks like that gap will fill with a wedge (i.e. diagonal?)
I think gold at 1,186.06 at 9:40 am just finished the subminuette wave iv of minuette wave (v). Now gold is moving up in subminuette wave v of minuette wave (v) to end minute wave iii circle at breach of upper trend line or up to a maximum of 1,207.03. That or else the high for subminuette wave v (c) y 2 may be up to a zone of 1,202 – 1,205. Then gold may drop in minute wave iv circle to breach the lower green channel and stay above 1,160.
A new low below 1,160 would add confident to the alternate wave count.
Can someone please confirm that gold is still moving up today’s to the target’s of a range of upper trend line or 1,202-1,205 to maximum of 1,207.03 then heading down below green line (about 1,175 zone)???
Or did I already miss the boat heading up and now gold is already heading down below the lower green channel?
I’m counting on the latter, but I’m not confident.
i am also counting on gold moving below 1160. This wave ii must be over????
Many would prefer gold move below 1,160. However I find it very hard to believe that gold has already peaked today at only 1,195.12 at 7:00 am. I think gold just started subminuette wave v of minuette wave (v) at 1,186.06 at 9:40 am?
None of the above. The economic news of the day has already passed and gold seems to be content bobbing around (and will likely close) on either side of 1190.
So, is the trend down? Which wave count do we think we are on?
I think the trend is up at minute degree and minor degree at the moment. A larger correction should be coming up, but it needs one more wave up first.
Elliott Wave 5.0
Wednesday, June 26, 2013
it is far more important to watch the gold stocks then gold itself as the shares will put a bottom to gold not gold putting a bottom to gold shares. The same will apply when we get to an extreme top as gold stocks will diverge giving us an early warning that gold the metal is also finished.
Gold daily HnS around EW waves turning points. Old neckline of bottom Hns now resistance and top HnS right shoulder just forming at wave iii turn.
papurdi great chart thanks.
Are you expecting top trend line to get hit today, meaning we are still going higher today, before dropping or was today’s high of 1,195.12 at 7:00 am the top of the right shoulder?
Top TL is NL extension. Lara’s target is just below.
I think today is over . But gold may hit tomorrow.
Then gold will try NL.
Thanks for sharing that! A really interesting chart.
More upside for the dollar over the medium-term, Peter Oppenheimer, chief global equities strategist at Goldman Sachs, told CNBC.
http://video.cnbc.com/gallery/?video=3000364273
This is from a Jan 21 MIDASLETTER titled:
Gold Price: Bull Run Or Bear Trap?
Gold has been on an upward tear these last few sessions, suggesting that there is every possibility a bull phase has begun for the monetary metal based on certain macro-economic factors. But does the current move portend a trend? Or is this just yet another one of those booby traps gold’s market puppeteers are now famous for?
I think Laura may have seen a few of these in here experiences.
http://www.midasletter.com/2015/01/gold-price-bull-run-or-bear-trap/
I’m going with 1180
Nice resistance at 1193. 1205 or 1180 next?
I’ve seen other charts similar to this, showing a possible correction in the USD to the 92-94 range. This could possibly help push gold up to the 1240 range before the USD resumes the uptrend and gold resumes the downtrend?
Bones posts some good charts out there on stock twits…
Lara: “The target for upwards movement to end was at 1,191 – 1,193. So far price has reached up to 1,191.72.”
Gold just hit the target 1192.77. Let us see if it holds and get some retracement after one week of up trend??????
Found this chart posted by Daedal. Equal monthly bars, starting in Aug and ending in Mar. Still looks bearish?
BobB
I had posted similar chart of gold other day.
Interesting!!!
My take in this new bull trend is nothing but the gold’s strong seasonal.
After Feb – march low comes the April high and final low in summer.
Lower high lower low till summer.
Lara, thanks for posting the new main wave count. This is the ABC I was referencing over the weekend. I am having a difficult time shifting my mind from 956 to what is now 1320. I’ll be curious to see the new GDX count.
Hi. In my view, a break above 1187-88 set the tone
yesterday… signalled an interim bottom at 1144/43 and opened up upside risk 1267-68 with 1307-08 on the outside notwithstanding currently 1190-91 resistance and above there 100dma at 1206-07/50dma/upper Bollinger….So there is still a long way up for gold price to go. One never knows, gold price could still get stalled at 100dma and begin to roll on back down. Wouldn’t that be great! For now, it is my sentiment to initiate longs….
I’m having trouble making that shift too to be frank, but I must. The market will tell us, and so far there are indications that we’ve had a more sizeable trend change. Unfortunately the confirmation point for the EW count is 1,308.10 which is really close to the target. But I don’t think 1,320 will end it actually, and I may need to review the degree of labelling within cycle wave b in coming days.
I can tell in your video, you don’t seem to have the same swagger in your voice as 2 weeks ago. For what it’s worth, Avi Gilbert has this same main wave count he is looking at, and it fits with current COT structure being bullish. Your EW work was just so fabulous from 1308 down to 1142….
I’m working on new wave counts for Silver and GDX today. In light of the new wave count for Gold I need to go back to weekly chart levels and see if the same idea can work for Silver and GDX. Should be published later today.
A VIEW: Gold price overbought but still bottomy; short term up move / rally expecting; close shorts, initiate longs… Gold price is finding support at 1187-86/pivot with 1182/81 below there not likely to reach! lol…. 🙂 CAUTION with the longs, gold price is overheated!
Should or how could silver continue downward while gold is in a trend change? I think the G/S ratio would diverge to the extreme and the end result would confuse the *=+# out of the mining stocks!
That’s one thing I was wondering about as well. Though I’m still in the bearish camp, I’m completely confused as to where gold is going. I suspect it’s a fake-out rally, but Lara’s current main wave may be correct in calling a bottom. If it is a bottom, I assume that silver would spike up and be even more powerful than gold.
Of course, this could also be the seasonal rally for the gold-buying Hindu holiday Akshaya Tritiya, which is on 21 April 2015. I have not heard much hype about that holiday since gold was in its decline a couple weeks ago.
There is no doubt in my mind that this is a small rally within a larger bear market. I know that because the end of a multi year trend and reversal looks different and is way more volatile when the change of direction takes place.
The question to me right now is does gold only rise to 1203-05, or will it get closer to 1240 before it drops. For it to be an effective 3rd wave down with some power, it is going to have to hit a lot of stops. In other words, it will have to catch most traders off guard.
Silver went up a higher % than gold last week then tomorrow they peak because overbought and drop.
As gold primary and alternate daily charts have roughly equal probability, looking to silver may be useful. Silver daily points down which supports gold alternate daily. Just an idea, I am no EW expert.
Silver didn’t meet target it is still up. Gold met target but it has been revised to up, so silver and gold going same direction so no confusion.