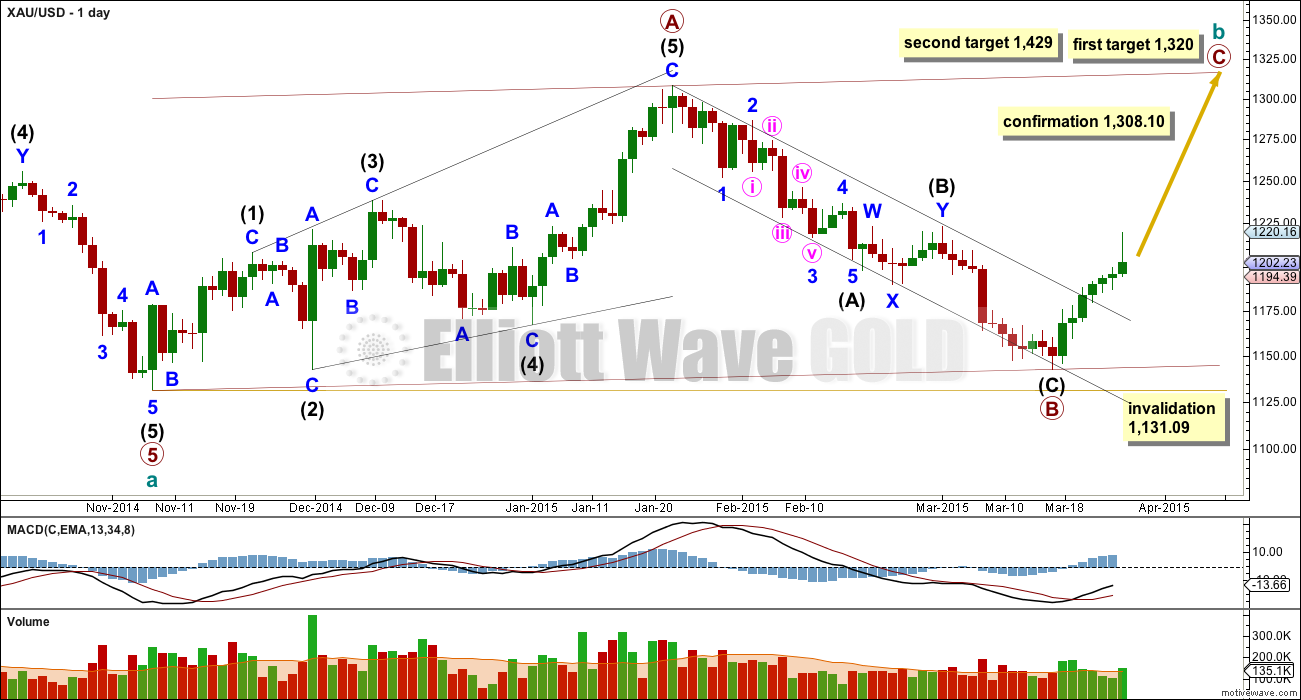
Upwards movement was expected, but the target at 1,204 was comfortably exceeded by 15.99.
Summary: I expect a short term correction for the main wave count; minor wave 2 may have begun and the target is at 1,172. This trend change is unconfirmed though, so the channel on the hourly chart must be breached to have confidence in this trend change and the target. The alternate wave count requires strong downwards movement to begin now for a third wave within a third wave. If downwards movement breaks below 1,142.82 the alternate wave count should be seriously considered, and the main wave count would be invalidated at the hourly chart level. A new low below 1,131.09 would provide full invalidation of the main wave count and confirmation of the alternate.
Click on charts to enlarge.
Main Daily Wave Count
There are more than thirteen possible corrective structures that cycle wave b may take. At this stage it is unclear what degree to label this big movement. I will leave labelling as is at primary degree, but it is equally possible that this degree may be moved down one level and primary wave A is an incomplete zigzag.
Cycle wave b may be a single zigzag as labelled, but may also be a double zigzag with the first zigzag unfolding as labelled. It may be a triangle with only primary wave A zigzag incomplete, or a double combination within a zigzag for primary wave W incomplete. It may be a flat correction with primary wave A as an unfolding zigzag. All these structures are equally likely. Of all Elliott waves, B waves exhibit the greatest variety in form and structure and are the hardest to label correctly as they unfold.
When the big zigzag labelled primary waves A-B-C is complete I will have alternate wave counts to manage the various possibilities for cycle wave b. When the big zigzag is complete that does not mean that cycle wave b must be complete, and only means that if cycle wave b is a single zigzag it would be complete there. All other possibilities will remain open.
A new high above 1,308.10 would invalidate the alternate and confirm this main wave count at primary and cycle degree.
The upwards wave labelled primary wave A fits only as a five wave structure, a leading expanding diagonal. Within a leading diagonal the first, third and fifth waves are most commonly zigzags, and the fourth wave should overlap first wave price territory. I have tried to see this movement as a three; if it is a three then wave A would end at the high labelled intermediate wave (3) within primary wave A. That would see wave A a leading contracting diagonal, but within it the third wave would be longer than the first. This violates the rule for wave lengths of contracting diagonals so that idea is not a viable wave count. This leads me to the conclusion that primary wave A is a five wave structure and cannot be seen as a three.
Because primary wave A subdivides as a five, primary wave B may not move beyond its start below 1,131.09.
At 1,320 primary wave C would reach equality in length with primary wave A. This would complete a 5-3-5 zigzag trending upwards. At that stage alternate wave counts would be required to manage the various possibilities for cycle wave b.
At 1,429 primary wave C would reach 1.618 the length of primary wave A.
Because primary wave A is a diagonal then it is highly likely primary wave C will be an impulse in order to exhibit alternation. Primary wave C may end about the upper edge of the channel drawn about cycle wave b.
This wave count sill has problems of structure within primary wave 5 of cycle wave a:
– within primary wave 5 intermediate wave (2) is a running flat with its C wave looking like a three and not a five.
– within intermediate wave (5) the count is seven which is corrective; either minor wave 3 or 5 will look like a three wave structure on the daily chart where they should be fives.
It is for these reasons that I will retain the alternate until price confirms finally which wave count is correct and which is invalidated.
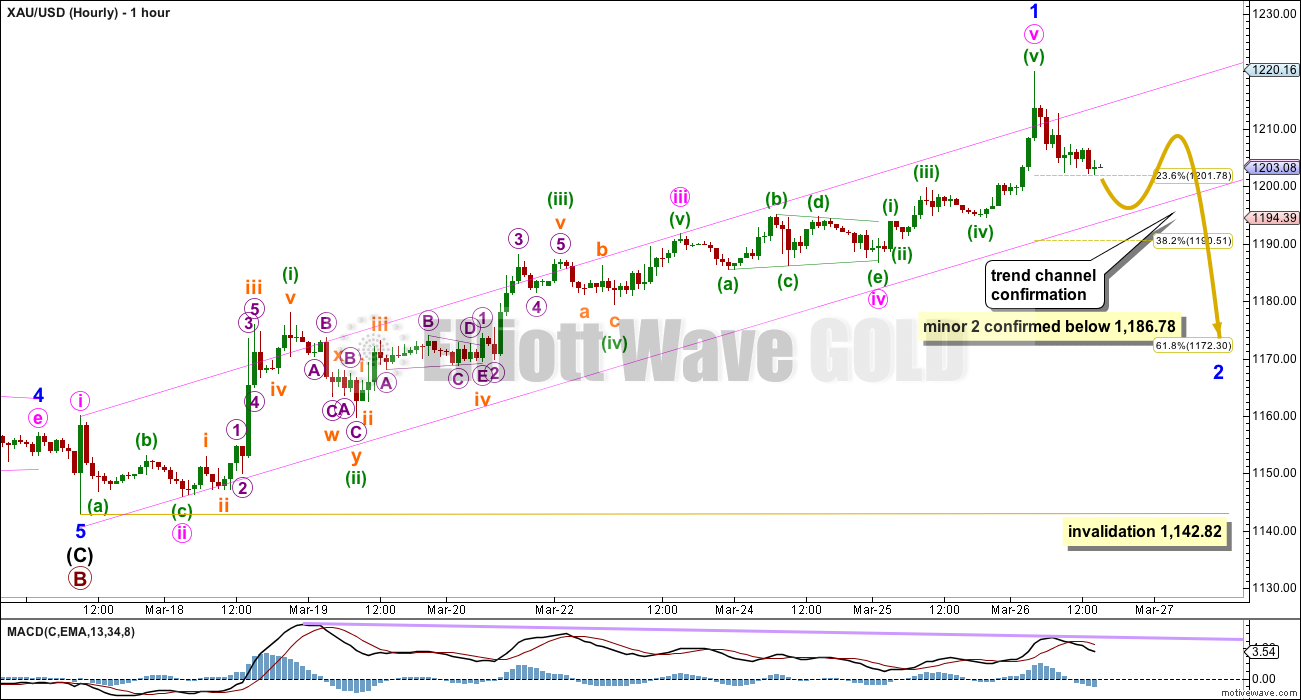
Minute wave v passed the target and equality in length with minute wave i. It has most likely ended with no Fibonacci ratio to either of minute waves i or iii.
Minute wave v exhibits a short sharp increase in upwards momentum, with an increase in volume on the daily chart for this session. This looks like a fairly typical “blow off”, a fifth wave typical of commodities. I had not expected to see this after a fourth wave triangle, but it is still typical behaviour for Gold.
The fifth wave overshoots the Elliott channel which also looks typical.
MACD shows persistent divergence: while price trends higher MACD trends lower. This supports the idea of a trend change, but it is not definitive.
This trend change is unconfirmed. The channel needs to be breached before confidence may be had in this change. Depending on your risk appetite you may also want to wait for a new low below 1,186.78 before you have confidence in this trend change and the target.
1,186.78 is the end of minute wave iv and the start of minute wave v. When price moves below this point it may not be a second wave correction within minute wave v, and so at that point minute wave v must be over.
Minor wave 1 lasted seven days, one short of a Fibonacci eight. Minor wave 2 would most likely last either two or three days, and at the most it may last a Fibonacci five. It is most likely to be a zigzag or multiple zigzag, and it is most likely to end about the 0.618 Fibonacci ratio at 1,172.
There is no upper invalidation point at the hourly chart level for minor wave 2. It may be a flat or combination, which may include a new high above its start at 1,219.99. Although this is possible it is less likely.
Minor wave 2 should see MACD return to the zero line. It should be a clear corrective structure, a clear “three”.
Minor wave 2 may not move beyond the start of minor wave 1 below 1,142.82. If this invalidation point is breached in the next few trading days, by any amount at any time frame, this wave count would substantially reduce in probability at the daily chart level.
Alternate Daily Wave Count
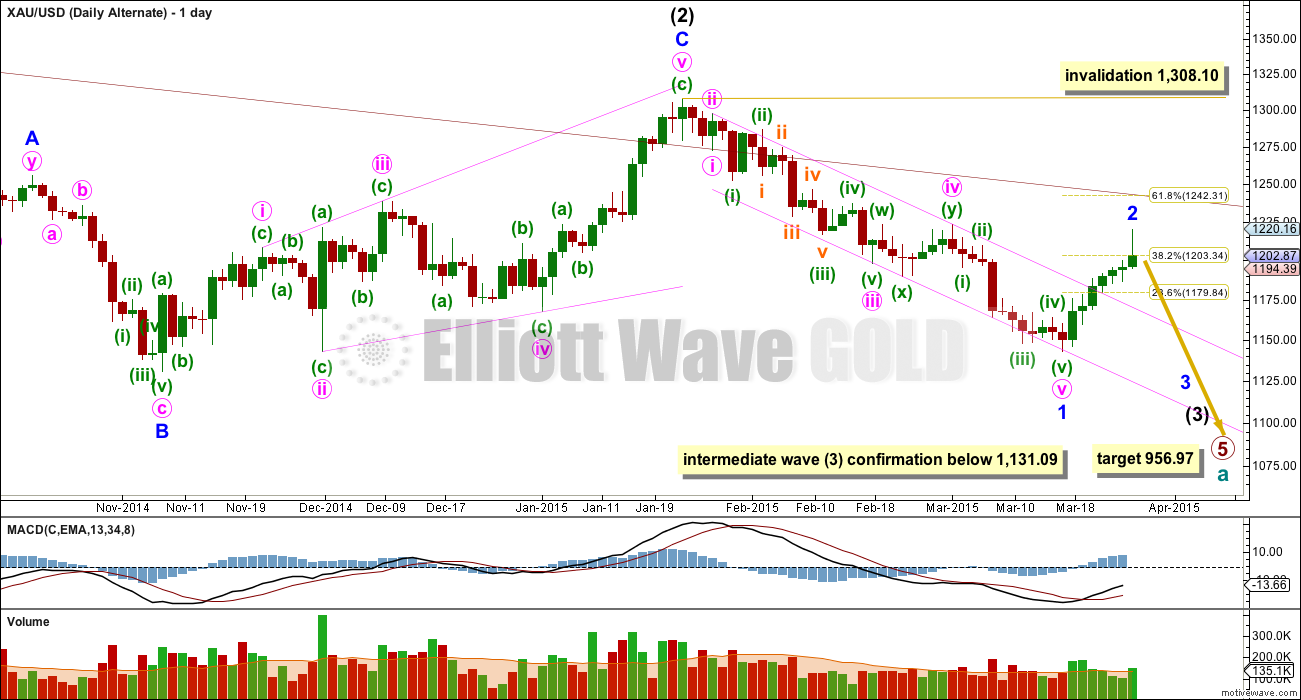
This alternate wave count sees Gold as still within a primary degree downwards trend, and within primary wave 5 intermediate wave (3) has begun.
At 956.97 primary wave 5 would reach equality in length with primary wave 1. Primary wave 5 may last a total Fibonacci 55 weeks. So far it is now in its 36th week.
The maroon channel about cycle wave a from the weekly chart is now breached by a few daily candlesticks and one weekly candlestick. If cycle wave a is incomplete this channel should not be breached. The breach of this channel is a warning this wave count may be wrong.
This wave count still has a better fit in terms of better Fibonacci ratios, better subdivisions and more common structures within primary wave 5, in comparison to the main wave count above.
Within intermediate wave (3) minor wave 1 is a long extension. Within minor wave 1 minute waves iv and ii are grossly disproportionate, with minute wave iv more than 13 times the duration of minute wave i. This also reduces the probability of this wave count.
Although the invalidation point is at 1,308.10, this alternate wave count should be discarded long before that price point is reached. If the maroon channel is breached again by one full daily candlestick above it and not touching it then I would discard this alternate wave count.
A new low below 1,131.09 would confirm that intermediate wave (3) down is underway.
This alternate sees upwards movement as a completed zigzag. Unfortunately, sometimes waves are ambiguous: they are not clearly either threes or fives. With the many subdivisions within this upwards movement it is possible to see it as both a three and a five.
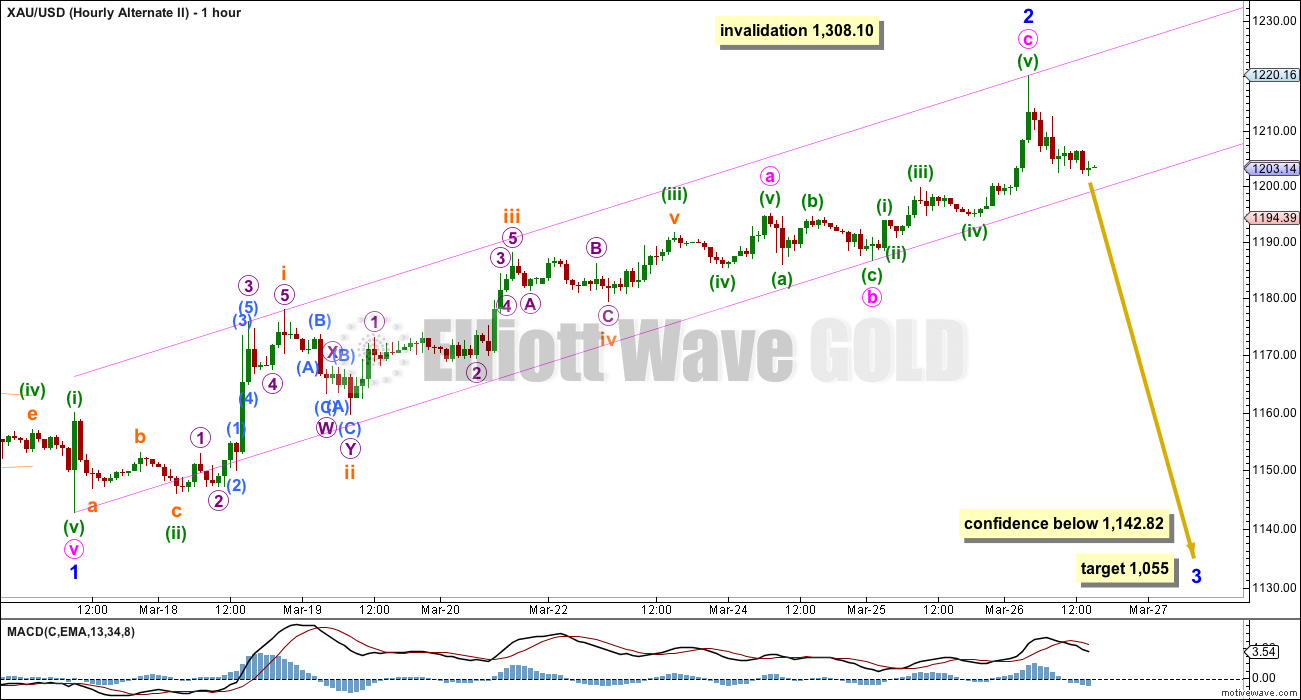
This alternate also expects downwards movement from here. Minor wave 3 should show a clear strong increase in downwards momentum. This is a third wave within a third wave which should gather momentum over the next few days. At 1,055 minor wave 3 would reach equality in length with minor wave 1. This target expects minor waves 1 and 3 to be both extended, so minor wave 5 to end should be shorter.
This wave count also requires confirmation of a trend change in the short term with a breach of the channel about minor wave 2 before any confidence can be had that minor wave 3 has begun.
For this alternate downwards momentum should be strong; MACD should cross well below the zero line. If this wave count is correct then we should see it confirmed within one or two weeks most likely.
While the trend change is unconfirmed it must be allowed for that minor wave 2 could move higher. If it does it may not move beyond the start of minor wave 1 above 1,308.10.
This analysis is published about 03:52 p.m. EST.


This week’s COT appears to be one of the most bullish in the past 5 years of data that I have. I am leaning toward main wave count now. Given the COT structure, I just can’t see much downside, the large specs are way too short and the banks are way too long.
I took some JDST profits off the table before the weekend. I am still holding the majority of my position.
I sold my DUST today at profits, not holding over this weekend with Yellen meeting and some indecision in gold along with a pending retracement.
Things will be clearer Monday.
I tend to agree as well. As Lara says, 2-4 more days of lower prices would set up some nice divergences to get into a long position. For now I continue to hold my DUST position which I added to today but will be looking long sometime next week most likely unless the picture changes. The COT data has uncanny correlation, you are correct!
The one thing I look at closest is the Swap net and the MM net positions. They are both almost even. The last time it was this way was July 2/9 report, but even that one wasn’t quite as bullish as this one. Maybe there is a downdraft early next week to really suck in large spec shorts, but then I can’t see how this doesn’t go up quickly.
maybe you should take a look at the Silver-Cot before you become too euphoric.
I have to go out now so end of week analysis will not be published until after the markets have closed.
My analysis will change very little from that given above. Minor 2 should continue overall downwards to most likely end 1,172. It may get there in another one day (unlikely) or two days (reasonably likely) or maybe even another four days (to total a Fiboancci 5, also reasonably likely).
The red candlestick for Friday is significant and fits nicely with the wave count.
Next week if the alternate is correct it should be confirmed.
Lara
Are your estimates still in place for a retrace up to $1,209 area (maybe today?), then a target for minor wave 2 to end at 1,172 in a few days?
I’m double checking because Janet Yellen US Fed is giving a talk today at 3:45 pm EST and I don’t want her to send gold rocketing and the US dollar dropping hard like her most recent FED FOMC talk, especially if I plan to buy DUST later today because already sold DUST today for profits. Thank you.
Good morning Richard. I am confident that minor 2 has arrived. I’m not confident of the moves within it.
If it’s a zigzag then the B wave within it can be quick and shallow, or just sideways. It does not necessarily have to have a deep retrace within this downwards movement.
The wiggly arrow really is to illustrate a corrective movement, not to show exactly where I expect price to get.
We have a red candlestick, that’s significant. On the daily chart that looks like minor 1 is over and minor 2 has begun.
The channel on the hourly chart isn’t properly breached yet, but it is overshot.
So far this downwards movement has too much overlapping for an impulse to be even close to completion. Once the channel is properly breached we may see an increase in downwards momentum.
TKL
What is duration for minuette 3? It can not go for ever.
If this sideways continues it must be over.
You’re right. This could still be minuette 2. The third wave has got to have stronger momentum, not the sideways one that is happening now. I guess trader sentiment is subdued before Yellen’s talk at 3:45 pm. If this wave count is correct, minuette 3 will surface then. It could be a spike up.
Gold isn’t reacting as expected during Yellen’s talk. The chart now looks very choppy with a series of nested 1-2s, so I have to rework the wave count. The only thing certain is that the short term trend direction is down, so the only safe conclusion to draw is that we are in minor 2. The action so far is confined within a downtrending channel. There is no indication yet of any break out of this channel, whether upside or downside, to enable an accurate assessment. Let’s see if Lara can decode this action. We might have to let the market sort this one out.
Enjoy your weekend.
Dollar rally sputters, traders eye Yellen comments46 Mins Ago
http://www.cnbc.com/id/102539577
Bullish bets on the dollar lost some steam ahead of comments from Federal Reserve Chair Janet Yellen.
Yellen will speak on monetary policy in San Francisco at 3:45 p.m. EST (1945 GMT) and traders will keep an ear out for clues on when the Fed may begin tightening monetary policy.
Gold price seems to be having a tough time getting past 1201-05 price zone with a break above here likely to seek 1215 with 1218-19 on the outside. I have my doubts if gold price can get to or above 1215 with the 20weekMA at 1211. Gold price will get hugely overbought at those levels which would not be sustainable. The bands have narrowed in too. Downside risk remains with a break below 1195. Tough one to call. Gold price is about ready to top and drop I think.
Based on pmbull.com
High 1,219.80 @ 4:09 am 26th
low 1,192.66 @ 9:50 am 27th
= 27.14
x .618
= 16.77
+ 1,192.66
= 1,209.43 Retrace target to buy DUST again.
Any comments?
That’s exactly how I’m trading it.
I’ll take minute c retrace as 1.382 of minute a, yielding just under 1172 for target.
Tham it sounds like you are agreeing on upper retrace target of 1,209.43 then gold drops down?
It looks like a 4th wave is correcting down down to 1197 then up we go to 1209.43?
I’m thinking more along the lines of minute b being a zigzag: 1192.66 – 1202.09 – (1196) – (1209 at 1.382 retrace). Minute b must be a 3-wave structure, and the zigzag fits.
That is great about $1,209 target.
(my mention of 4th was a very small wave only from 10:32 to 11:05 am)
Attached is my working hourly DUST chart. As you can see, I’m not an Elliott Wave practitioner but use Lara’s work to compliment my own TA to give me higher confidence in my entries and exists. I think DUST is building a bullish flag on top of the channel which will break to my upside targets over the next couple of days. I will be watching the flag closely for signs of a turn to add to my long DUST position.
DUST broke from bull flag. Is that correct?
Nice chart.
Not yet. The bullish flag is still building and has not broke out.
Hi papudi. Price has to touch the bull flag trendlines 5 times (very rarely 7 times or 9 times). On Mark’s chart, price has touched only the fourth time. So there would be one touch of the bottom trendline followed by a breakout above the top.
Mark F – You get bonus points for your deluxe chart. I’m trading DUST and it will help me, thanks.
You’re most welcome. Here’s a link to my real-time 15-minute chart that I’m using to track the flag building. http://scharts.co/19Z81im
Terrific thanks Mark.
Is it ok for me to change anything on the chart? Or will that mess up your setup?
If gold retrace/bounce may go up to $1,209 today as me and Tham calculated than DUST may make a new low today then. That is where I am looking to buy DUST.
I doubt if 1209 can be reached by today. The 2nd wave of minute b minuette c is still ongoing. I’ll probably make a decision closer to 4 pm.
You can change whatever you like. It will not affect my chart. Unless you have a subscription at stockcharts.com, I don’t believe your changes will be saved anywhere but you could mark it up and print it I suppose.
By the way, the flag looks ready to break out within the next hour based on the windup of the STO.
I just added to DUST @ 17.11
I no longer think that was a bullish flag. It broke down and seems to be defining the channel resistance. Here is an updated chart. One more windup may be needed before it can break out.
How high will this correction do right now at 1200.64 at 10:19 am?
Gold at 9:50 at 1,192.66 do we still have to go higher for possible bounce up possibly as high as 1,210 before we continue down or has that bounce up completed already so we just mainly go down?
1206 should have been close enough, ALT looking good
Hi Lara.
Minute a of minor 2 seems to exhibiting a series of nested 1-2s. From EW point of view, if this is the case, does it portend a very strong 3rd wave down? If so, the alternate seems to have more room for this, unless minute a in the main count becomes a regular flat.
Comments please.
Tham Lara’s chart does show a 2nd wave bounce of minor wave 2 perhaps up to the 1,210 area?
This hourly alternate also expects downwards
movement from here. Minor wave 3 should show a clear strong increase in downwards momentum. This is a third wave within a third wave, which should gather momentum over the next few days.
Main wave – Minor wave 2 may not move below 1,142.82. If this invalidation point is breached in the next few trading days or one or two weeks, by any amount at any time frame, the daily wave count would substantially reduce in probability.
Thanks for the response. Managed to make some sense. See reply above.
OK. With more structure, I begin to see the wave count unravelling. We are now in minor 2 minute a minuette 3.
Gold just completeting minuette 3 and up to minuette 4 to 1210 ?? then minuette 5 down to unfold??
Is this correct?
If gold gets back up to 1210, that would likely be a B wave
Hi papudi. I think minuette 3 may not be over at the current low of 1195.86. Still monitoring it for a minuette 4 up.
So far, minor 2 appears to be a 3-wave zigzag subdivided 5-3-5. In this scenario, minute a could end slightly above 1185. I am looking to sell my DUST from yesterday and take a small trade for minute b upleg before resuming DUST/JDST for wave c down.
If the alternate wave count is correct, then its minute 1 down would subdivide into 5 waves, and the downward movement will become more pronounced. But, let’s take it on step at a time.
What is the target for min b upleg? Can i take fib retracement for the target?
It is too early to give an exact figure. I will use the common 0.618 retrace of minute a, until proven otherwise.
Minuette 3 could have possibly ended at 1195.86 after all. The small hammer is an indication. Still monitoring.
Yes, I see all that overlapping. It makes it really hard to see an impulse complete in there…. and I’m looking at it at 3:16pm EST.
I wouldn’t get too hung up on getting each subdivision within this downwards movement right at this exact time, because it’s pretty likely whatever labelling you put on it now will change on Monday and Tuesday. I’d just be reasonably confident that we’re in a minor degree correction which has further down to go.
I think once price manages to break below the trend channel properly we may see momentum increase and this overlapping may resolved itself as a series of 1-2 waves.
I still can’t see a third wave complete in that mess.
I bought and sold DUST twice mid day for profits and also bought it back later and kept overnight. Gold up 8 days in a row, Gold RSI very high and Lara’s EW forecast is down and US dollar went up 1% since 4 am gold high, US data weak, and by 10:13 pm Gold had dropped from 1,219.80 all the way down to 1,200.03, gold weak and trending down: six good reasons to sleep soundly holding my DUST.
Wonderful. That’s what a nimble trader should be.
I have my JDST position and won’t be adding. With Gold overbought, stock market making a turn today, dollar bouncing, and oil bouncing, I am expecting GDP to cause dollar, oil, and stock market to go up, and gold/miners to drop tomorrow.
Gold options are done, sweet spot was 1200. Looking at the charts, I am 51% alternate, 48% main, and 1% undecided.
Very difficult to determine which way gold price is headed. JUST MY SENTIMENTS: Gold price is overbought and bullish looking to top for a rise through 1210-17 to possibly target 1225-33 price region; hard to say if gold price will get that far up with the upper band having dropped to 1219. There is nothing in it for the shorts below 1200/1199 yet subject to a break below 1202…. A pullback / snap drop is expecting though in which case 1198/94 and possibly lower 1189/88-85 would be levels I would look for to stay long unless a break below 1171 occurs….