Downwards movement was again expected.
Summary: Downwards movement should continue for Tuesday to complete another red candlestick. A short term target is at 1,177. Wednesday may see some upwards movement for a B wave within this correction which may produce a small green candlestick or a doji on the daily chart. The trend remains down at minor degree, and the target for this correction to end is the same at 1,172.
Click on charts to enlarge.
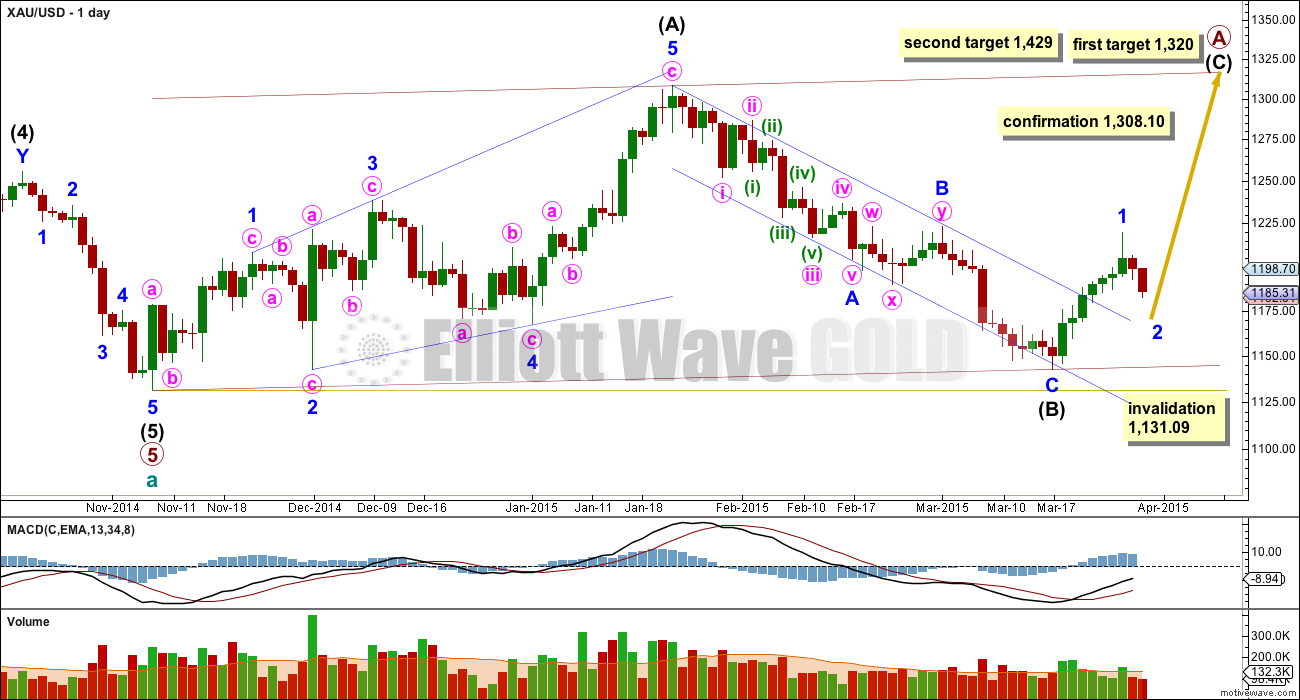
Main Daily Wave Count
There are more than thirteen possible corrective structures that cycle wave b may take. At this stage it is unclear what degree to label this big movement. After further consideration I will move the degree of labelling back down one degree, and this is more likely an incomplete zigzag for primary wave A.
Cycle wave b may be a flat correction where primary wave A is a zigzag. Cycle wave b may be a triangle where primary wave A is a zigzag. Cycle wave b may be a combination where primary wave W is a zigzag. Cycle wave b may be a double zigzag with the first in the double, primary wave W, incomplete.
When the big zigzag now labelled primary wave A is complete it is also possible that cycle wave b could be over there with the degree of labelling within it moved back up one degree.
A new high above 1,308.10 would invalidate the alternate and confirm this main wave count at primary and cycle degree.
The upwards wave labelled intermediate wave (A) fits only as a five wave structure, a leading expanding diagonal. Within a leading diagonal the first, third and fifth waves are most commonly zigzags, and the fourth wave should overlap first wave price territory.
Because intermediate wave (A) subdivides as a five, intermediate wave (B) may not move beyond its start below 1,131.09.
At 1,320 intermediate wave (C) would reach equality in length with intermediate wave (A). This would complete a 5-3-5 zigzag trending upwards. At that stage alternate wave counts would be required to manage the various possibilities for cycle wave b.
At 1,429 intermediate wave (C) would reach 1.618 the length of intermediate wave (A).
Because intermediate wave (C) is a diagonal then it is highly likely intermediate wave (C) will be an impulse in order to exhibit alternation. Intermediate wave (C) may end about the upper edge of the channel drawn about primary wave A.
This wave count sill has problems of structure within primary wave 5 of cycle wave a:
– within primary wave 5 intermediate wave (2) is a running flat with its C wave looking like a three and not a five.
– within intermediate wave (5) the count is seven which is corrective; either minor wave 3 or 5 will look like a three wave structure on the daily chart where they should be fives.
It is for these reasons that I will retain the alternate until price confirms finally which wave count is correct and which is invalidated.
The decline in volume for the last two days fits this main wave count. If price has entered a correction and not a new trend at a larger degree then it should be expected that during the correction volume declines. Minor wave 2 so far has lasted two days. It may complete in one more to total a Fibonacci three, or it may last three or six more days to total a Fibonacci five or eight. I have three hourly wave counts for you.
Main Wave Count – First Hourly
This first hourly wave count expects minor wave 2 to be the most likely structure of a zigzag. Within a zigzag minute wave a must subdivide as a five wave structure, and may be still incomplete.
Within minuette wave (iii) subminuette wave iv looks like an almost complete running contracting triangle. It may not move into subminuette wave i price territory above 1,195.84.
At 1,177 minuette wave (iii) would reach 1.618 the length of minuette wave (i).
When minuette wave (iii) is complete the invalidation point must move up to the end of minuette wave (i) at 1,202.03. Minuette wave (iv) may not move into minuette wave (i) price territory.
When minute wave a is a complete five wave impulse then minute wave b should unfold upwards and it may show up on the daily chart as a small green candlestick or doji, which would give minor wave 2 a three wave look on the daily chart. This first wave count expects minor wave 2 to be longer lasting, maybe a total Fibonacci five or eight days.
When minute wave a is complete the following correction for minute wave b may not move beyond the start of minute wave a above 1,219.99.
When the final fifth wave down out of the triangle is complete then if the following movement is another small sideways correction for minuette wave (iv) then this first hourly wave count would be correct.
Main Wave Count – Second Hourly
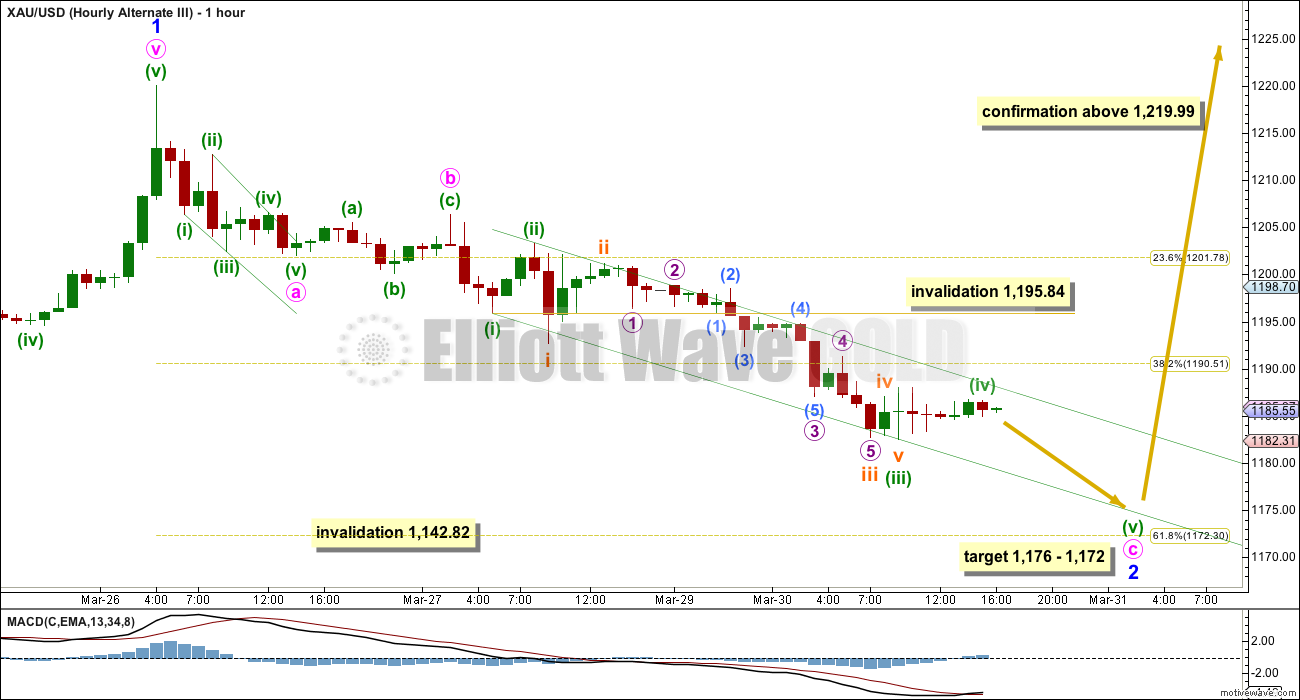
It is possible that minor wave 2 is close to completion as a single zigzag.
Sometimes zigzags are relatively brief structures. This second wave count expects minor wave 2 to be over in maybe one more day to total a Fibonacci three days. This is less likely than it lasting five or eight days.
Within minute wave c minuette wave (iv) may not move into minuette wave (i) price territory. Minuette wave (iv) may be an almost complete triangle.
At 1,176 minuette wave (v) would reach equality in length with minuette wave (i). At 1,172 minor wave 2 would end at the 0.618 Fibonacci ratio of minor wave 1. This $4 target zone may be met within 24 hours.
What happens after the next wave down out of the triangle will tell us which of these first two hourly wave counts is correct. If price begins to move strongly upwards and subdivides as an impulse this second wave count may be correct. A new high above 1,219.99 would provide confirmation, but confirmation is also required by structure.
If minor wave 2 ends shortly then the next upwards movement would be the start of minor wave 3, which should show an increase in upwards momentum, should begin with a five wave structure upwards on the hourly chart, and is likely to show an increase in volume on the daily chart.
Main Wave Count – Third Hourly
At this stage I judge this third hourly wave count to have the lowest probability of all three. I publish it only to consider all possibilities.
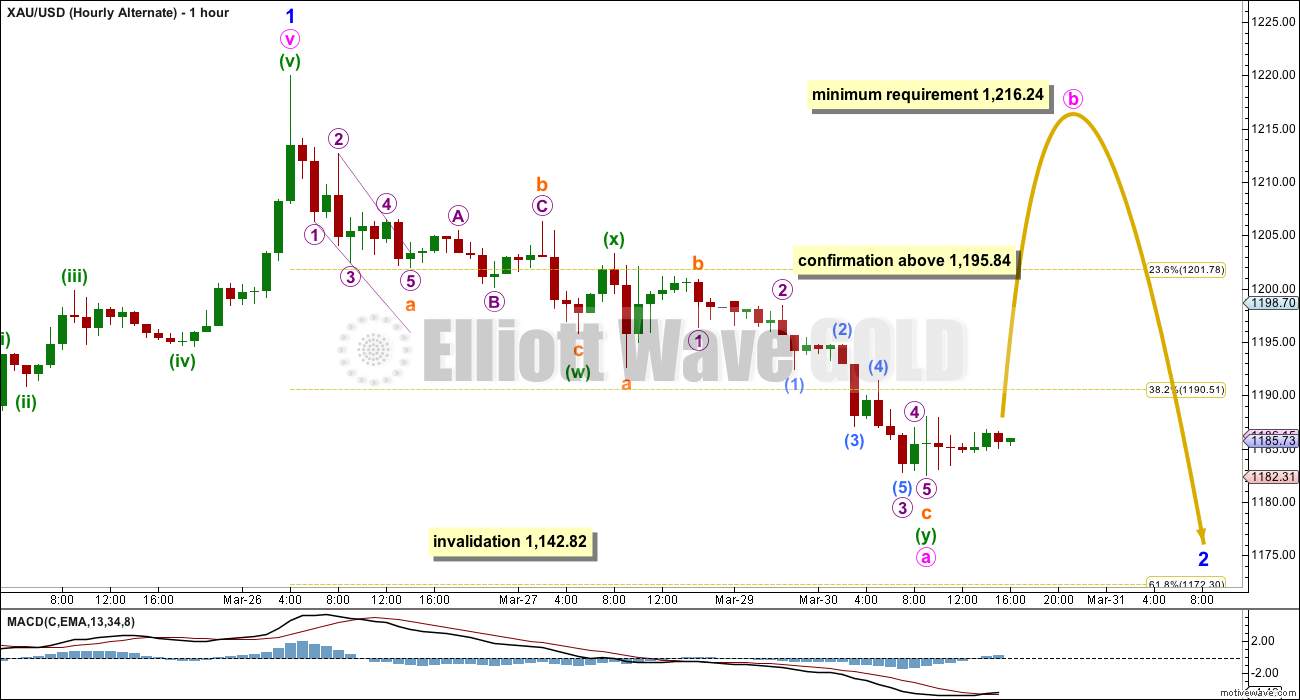
Minor wave 2 does not have to subdivide as a zigzag. It may be a flat correction. Within the flat correction minute wave a may be a complete three, a double zigzag.
Because minute wave a as a three only subdivides as a double zigzag (it cannot be seen complete as a single zigzag) the possibility of a combination at this stage is discarded. Within combinations each sub wave of W, Y and Z may only subdivide as a simple A-B-C corrective structure (or a triangle). W, Y and Z may not themselves subdivide as W, Y and Z multiples because the maximum number of corrective structures within a multiple is three.
If minor wave 2 is unfolding as a flat correction then within minute wave b must reach up to a minimum 90% length of minute wave a at 1,216.24. Minute wave b may make a new high above the start of minute wave a at 1,219.99. There is no upper invalidation point for this wave count.
For this wave count minute wave b should begin now. A new high above 1,195.84 would at this stage invalidate the first two hourly wave counts, and only if that happens would I seriously consider this third idea.
Minute wave b must subdivide as a corrective structure, most likely a zigzag. It is most likely to exhibit low volume on the daily chart and it should not show a strong increase in upwards momentum.
Alternate Daily Wave Count
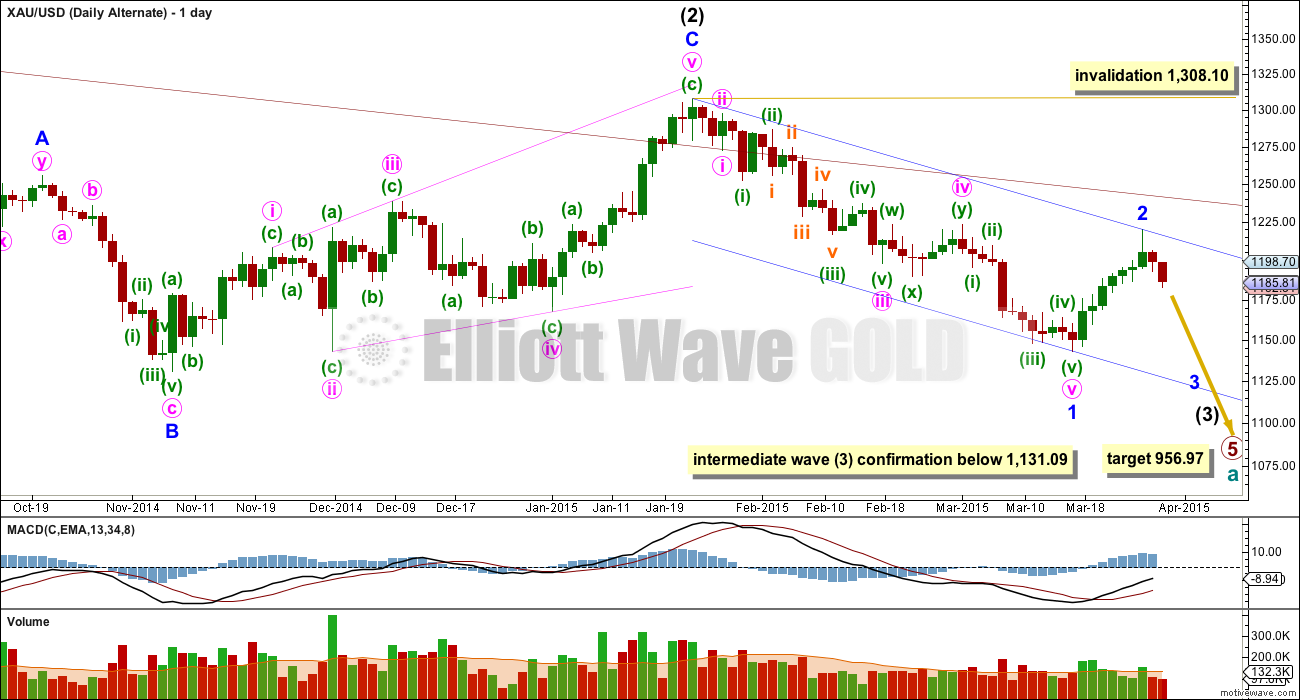
This alternate wave count sees Gold as still within a primary degree downwards trend, and within primary wave 5 intermediate wave (3) has begun.
At 956.97 primary wave 5 would reach equality in length with primary wave 1. Primary wave 5 may last a total Fibonacci 55 weeks. So far it is now in its 36th week.
The maroon channel about cycle wave a from the weekly chart is now breached by a few daily candlesticks and one weekly candlestick. If cycle wave a is incomplete this channel should not be breached. The breach of this channel is a warning this wave count may be wrong.
This wave count still has a better fit in terms of better Fibonacci ratios, better subdivisions and more common structures within primary wave 5, in comparison to the main wave count above.
Within intermediate wave (3) minor wave 1 is a long extension. Within minor wave 1 minute waves iv and ii are grossly disproportionate, with minute wave iv more than 13 times the duration of minute wave i. This also reduces the probability of this wave count.
Although the invalidation point is at 1,308.10, this alternate wave count should be discarded long before that price point is reached. If the maroon channel is breached again by one full daily candlestick above it and not touching it then I would discard this alternate wave count.
A new low below 1,131.09 would confirm that intermediate wave (3) down is underway.
The decline in volume for the last two days now is concerning for this wave count. If minor wave 3 of intermediate wave (3) has just begun volume should increase. Minor wave 2 already has lasted 7 days and is longer than minor degree corrections normally are. Although it is possible that only minute wave a is over and this downwards movement is minute wave b, that would see minor wave 2 far too long in duration. The probability of that idea is very low indeed. So low I hesitate to publish it.
This analysis is published about 05:21 p.m. EST.


Analysis is published about 05:52 p.m. EST.
Took a small long miner position today to start.
Either above 1202 or below 1178….best to get out over night and get back in the next day until a we see a clear direction…
Gold is totally ignoring the fact that world events only need one little spark to blow up…gold could be 1400+ in a blink…
Doubt that unless it’s extreme and a surprise. Geopolitical events always reverse. Gold’s spike to 1220 on the Yemen attack quickly reversed. A more likely surprise might be a major default which would torpedo gold.
NFP is on the Good Friday holiday. The ADP and ISM tomorrow might give early hints about NFP.
http://www.dailyfx.com/calendar
Sinking a tanker in the gulf of hormuz…
Right. But if I wasn’t already long for that event, I’d figure I missed most of it, and wait to fade it. Like the 911 dollar spike after 911.
Just something to keep in mind…It all depends on your risk appetite…
We’re already getting close to the bottom…
Yes, absolutely. Same for financial risk.
A lot of money is hedging or scared. Look at the massive OI surge on VXX. While liquidity on S&P is at historic lows.
I wonder why they aren’t they using gold as a safe haven anymore?
I think Gold still shows safe haven features, like for last weeks breakout of war in Yemen, but thing is that large institutions don’t go into gold because the gold market is too small to accommodate large capital flows… Before you buy, you gotta worry about selling and the gold market isn’t liquid enough for big institutional orders. GLD is half the size it used to be, and the others were always much too small. The FX and US treasury market are the only markets with deep enough liquidity to accommodate large institutional order flow when capital panics.
I don’t know how true it is, or if it’s even possible, but I’ve heard a theory that they’re aiming to make gold irrelevant, all monetary events will only be electronic…
That will get the US out of the jam that China has been accumulating/hoarding gold and the rumours that Fort Knox is empty…hehe
Yep I too think they’re trying to do that. Look at the special surtaxes & tracking & restrictions on gold movement.
All my peers now think money is indeed just electronic. Wave you mobile at the starbucks counter. What’s gold? You a relic? LOL
I know lots of people buying physical gold plus premium, faithfully every month all the way down from 1900 in total confidence that it’ll be 3000+ in a few years…
Yep, been there done that. On the way up and down. Luckily got out at 1705. Learned from some great traders. Now I’m a good trader too in a variety of instruments.
http://www.dailyfx.com/forex_forum/
This is hard and dangerous work. You got a system that works for you, that’s awesome!
I second guess myself all the time… Gold is tough…
I look for the trend with Lara’s help…
Of course. I think good risk managment is key. Even more so than getting trades right, which is impossible to do consistently. Risk mgmt is key to being profitable overall.
I learned the hard way…
Me too. Everyone does. Or else they quit.
It’s additive ….
it’s a great feeling when you beat the system…
Thanks for the link J…I like hearing more/different viewpionts, the more the better..
So I think gold falls during a financial crisis mainly because trapped longs with leverage are forced to sell everything to cover.
I’m just saying if the money is scared why not buy gold… And you said Gld isn’t big enough…
I just closed my DUST longs at $19.31. I noted some aggressive buying in GG and a bearish rising wedge on the DUST 10-min charts.
Mark, appreciate your thoughts on DUST.
Lara did minuette wave (iii) already complete at 1,178.54 at 5:33 am and the main hourly chart has speeded up because it looks like gold may be in minute wave b already or now in minuette wave (iv)? Do we still have both lower targets of 1,177 then 1,172?
So far yes, it looks like minuette wave (iii) ended at 1,178.54.
If that wave count is correct though this upwards movement would be minuette wave (iv); it needs another fifth wave down before minute wave a is a five wave impulse. So this upwards movement would not be minute wave b.
But I’m only now beginning to look at the second hourly chart. Will post a quick comment when I’ve done that.
Okay, looks like only the first two hourly charts will be used today. I’m discarding the third, it looks all wrong.
The price point we need to see passed is first 1,202.03. If that happens and price remains above 1,178.59 then it would be most likely minor 2 is over in three days and minor 3 has begun.
Equally as likely though is minor 2 is only about halfway done. If we see a new low below 1,178.59 first then I would expect more choppy overlapping movement (it needs a b wave up within it) for another two or more likely five days to complete minor wave 2 which may end a bit below the 0.618 Fibonacci ratio.
Off to finish charts and write up now.
Thank you Lara.
Remember everyone, today is month-end and quarter-end. Today’s close is key for long term analysis on monthly and quarterly charts.
Euro is in danger here of posting a double bearish reversal on this monthly close. Wow.
And… I do have a third wave count. Darn corrections, they’re so hard.
In order to have confirmation that 2 is over and 3 up is underway we will need a new high above 1,218.99.
Today will complete a red candlestick for the Monthly chart. It will also complete a small red candlestick for the weekly chart. I cannot see price moving strongly in the last few minutes to change that. Both fit with the wave count at monthly and weekly chart levels.
It is nice three possible wave counts were presented. We can follow and ditermine which wave count is active. Good stuff!!!!
Which one do you think is correct?
The first hour one.
50/50… GL
Lara, is it likely that the main hourly alternate II is the correct wave count? Any comments as to where we are in the wave count? I’m looking at the strength & size of candles on recent up / down from 1178 area. Your comments much appreciated
At this stage the first and second hourly charts are about equally likely. The price point which differentiates them is now 1,202.03. If we see a new high above that point before a new low, then the second hourly chart is correct and the first is invalidated.
The third hourly chart should now be discarded. It looks all wrong.
No, I am not publishing an hourly chart for that daily alternate because at this stage it looks so unlikely. Giving it an hourly chart would give it too much weight.
Volume for the last three days is low indicating a correction. If a third wave at two degrees has begun downwards this should not be happening. I’ll only publish an hourly chart for that alternate daily wave count if it proves itself with a strong push down, increased momentum, and increased volume.
Thanks for you timely analysis!!!! Much appreciated!
I have a variation of the third hourly chart; we need a new high above 1,219.99 to confirm 2 over and 3 underway.
The bullish flag has now broken out on my DUST chart. I am still targeting the $20.10 area. http://scharts.co/1BIcyeR
Also, if you take a look at the GG chart, you will see it’s getting into trouble here with broken support now turning into resistance and a potential fractal coming into play portending a large move down. GG is 10% of the GDX. http://scharts.co/1BIgLPH
as soon as I spoke earlier that became the top of the b wave… 1172 next…
agreed!
possibly the beginning of 3rd wave up from 1177..
Sold my remaining JDST in pre market. I will be looking for the drop back into 1172 area to begin building long position. Main hourly is looking pretty good.
I am just thinking: Basing off 1181 gold price appears to be targeting 1185 through to 1189/90 resistive; a break above here could likely seek 1206-07 with 1212-13 on the outside….
main hourly looking spot on
In next two days after $1172 target is met in PM wave count gold is expected to diverge from alternate wave. If Gold moves higher from this target.
A critical moment is upon the gold. If maroon channel is broken at around $1239 with one full day price trading above it will confirm gold has bottom and is in multi year bull trend.
OR gold will continue to move side ways between maroon channel and $1130 for some time.
Time is up!!!!!