
Downwards movement and an increase in momentum were expected.
Summary: The short term target for subminuette wave iii is 1,153. I expect another red candlestick for Monday. At this stage the trend is down.
Click on charts to enlarge.
Main Daily Wave Count
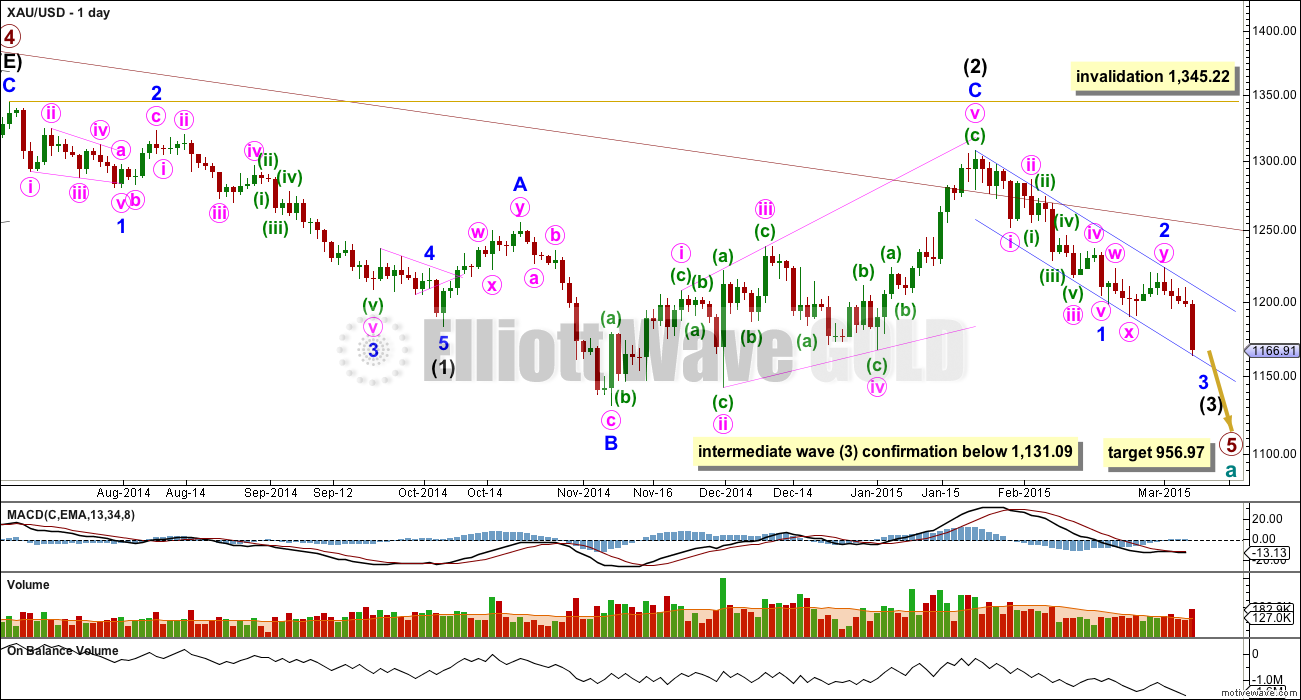
This main wave count sees Gold as still within a primary degree downwards trend, and within primary wave 5 intermediate wave (3) has begun. At 956.97 primary wave 5 would reach equality in length with primary wave 1. For Silver and GDX this idea, that the primary trend is down, is the only remaining wave count. This main wave count has a higher probability than the alternate below.
The maroon channel about cycle wave a from the weekly chart is now breached by a few daily candlesticks and one weekly candlestick. If cycle wave a is incomplete this channel should not be breached. The breach of this channel is a warning this wave count may be wrong, and so I will still retain the alternate.
Draw the maroon trend line on a weekly chart on a semi-log scale, and copy it over to a daily chart also on a semi-log scale (see this analysis for a weekly chart).
Within primary wave 5 intermediate wave (1) fits perfectly as an impulse. There is perfect alternation within intermediate wave (1): minor wave 2 is a deep zigzag lasting a Fibonacci five days and minor wave 4 is a shallow triangle lasting a Fibonacci eight days, 1.618 the duration of minor wave 2. Minor wave 3 is 9.65 longer than 1.618 the length of minor wave 1, and minor wave 5 is just 0.51 short of 0.618 the length of minor wave 1.
Intermediate wave (2) is an expanded flat correction. Minor wave C is a complete expanding ending diagonal. Within an ending diagonal all the sub waves must subdivide as zigzags. The fourth wave should overlap first wave price territory. Expanded flats are very common structures and ending diagonals are more common than leading diagonals.
This wave count has more common structures than the alternate wave count, and it has a better fit.
A new low below 1,131.09 would confirm that intermediate wave (3) down is underway.
Intermediate wave (2) may not move beyond the start of intermediate wave (1) above 1,345.22. If this invalidation point is passed this wave count would be fully invalidated.
Within intermediate wave (3) minor wave 1 is a completed impulse lasting 18 days. Minor wave 2 is a completed double flat correction which lasted 9 days, exactly half the duration of minor wave 1. Because this is a second wave correction within a third wave one degree higher I would expect it to be more shallow than normal.
So far within intermediate wave (3) minor wave 1 lasted 18 days and minor wave 2 lasted 9 days. Minor wave 3 may total either a Fibonacci 21 or 34 days, depending on how long the corrections within it take. So far it has lasted only 4 days.
Draw a base channel about minor waves 1 and 2. Minor wave 3 should have the power to break through support at the lower edge. Along the way down upwards corrections should find resistance at the upper edge. Copy this channel over to hourly charts. If this channel is breached on Monday (which I expect is very likely) this main wave count will further increase in probability over the alternate.
Since the top labelled intermediate wave (2) volume is still strongest on down days. Volume for 2nd March, a down day, was the highest since 5th February, also a down day.
At the end of this trading week On Balance Volume agrees with the downward trend for price. The increased volume bar for Friday also agrees the trend is down.
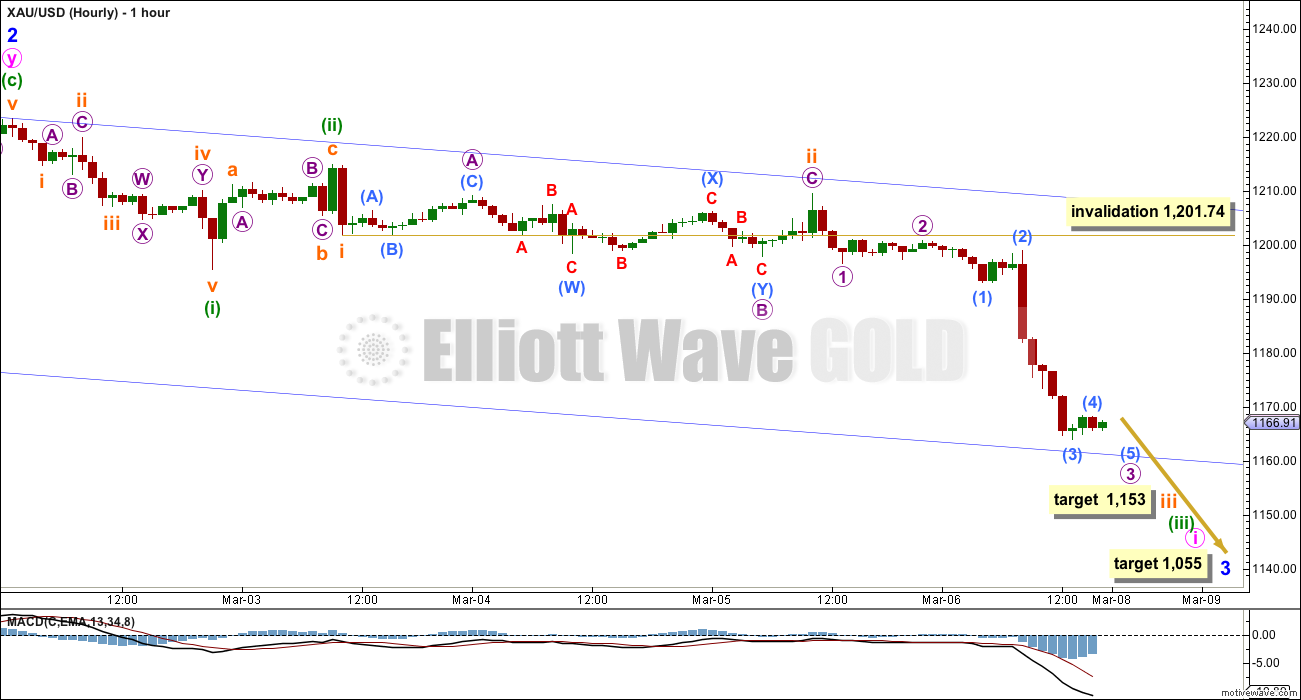
The green channel was breached and a new low below 1,189.64 provided confirmation and confidence that minor wave 3 down had begun.
At 1,055 minor wave 3 would reach 1.618 the length of minor wave 1. This target may be either 17 or 30 days away (give or take two either side of each number).
Within minor wave 3 I do not think that minute wave i is yet over. I will not be able to calculate a target for minute wave i until minuette waves (i) through to (iv) are complete, because the target may only be calculated at the earliest opportunity at minuette degree.
So far within minute wave i Friday’s session probably passed through the middle of it. I have checked the subdivisions within the last strongest wave down labelled sub micro wave (3) and I expect it only just completed at the end of Friday’s session. On the five minute chart I cannot see subminuette wave iii as complete.
At 1,153 subminuette wave iii would reach 4.236 the length of subminuette wave i.
Subminuette wave ii does not show up on the daily chart and so I expect neither will subminuette wave iv. Subminuette wave ii was a relatively deep 0.59 expanded flat correction. I expect subminuette wave iv will be a zigzag or zigzag multiple so it may be more brief than subminuette wave ii, and it is also likely to be shallow at either 0.236 or 0.382 the length of subminuette wave iii.
If the lower edge of the blue channel is breached on Monday then it should thereafter provide resistance to upwards movement. The channel may not be breached on Monday though, and downwards movement may move along the blue line with fourth wave corrections moving sideways along the way down.
I expect another red candlestick most likely for Monday with a decrease in downward momentum.
Subminuette wave iv may not move into subminuette wave i price territory above 1,201.74.
Alternate Daily Wave Count
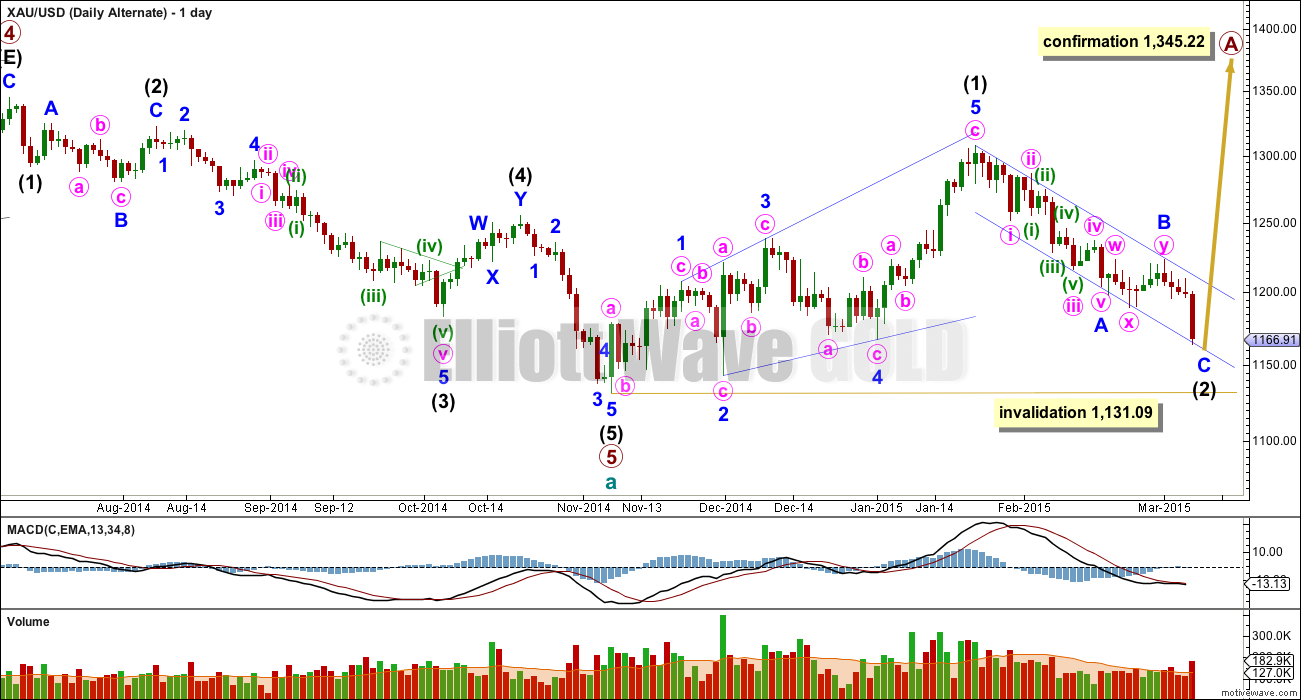
At this stage I judge this alternate wave count to have a lower probability. The structure of downwards movement, and momentum, will determine which wave count is correct over the next few weeks. At this stage they both expect more downwards movement so there is no divergence in the expected direction.
This wave count sees a five wave impulse down for cycle wave a complete, and primary wave 5 within it a completed five wave impulse. The new upwards trend at cycle degree should last one to several years and must begin on the daily chart with a clear five up.
The first five up may be a complete leading expanding diagonal. Within leading diagonals the second and fourth waves must subdivide as zigzags. The first, third and fifth waves are most commonly zigzags but they may also be impulses. This wave count sees minor waves 1, 3 and 5 as zigzags.
Leading diagonals are almost always followed by deep second wave corrections, sometimes deeper than the 0.618 Fibonacci ratio. It is possible now to see intermediate wave (2) as a deep 0.67 single zigzag. If it is over it may have lasted just a little under half the duration of intermediate wave (1).
My biggest problem with this wave count is the structure of intermediate wave (2) within primary wave 5. This is a rare running flat but the subdivisions don’t fit well. Minor wave C should be a five wave structure, but it looks like a clear three on the daily chart. If you’re going to label a running flat then it’s vital the subdivisions fit perfectly and this one does not. This problem is very significant.
Within intermediate wave (5) minor wave 3 looks like a three on the daily chart, where it should be a five. This movement may also be labelled with minor wave 3 ending higher and minor wave 5 looking like a three. Either way, one of the actionary waves within this downwards movement will look like a three and not a five which does not have the “right look” at the daily chart level.
Intermediate wave (2) may be an incomplete zigzag, which subdivides 5-3-5. The subdivisions within intermediate wave (2) for this alternate are exactly the same as for this movement on the main wave count which sees a first, second and now third wave unfolding subdividing 5-3-5.
For this alternate wave count minor wave C down must subdivide as a five wave structure. The hourly chart would see the subdivisions exactly the same as the main wave count above, so to keep the number of charts at a minimum I will publish only one. For this alternate at 1,159 minor wave C would reach 0.618 the length of minor wave A.
For this alternate the channel is drawn in the same way, but here it is correctly termed a corrective channel. Minor wave C should find support and end at the lower edge of this channel. At this stage the structure within minor wave C is an incomplete five, and this wave count also would require some more downwards movement to complete it. This indicates either a very slow end to minor wave C with price hugging the lower blue trend line, or an overshoot of the trend line for minor wave C which is less likely.
Intermediate wave (2) of this new cycle degree trend may not move beyond the start of intermediate wave (1) below 1,131.09.
This analysis is published about 10:23 p.m. EST.
Lara,
I was wondering if the possible bounce for the alternate hour wave count target is still at $1,159 wave C (2) ?
Dear Lara,
For a slight variation of your alternate daily, could we validly re-label it on a log-scale chart as an unfolding 3-3-5 flat (or an expanded flat) at primary degree (or else cycle degree)? See the web chart posted below.
This would retain a bullish case (targeting wave (c) above 1307) and first allow price to drop below 1131 in wave (b) without invalidating like intermediate 2 does. Perhaps you already considered and rejected a count like this?
Thanks.
That does not make sense.
Primary wave 5 may only subdivide as a five wave structure which is either an impulse or an ending diagonal. It may not be a flat correction.
It’s an actionary wave not a corrective wave.
HUI projection after Friday;s drop. ” If this impulse move is anything like the last one, that started at
1800, we still have a good eight months to go yet. This impulse move
will not be straight down by any stretch of the imagination as that
would be too easy. Just look at the first one that started at 1800 and
see how volatile it was at times.”
Lara advised 4 to 16 weeks until $957.
In comment below.
“So far primary wave 5 is in it’s 7th week, so maybe it will last either 13 or 21 weeks.”
4 to 14 weeks
6 to 14 weeks
I don’t see any edit under the post?
Richard
primary wave 4 ended as of Jul 2014 at 1345. Primary wave 5 began at that time. So total duration as of this week is??? pls calculate thanks not 7 th week.
I just posted what Lara said. Sometimes she may change her projections. She will respond. I won’t.
Richard, papudi.
It is commendable that you think longer term, wanting to get the big picture. It is desirable to have a longer term goal that one can focus on, and then interpolate down to the nitty gritty of intra-day trading.
Without a clear focus, it is like embarking on a journey not knowing the final destination, but living from day to day.
I, too, am focussed on longer term goals. I base mine on historical data, and I think we will be moving on to a bearish pennant or flag before another big drop which is a repeat of the one last week. This is the basis of the bear flag/pennant. The model is a repeat of 2013.
I would advise some caution. You should note that analysts out there have to develop something to justify to their clients. Whatever they come up with is just a model, with underlying assumptions which may or may not be sound. Each has to have something different otherwise they will lose their subscriber base in no time. Novelty sells. I find it interesting to see some of them try to dig their way out of situations that run contrary to their models, sometimes. Ignoring those with outlandish calls such as 10000 gold or 150 silver, they usually have a bias towards bullish or bearish scenarios, the so-called permabulls or permabears. I have even seen some that win subscribers by choosing to be controversial. The bottom line is that we need to use our rational thinking and consider these only as background reference. It is for this reason that I respect Lara. She is honest, and cautious, with her posts.
Many traders base their judgment for the immediate future on fundamentals, such as support and resistance levels, and hence the social mood. Going forward, I use these for my trading, just to share. They are all previous lows (support turned resistance).
Strong resistance levels: 1179.40, 1181.40, 1183.30 followed by 1240.20.
Supports levels: 1167.30, 1162.90, 1141.70, 1130.40.
Trade safe.
Thanks TKL. Lara has showed us the pathhway to final target using EW analysis. As trained engr I am just trying to tie down the timing now. She is correct I am getting ahead of myself. Need to wait till more waves are complete and then accurately one can judge timing.
Whta r u trading, DUS/JDST/Gold?
Hi Papudi. I trade mainly DUST, JDST, GDX for the miners. I will do NUGT when the short term trend is up, not now. Like you, I am also a trained engineer. And this training teaches me not to rely on only one course of action (example: built-in redundancy). Hence, I also trade SSO, XIV, TVIX for S&P, and UWTI and DWTI for crude.
May I ask which broker(s) you use in Sgp? They seem expensive to me. May you please recommend any? I’m new to Sgp, no tax yay!
I use E*Trade online platform. They charge USD 9.99 per trade.
But it does help to have a ballpark figure. I do.
Gold, Silver, GDX, GDXJ Super Force Precious Metals Video Analysis posted Mar 6, 2015
Weekly update from Morris: “Junior Gold Stocks: Big Volume Is Needed”
http://bit.ly/1MjqlhL
Rick Rule: Gold price ‘could easily see $1,000′
Frik Els | March 6, 2015
“Gold could easily see a thousand. I’m not a technical analyst but the gold chart looks lousy to me and the confidence [in the US dollar and government bonds] looks very very high,” said Rule. Rick rule agrees that gold bugs’ hype about financial Armageddon is counterproductive.
http://www.mining.com/rick-rule-gold-price-easily-see-1000-68398/
Lara, does the huge weekly bullish divergence concern you that the alt count may be playing out?
Thanks for reminding us about this, I’d almost forgotten about it. To me, it’s possible it has already been resolved by the recent move over 1,300. We have to see how this move down plays out and what the indicators show along the way. For example, price can keep going down and RSI can make a lower low, and then that would be that. But if price gets close to that last interim low and the indicators do not confirm, and price shoots up from there without making a lower low, it could be a longer term bullish development. We should see more on this fairly soon. Good to keep an eye on it
Not too much, no. I would expect to see divergence between primary waves 5 and 3. And I would expect to see MACD hover about the zero line while a triangle unfolded, which is exactly what it did during primary wave 4.
I have learned the hard way over the years to not use divergence as a signal, but as confirming / non confirming indicator. I’ve learned the difference, I hope!
I’ve seen divergence develop and then persist for quite some time before a trend change.
So far, at the weekly chart level the wave count has a reasonably typical look. If primary wave 5 unfolds to 956 as per the main wave count, and momentum increases somewhat but remains lower than primary wave 3, it will look absolutely typical.
I am more concerned with that trend line breach than divergence.
Gold closed 2 standard deviations below it’s daily lower BB. Once it closes above it, it will trigger a new buy signal. In the past year there have been 3 other signals and it has always generated a multi week rally of some significance. The last one occurred at the $1131 low. This does seem to favor the alternate count, but maybe this time will be different.
I thought of that too. Actually both silver and gold traded below their 2 SD lower BB friday but closed slightly above.
Lara, looking out a bit, I’m trying to estimate the timing bands of some of the upcoming wave completions. With minor 3 coming to an end in 17 to 30 days, the assuming an 8 or 9 day bounce for minor 4, then possibly another few weeks to finish minor 5 of intermediate 3…from there we still have intermediate 4 (2 was 3.5 months) and intermediate 5 to go to get to 956 target. Do you feel like momentum will keep building and collapse these time frames? And if so, what timing band would you feel comfortable estimating for the 956 target?
Good question above.
On same line of thought, what is total duration of primary wave 5?
If length of primary wave 5 is equal to primary wave 1 shouldn’t duration be same or it does not have to be?
“At 956.97 primary wave 5 would reach equality in length with primary wave 1.”
Another 20 weeks to total a Fibonacci 55.
I’ll add this to the daily analysis.
Gold COT Still on high side.
Current commercial shorts at 354,315.
http://www.321gold.com/cot_gold.html
For those still shorts, gold action on Sunday – Monday to watch 1201:
” I expect another red candlestick most likely for Monday with a decrease in downward momentum. Subminuette wave iv may not move into subminuette wave i price territory above 1,201.74.”
Approximate Fib retracement after 1153 is reached: ” it is also likely to be shallow at either 0.236 or 0.382 the length of subminuette wave iii.”
1209 to 1153 = 53, x .382 = 20.24
1153+ 20.24= 1175.24
If my understanding of Lara’s writing is wrong pls correct me. (EW dummy)
Hi papudi. I would suggest just go with Lara’s wave counts and let them work for you! The text and video are quite clear. Subminuette iii is not yet seen as complete before see subminuette iv which is then expected to be brief and shallow and may not move in to subminuette i price territory above 1201.74…. It would therefore be best to first let subminuette iii complete (indicated to be a red candle on Monday with a decrease in downward momentum possibly complete down at 1153) before trying to work out how far up subminuette iv may go…. Perhaps working out retracement levels of the week H 1223 / L 1163 may help…. In my estimation the upside risk is 1183 with 1193 on the outside with gold price finding resistance at 1170/71, 1175/76 and I would not expect gold price to get to or past pivot 1176/77. The very low 14-day stochastic reading, daily RSI tagging below 30 and gold price below the lower band is a cause of concern to me indicating to be cautious in selling in an oversold market and/or to expect a price rise. Currently increased volumes and ADX indicate a strengthening in the downtrend. Good luck!
There’s too much estimation in what you’re trying to do, so way too much room for error. The better way to estimate when primary wave 5 may end at the target 956 would be to look at durations of primary waves 1 and 3.
Primary wave 1 lasted only a Fibonacci 3 weeks. Primary wave 3 lasted 37 weeks (3 more than a Fibonacci 34).
So far primary wave 5 is in it’s 7th week, so maybe it will last either 13 or 21 weeks.
Only once intermediate waves (1) through to (4) are complete would I try to anticipate when intermediate wave (5) would end using ratios and durations at intermediate degree.
Hello Lara,
You probably copied part of this message from one of your past analysis because if the main count is correct then primary wave 5 is in 35th week already.
Danil
Using rule of alteration than wave 5 will be the longest wave since it already close to primary wave 3 duration of 37 weeks.
Like Lara says we need to wait once int (5) is complete.
I just pointed out this possible typo “So far primary wave 5 is in it’s 7th week, so maybe it will last either 13 or 21 weeks”.
How can the primary wave 5 be in its 7th week if it is already 35th?
OMG you’re right. I’m counting minor wave 3, not primary wave 5. Dammit.
The next Fibonacci number in the sequence is 55, so that means primary wave 5 may continue for another 20 weeks.
Thanks Danil!
For all you money savy people out there….US Non Farm Payroll “report doesn’t justify the magnitude of dollar gains so far” per
http://news.forexlive.com/!/us-dollar-surges-on-non-farm-payrolls-but-some-caveats-in-the-data-20150306
Probably because Greece asked for immediate resumption of bailout talks-
see:
http://www.foxbusiness.com/economy-policy/2015/03/06/greece-wants-immediate-talks-with-troika-on-bailout/
Lara, congratulations on the super accurate call Thursday on gold having a major drop within 24 hours. Some EW experts were even calling for gold to go up on Friday with a strong US NFP report. When pre-market news came out super strong, gold didn’t go up it went down like you forecast. Gold peaking Thursday at 1,210 and then crashing at 8:30 am Friday before NYSE open really hurt those in 3X gold Bull ETFs based on some other EW experts. Your subscribers had your early warning analysis Thursday so we had time to exit any bullish positions and get in bearish ETFs. Thanks for your top notch EW skills.
Members here have upper hand in trading this rather difficult sector kudos to Lara’s excellent EW skill.
I read as much analysis about gold & miners as possible and often they conflict so much that all it does is confuse the situation.
Much respect to Lara for keeping it to the waves… just the waves. I think some time ago she said that she doesn’t read or watch the news much at all. I gotta say, I think that is a great trait for “the best” EW analyst to have.
OK, so she likes the ocean waves too… Nothing wrong with that! Good for the soul…
I’d rather go surfing than waste time reading “news”. I’m happier 🙂 I have a new GoPro camera and I’m stoked to see what my surfing looks like, so I analyse that too to try and get better.
You’re welcome! It was a really difficult week while minor wave 2 unfolded and I had my confidence somewhat shaken. When that happens I just go back to basics, in my little EW bubble, and focus on structures and go for the most typical look.
The biggest thing is for me to pick those third waves for you all. If I can get them most often you should all be able to profit.
Gary Wagner EW expert at Kitco.com Friday says if Gold breaks this major support level at $1,168 than $1,000 Gold becomes a real target.
http://www.kitco.com/ind/Wagner/2015-03-06-Upbeat-Jobs-Report-Hammers-Gold-Prices.html
http://www.kitco.com/ind/Wagner/images/20150306-WagnerGC.JPG
Hi. Thanks for your earlier views/comments papudi/fencepost…. The way I see it now: Upside risk comes in at under 1283 with 1293 on the outside if gold price can get past 1270-71, 1275 lol…. With a low range close, expecting downside continuation on Monday as Lara has mentioned (gold price did get hit by a doji in its attempt to rise above 1167-68). Momentum seems to have slowed down though and I would expect a snap rally (up move) to occur once the downward price movement begins to gravitate. I would look to short this rise/rally. With daily RSI tagging below 30 and Gold price below the lower band remains a concern though. Gold price is not showing any signs of bottoming just yet and weekly outlook also indicates to expect a good downward move but a turnaround ought not to be too far off.
CORRECTION: Upside risk under 1183/1193 if can get past 1170-71, 1175….!
Syed
you can edit your post do not have to use reply to yourself.
There is a edit below the post. once click it will open your post for correction and save the edit.