
Another red candlestick and a decrease in momentum were expected for Monday. So far that is what we have, although the session is not yet over and the candlestick may yet end as green.
Summary: The trend remains down. A third wave is incomplete. In the very short term I expect a correction to end about 1,181. Thereafter, more downwards movement should follow. The mid term target for minor wave 3 remains the same at 1,055.
Click on charts to enlarge.
Main Daily Wave Count
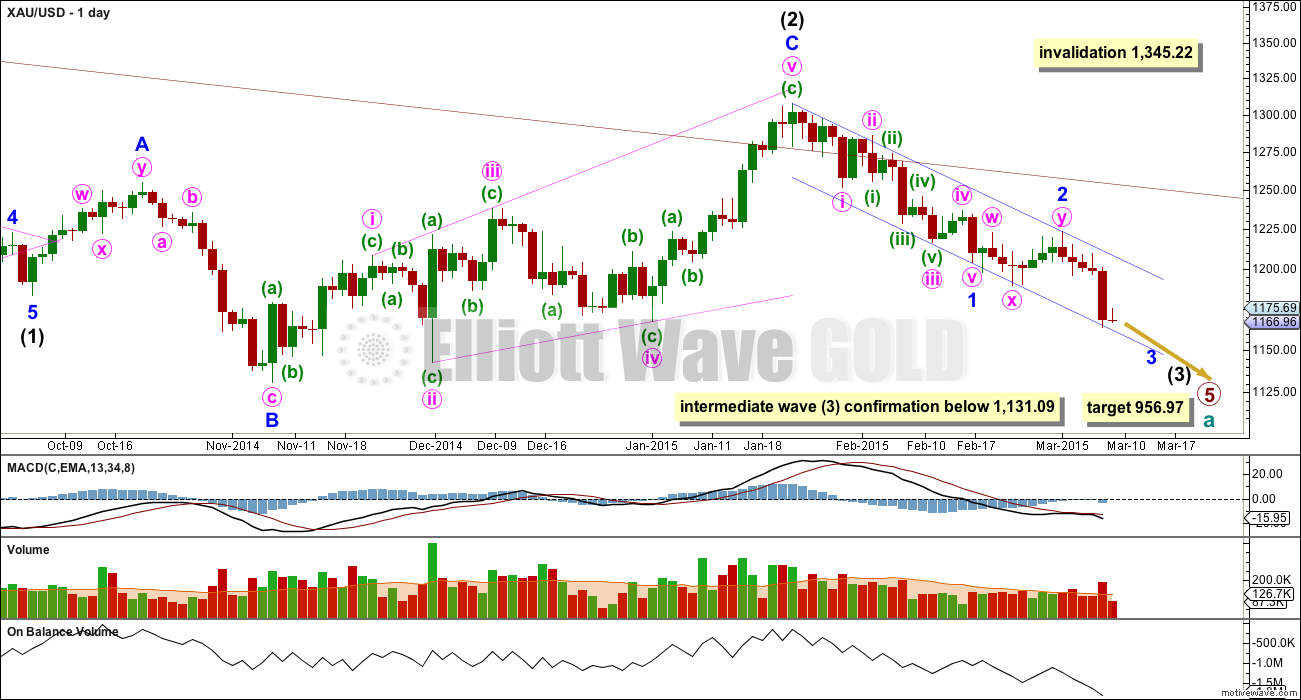
This main wave count sees Gold as still within a primary degree downwards trend, and within primary wave 5 intermediate wave (3) has begun. At 956.97 primary wave 5 would reach equality in length with primary wave 1. For Silver and GDX this idea, that the primary trend is down, is the only remaining wave count. This main wave count has a higher probability than the alternate below.
Within cycle wave a primary wave 1 lasted a Fibonacci 3 weeks, primary wave 2 lasted 53 weeks (two short of a Fibonacci 55), primary wave 3 lasted 37 weeks (three more than a Fibonacci 34), and primary wave 4 lasted 54 weeks (one short of a Fibonacci 55).
Primary wave 5 is now beginning its 35th week and the structure is incomplete. The next Fibonacci number in the sequence is 55 which would see primary wave 5 continue for a further 20 weeks, give or take up to three either side of this number. Although I am expecting primary wave 5 to be equal in length with primary wave 1 that does not mean it must also be equal in duration.
The maroon channel about cycle wave a from the weekly chart is now breached by a few daily candlesticks and one weekly candlestick. If cycle wave a is incomplete this channel should not be breached. The breach of this channel is a warning this wave count may be wrong, and so I will still retain the alternate.
Draw the maroon trend line on a weekly chart on a semi-log scale, and copy it over to a daily chart also on a semi-log scale (see this analysis for a weekly chart).
To see daily charts showing the whole of intermediate wave (1) from its start at 1,345.22, and an explanation of why this main wave count has a higher probability than the alternate, see the last analysis showing charts to that date here.
A new low below 1,131.09 would confirm that intermediate wave (3) down is underway.
Intermediate wave (2) may not move beyond the start of intermediate wave (1) above 1,345.22. If this invalidation point is passed this wave count would be fully invalidated.
Within intermediate wave (3) minor wave 1 is a completed impulse lasting 18 days. Minor wave 2 is a completed double flat correction which lasted 9 days, exactly half the duration of minor wave 1. Because this is a second wave correction within a third wave one degree higher I would expect it to be more shallow than normal.
Minor wave 3 may total either a Fibonacci 21 or 34 days, depending on how long the corrections within it take. So far it has lasted only 5 days.
Draw a base channel about minor waves 1 and 2. Minor wave 3 should have the power to break through support at the lower edge. Along the way down upwards corrections should find resistance at the upper edge. Copy this channel over to hourly charts. I had expected this channel to be breached on Monday. While the lower edge continues to provide support the alternate wave count should be considered as a possibility.
Since the top labelled intermediate wave (2) volume is still strongest on down days. Volume for 2nd March, a down day, was the highest since 5th February, also a down day.
On Balance Volume continues to agree with the downward trend for price. The increased volume bar for Friday also agrees the trend is down.
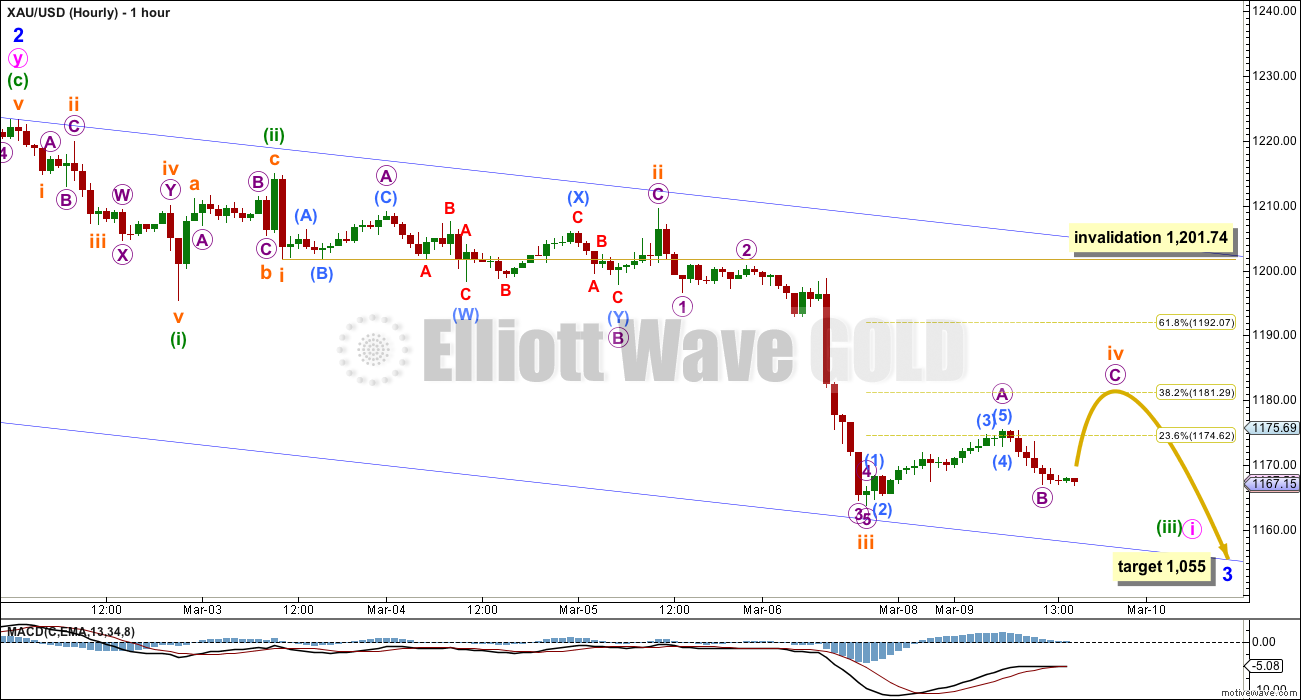
The duration of sideways movement for Monday strongly suggests subminuette wave iii is over and subminuette wave iv has begun. It is possible that a small series of fourth and brief fifth waves are squashed in at the end of subminuette wave iii on the five minute chart.
Subminuette wave iii has no Fibonacci ratio to subminuette wave i. It is very likely that subminuette wave v will exhibit a Fibonacci ratio to either of subminuette waves iii and i. When subminuette wave iv is complete then a target down for subminuette wave v to complete minuette wave (iii) can be calculated. That may be able to be done tomorrow.
So far within subminuette wave iv micro wave A may be a completed impulse on the five minute chart. This movement is ambiguous, which means subminuette wave iv may be a zigzag and is possible that it could be complete. However, it is more likely that subminuette wave iv is incomplete though, to be better in proportion to subminuette wave ii so the wave count has a more typical look to it at the hourly chart level.
Subminuette wave ii was a relatively deep 0.59 expanded flat correction. Given the guideline of alternation subminuette wave iv may be expected to most likely be a zigzag or zigzag multiple, and to most likely end about the 0.236 or 0.382 Fibonacci ratios. So far if only micro wave A is complete it has reached up to the 0.236 Fiobnacci ratio, so micro wave C may end a little higher at the 0.382 Fibonacci ratio at 1,181.
Subminuette wave iv may not move into subminuette wave i price territory above 1,201.74.
When this fourth wave is complete then a fifth wave down should follow. The trend remains down. Gold sometimes exhibits strong swift fifth waves, typical of commodities. It does not always do this, but it does it often enough for it to be a tendency we need to look out for. If this happens then subminuette wave v may have the power to break below the lower edge of the blue base channel.
At this stage I expect that only minute wave i within minor wave 3 is coming to an end. It is entirely possible that minute wave i will continue to find support at the lower blue trend line this week, and minute wave ii could bounce up from here. Alternatively, it is also possible that the fifth wave within minute wave i will be swift and strong and break below this blue trend line.
If the lower blue trend line is not breached this week that does not mean the alternate wave count below is more likely. The base channel may not be breached until the middle of minor wave 3 begins.
Alternate Daily Wave Count
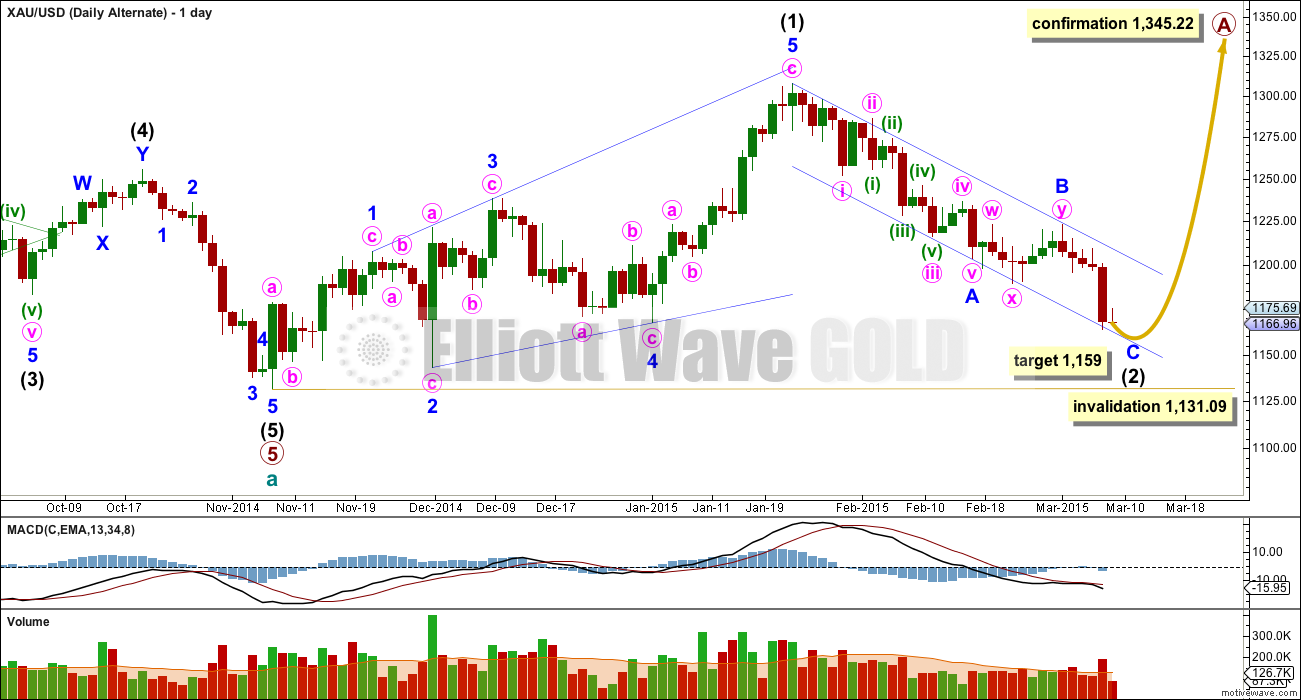
At this stage I judge this alternate wave count to have a lower probability. The structure of downwards movement, and momentum, will determine which wave count is correct over the next few weeks. At this stage they both expect more downwards movement so there is no divergence in the expected direction.
This wave count sees a five wave impulse down for cycle wave a complete, and primary wave 5 within it a completed five wave impulse. The new upwards trend at cycle degree should last one to several years and must begin on the daily chart with a clear five up.
The first five up may be a complete leading expanding diagonal. Within leading diagonals the second and fourth waves must subdivide as zigzags. The first, third and fifth waves are most commonly zigzags but they may also be impulses. This wave count sees minor waves 1, 3 and 5 as zigzags.
Leading diagonals are almost always followed by deep second wave corrections, sometimes deeper than the 0.618 Fibonacci ratio. Intermediate wave (2) is now deeper than the 0.618 Fibonacci ratio and the structure of minor wave C is close to completion.
For this alternate wave count minor wave C down must subdivide as a five wave structure. The hourly chart would see the subdivisions exactly the same as the main wave count above, so to keep the number of charts at a minimum I will publish only one. For this alternate at 1,159 minor wave C would reach 0.618 the length of minor wave A.
Minor wave C may come to a very slow end, with price hugging the lower blue trend line. An overshoot of the trend line for minor wave C is also possible, but less likely.
Intermediate wave (2) of this new cycle degree trend may not move beyond the start of intermediate wave (1) below 1,131.09.
This analysis is published about 04:08 p.m. EST.
Avi Gilburt: Gold Likely to Bottom in 2015 – Could Fall to $1000 or Lower
March 9th
bit.ly/199bFFT
Not too long ago in recent time he was calling gold above %1345.
Lara early February had 1,345 as confirmation of main daily wave count.
EW experts often don’t agree due to complexity and EW requires personal interpretation and also open to individual’s errors.
Avi Gilburt is the person who I referred to in yesterday’s post about an analyst who wins subscribers through controversy. There are many posts in his articles in which readers criticised him for precisely that, changing his mind every so often. And guess what, instead of admitting it, he scolds them for not reading his articles carefully. It makes interesting reading if you are bored.
Most who complained about Avi were either just attacking Elliott Wave or didn’t read his articles carefully and understand them. I read his articles and understood them. It is different and more difficult writing a once a week EW article versus a one a day EW article.
I followed Avi for 18 months and he was very good. He help me make a lot of money.
However Lara was better.
Lara
Any idea which wave we are in now. The next target and next retrace target so we can jump into some intraday swings before day end please?
I think subminuette wave iii ended at the last low of 1,155.35. Subminuette wave iv is unfolding now and I have a target at 1,176 for it. I’m expecting a zigzag. Micro wave B within it is either moving lower or it’s over, but if this is a zigzag micro wave B should not make a new low below micro wave A.
At 1,176 subminuette wave iv will be at the 0.382 Fibonacci ratio of subminuette wave iii.
Appreciate the response by Lara, many thanks…. At this stage hard to see gold price get past 1166-71 range subject to break above 1164-65…. Lets see how this plays out….tomorrow is another day!
If gold is going to drop big here, it should do so soon. For me trendlines are king. And there’s gann line around 1155 that proved itself, and the obvious horizontal support at 1130, plus a turn window later this week.
Richard. Be careful if you want to buy gold on the way up. I read a recent article in finance.yahoo.com which says that NUGT and JNUG are the worst performing leveraged funds, and that people have lost heavily trading them. By contrast, DUST and JDST are the best performers.
Today, the performance of the miners are very much disproportionate to the movement of spot gold prices. JDST rose nearly 16% when gold price dropped in what could probably be the B wave of subminuette 4 (the drop from 1170 to 1159). I am not complaining; I am a beneficiary of that move. At the same time, JNUG dropped nearly 18% and NUGT only a third of it. I hope JNUG repeats its outperformance for subminuette 5 tomorrow — ka-ching!
Silver and Platinum give may
give us an indication of the short term trend as they are currently declining
ahead of gold.
A while ago Gold price got hit for the downside on the rise towards its pivot 1169/70 and looks like headed back down for a break below 1158/55…. With daily RSI tagging below 30 remains a concern; will probably contain the depth of the drops and/or seek for gold price to rise…. Hard to say what wave count Gold price is in now.
Shorting at 1,190’s sounds great if it gets there, however before I’d do that.
Is it possible that alternate count minor wave B might have gone below 1,159 down to low 1,155.38 at 4:47 am and then Minor wave C has started in Alternate’s year + rally? With so much bouncing overnight. I don’t know what the next target is?
If alternate wave to 1,155.38 then back up is not possible, than I think subminuette wave iv was already over at Monday’s close as Lara considered that possible and then subminuette wave v was a strong 5th wave down and dropped to 1,155.38 to complete minuette wave (iii) but didn’t have enough power to break the lower edge of the blue base channel and bounce up off it.
At 1,155.38 subminuette wave i of minuette wave (iv) may have begun up, but how high is it’s target?
Lara, can you comment on why you didn’t go with this (pink) idea. Despite not lining up nicely with the daily, the ratios fit well within the minute subdivision. Also if you extrapolate this idea further… blue 2 would have a good chance of finding .618 resistance on the maroon channel line.
Because it doesn’t have the right look on the daily chart. For Gold particularly that is important.
And because the wave count I have does look right on the daily chart. So I’m going with the one that has the right look.
At the moment looks very strong bullish. I wait for closed H4 bar
At the moment looks very strong bullish. I wait for closed H4 bar.
What percentage would you give on the alternate being correct?
Probably first confirmation the break of daily resistance trend line from 1307 will provide confidence that alternate will be correct..
The break of green trend line probably
So is minor 1 done? Anybody got a target for minor 2?
I thought we completed Minor 2 at 1233.33 ?
Lol, sorry is min 1 of minor 3 done?
Good question. I am still confused by the low of 1155.38 today. Gold price is now enjoying a mini-rally. My preference is that 1155.38 completes either subminuette 3 (which gives a nicer proportion of micro waves timewise, that is, no bunching together of waves) or minuette 3. I just can’t decide which one is correct. I feel it is less likely that 1155.38 completes Minute 1. If so, we are now rising in Minute 2. Wave 2’s are usually more violent than wave 4’s, which the current movement seems to be. We would need Lara’s help to resolve this.
If min 1 ended at 1155, i am getting a retrace to 1190ish.
I agree. If not, the rise wouldn’t go far above 1181 which is a resistance level. Only question is whether the current rally has ended, or whether there are 3 waves, which of course, terminates in the 1190s. That gives an excellent entry point for shorting.
As I see it, there are two possibilities:
(1) Subminuette 3 (abbreviated to sm 3) is not over. The point labelled sm 3 is actually micro 3. The point labelled micro A of sm 4 is actually sm 4. The low just encountered would be micro 5 and hence ends sm 3. This would remove the necessity for bunching together of the fourth and fifth waves. And sm 3 looks more in proportion.
(2) The main wave count is correct. The low encountered just now was micro B of sm 4, and hence sm 4 is forming an expanded flat.
In both cases, sm 4 can terminate around 1181.
I don’t have data feed that goes down accurately to the 1-minute interval, so I can’t decide which is which.
Use http://www.pmbull.com it goes down to the 1 minute time frame. No extra data feed required.
1,159.85 at 11:47 pm is new low.
Sorry Lara, I flagged this by mistake.
Thanks
For trading purposes I hope one of your scenarios is correct. I exited short position after Laras report, looking forward to improved entry point, I hate to start chasing.
Thanks for your input as always
There may be a 3rd and 4th possibilities.
Lara advised that subminuette wave iv could already be over having already reached up to .236 at 1,174.62 earlier today. So it may be possible that 1,159.85 at 11:47 pm is part of subminuette wave v down to complete minuette wave (iii) of the main wave count. Lara has not calculated where it would end.
The new low of 1,159.85 is also extremely close to the target for alternate minor wave C to end at 1,159.
Overnight price movement may provide clarity.
Or Lara might post an overnight comment?
lol. will we (EW Lara followers) ever let her sleep?
hey money never sleeps lol
lol 🙂
TKL
I get your point. Labeling of waves: when u write sm3 or sm 4 you mean Lara’s sm wave iii and sm wave iv to end at 1181.
pmbull.com has gold and silver real time data feed in all periods like Richard mentioned below.
Gold just made new low at 1155.38. I suppose that is close enough for Lara’s target of 1153 for tis run and now smiv unfolds?????
Hi papudi. Actually whichever wave we are in doesn’t matter much for the next few days. I still think my model might be playing out. It calls for a nested set of 4ths and 5ths. We can trade them as a consolidation band. The upper and lower bounds are more or less identifiable. If they are quite similar, we have a bear flag; if the range widens (slightly higher highs and lower lows), we have a bear pennant. The range breakout should see another big drop down (the second half of the flag/pennant pattern). Alternatively, the pattern fails and we have a multi-year climb for gold as in Lara’s alternate count.
You trade crude too. You can get 1-minute data for crude, gold, WTI, Brent, metals, currencies incl SGD, from fxcm.
For short-term or leveraged trading, IMO a real trader’s platform like that is so superior to trading ETF in many ways. Not the least of which is 24-hour trading, so you’re not without access to the market when your price hits or moves; get as little or as much margin as you can want/afford; better liquidity particularly and stop losses. IMO trading without stops or 24-hour access is a trading accident waiting-to-happen.
Also, something I find indispensable there is the SSI proprietary sentiment data, which is superior to DSI daily sentiment index, Investors Intelligence, etc. Because SSI data is based on the total positions of real traders, instead of just sample surveys of opinions of those who mightn’t even have any money at stake (talk is cheap, right?). Furthermore, the data is closer to real-time instead of daily (or worse).
Accounts and some education is free, and until March 15, you can also get free premium products and services plus $500 of your choice of trading Apps.
http://www.dailyfx.com/forex/education/trading_tips/daily_trading_lesson/2015/02/12/FXCM-Open-House-2015.html
I don’t work there or anything; I just trade.
Great info.
How to access SSI?
Get FXCM trading account (costs nothing)
then sign-up for their dailyfx-plus to see SSI.
Then you can paper-trade (not real money)
for practice, or trade real money of course.
Hi J. That’s fantastic information. Thank you so much for sharing.
Re: 1-minute feeds and charts: Can see on investing.com
Real-time flash charts for various time bars.
Gold, silver, xau, commodities, indices, bonds, individual stocks, currencies, even sgd 🙂
There’s a really nice ratio between micro waves 1 and 5 with the first idea, and so that’s the wave count I’m going with today. It has the best look. Micro wave 5 is as good five wave impulse also.
With the second idea micro wave B looks like a five not a three, and that would also see subminuette waves ii and iv as flats with no alternation. So I don’t like that idea as much.
Hi Lara, Does this new low of 1161.39 mean wave IV is over?
Or did B just move and now we are in C up?
1970s or 1980s?
http://www.macrotrends.net/1317/historical-gold-price-chart
1970s or 1980s?
http://www.macrotrends.net/1317/historical-gold-price-chart
Dear Lara,
Just to follow-up please, in the alternative count, for the portion after the $1131 low, could the count potentially become a 3-3-5 corrective flat (per the chart I posted yesterday), or is it impossible to count the 1131-1307 advance as a 3-up correction instead of a 5-up impulse?
The thing is, suppose price drops slightly below 1131 and then moves over 1345. The 3-3-5 flat (or expanded flat) accommodates such price action (and others). But that price action would invalidate all your counts, suggesting it’s impossible?
Thank you.
If gold went below 1,131 and above 1,345 the same day then both daily wave counts would be invalidated!
However if gold goes below 1,131 it is expected to go above 1,345 hopefully before the year end without becoming invalidated.
I have seen gold make that kind of $214 swing but only at the top. That happen in 1980 January. That was some sight to be seen. I was then plotting gold chart with pencil, ruler and on engrg graph paper. I still have those charts daily and weekly.
Today gold is in the middle of the trading range. Not possible unless FED announces Gold standard or just utter the word gold in any speech.
Don’t forget that gold also moved down that much in one morning in mid-April 2013 to $1320. It then recovered to end the week at 1401. You can see the perfect textbook-like cup-and-handle on the chart from then on.
Gold dropped $229.24 over 2 days April 12th and 15th, 2013
nice 🙂
Yup someting like that, you remember too. Gold collapsed overnight when 1525 shelf support broke. It was the biggest move I’ve seen. I wasn’t born yet for the move in 1980
I think separate counts can invalidate separate days
One way to think about your “impossible” question is that there could be many legal EW counts but Lara is only going to show the one or two that she believes are the most probable.
On your 3-3-5 question… If you want the trip from 1130 to 1307 to be a 3, you need to be able to see the subtrip from 1130-1239 as a 5. You’ll need to draw up a chart to show the detail. Here are some suggestions from me eyeballing a daily chart: subwave 1 as a 5 (1179, 1145, 1192, 1173, 1207), subwave 2 down to 1141, subwave 3 as a 5 (?, ?, 1221, 1186, 1239), subwave 4 down to 1232, subwave 5 to 1238.90 as a truncation. Note I had to assume some hourly waves in the 1dec14 bar. That is necessary to avoid subwave 4 from overlapping subwave 1.
Hope that helps.
Yes indeed it helps and (seems to) fit, thank you!
Here is another suggestion that might help you make a stronger case with Lara. Whatever you come up with has to fit with prior market action. Lara’s main and alternate counts cover the two most popular EW interpretations at Intermediate and higher degree. Lara’s main count has the 1131 low as the end of wave B of an expanded flat. Lara’s alternate has 1131 being the end of Primary 5. So, unless you are going to propose a new interpretation for events prior to the 1131 low, you have two options: (1) start a corrective structure at the 1183 low in early oct14, or (2) start an impulsive structure at the 1131 low.
Right. Thanks a bunch once again.
I wasn’t seeing what J was trying to show me.
Now that J has managed to explain to me the idea I get it.
I saw your chart, and the idea does not make sense.
You are trying to see if primary wave 5 can be an expanded flat?
Fifth waves may only be impulses or ending diagonals.
So no, the count cannot be a 3-3-5 flat.
No, Lara, it’s not whether Primary 5 could be a flat.
Rather, it’s whether gold could possibly be in a primary B flat (circle B), starting at the Nov low at $1131 and unfold as a 3-3-5 flat? (after the 5-waves down for primary circle-A)
Labels are changed by one degree of trend compared to your Alt, with gold now in Int (B) of Primary B (circle). Gold can go below 1131 without invalidating.
Ahhhh… I see now. Sorry, not sure what I was seeing in the last chart.
Okay. I guess this could be the case, but that would be a remarkably brief cycle wave b.
So this idea sees intermediate wave (A) as a zigzag (which can fit, so that’s okay), and now intermediate wave (B) down as another zigzag which looks now to be over 90% of (A) so a flat is possible.
When I look at that idea on the weekly chart to get an impression of proportion, it looks to be way too brief. That’s really my only problem with it.
I’ve considered this idea and discarded it pretty quickly for this reason.
Yes lara. I thought you probably would have considered already. Thanks for feedback.