
The short term target at 1,215 was not met. Price has moved lower, and a second wave correction was expected to find support at the lower edge of the blue channel.
Summary: The main and alternate daily wave counts strongly diverge. The main wave count is more likely and expects strong upwards movement in the next 24 hours to a short term target at 1,243. The alternate daily wave count expects strong downwards movement in the next 24 hours. Volume favours the bullish wave count.
Click on charts to enlarge.
Main Daily Wave Count
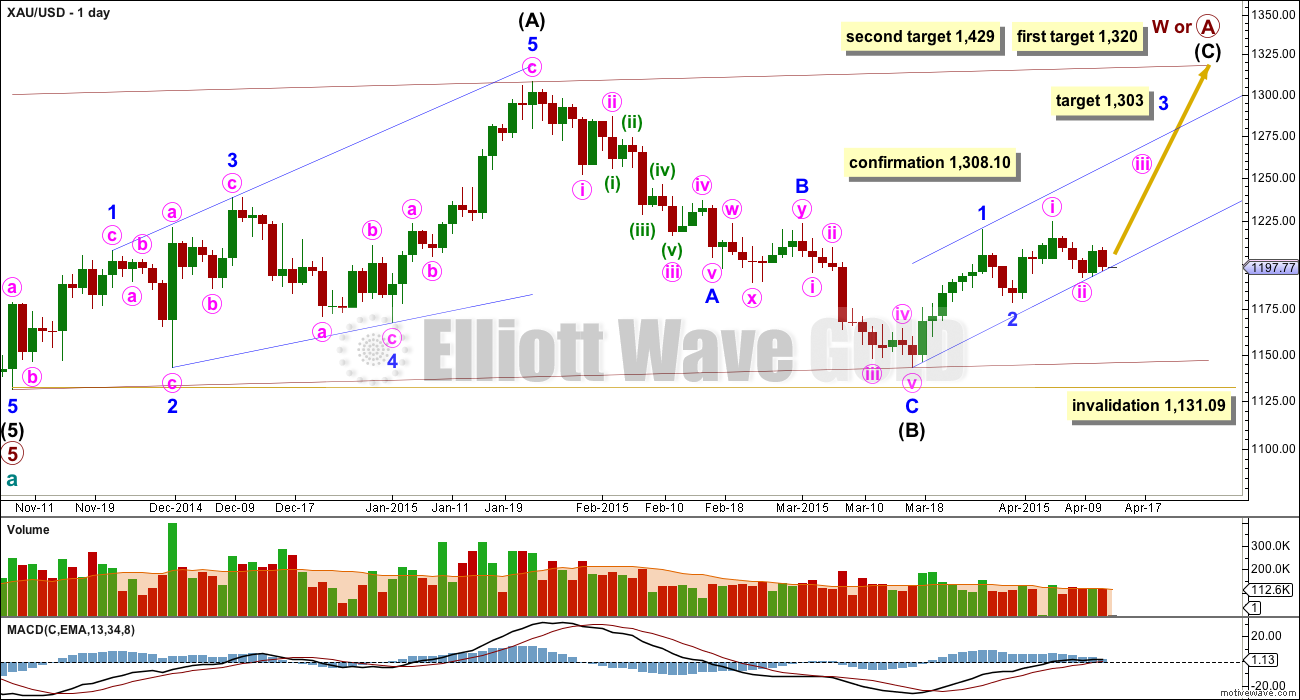
There are more than thirteen possible corrective structures that cycle wave b may take. At this stage it is unclear what degree to label this big movement. Primary wave A (or W) is an incomplete zigzag.
It is also possible that primary wave A will subdivide as a five wave impulse if cycle wave b is a big single zigzag. This idea would relabel intermediate waves (A), (B) and (C) to intermediate waves (1), (2) and (3) within primary wave A trending upwards. The length of this current upwards move labelled intermediate wave (C) on the chart will indicate if this scenario is possible.
Cycle wave b may be a flat correction where primary wave A is a zigzag. Cycle wave b may be a triangle where primary wave A is a zigzag. Cycle wave b may be a combination where primary wave W is a zigzag. Cycle wave b may be a double zigzag with the first in the double, primary wave W, incomplete.
When the big zigzag now labelled primary wave A is complete, it is also possible that cycle wave b could be over there with the degree of labelling within it moved up one degree.
When intermediate wave (C) is a complete five wave structure alternate wave counts will be required to manage the various possibilities of cycle wave b continuing.
A new high above 1,308.10 would invalidate the alternate and confirm this main wave count at primary and cycle degree.
The upwards wave labelled intermediate wave (A) fits only as a five wave structure, a leading expanding diagonal. Within a leading diagonal the first, third and fifth waves are most commonly zigzags, and the fourth wave should overlap first wave price territory.
Because intermediate wave (A) subdivides as a five, intermediate wave (B) may not move beyond its start below 1,131.09.
At 1,320 intermediate wave (C) would reach equality in length with intermediate wave (A). If price keeps rising through this first target, or if when it gets there the structure is incomplete, then I would use the second target. At 1,429 intermediate wave (C) would reach 1.618 the length of intermediate wave (A).
Because intermediate wave (A) is a diagonal then it is highly likely intermediate wave (C) will be an impulse in order to exhibit alternation. Intermediate wave (C) may end about the upper edge of the channel drawn about primary wave A.
This wave count sill has problems of structure within primary wave 5 of cycle wave a:
– within primary wave 5 intermediate wave (2) is a running flat with its C wave looking like a three and not a five.
– within intermediate wave (5) the count is seven which is corrective; either minor wave 3 or 5 will look like a three wave structure on the daily chart where they should be fives.
It is for these reasons that I will retain the alternate until price confirms finally which wave count is correct and which is invalidated.
At 1,303 minor wave 3 would reach 1.618 the length of minor wave 1. Within minor wave 3 minute waves i and ii are complete. Minute wave iii should have begun on Friday.
The base channel is adjusted to a best fit. The lower trend line may provide support. The upper trend line may be breached by a strong third wave up.
Volume for Monday is slightly lower than the prior up day. Since the end of minor wave 2 volume is highest on up days, which supports a bullish wave count.
Friday’s session completes a bullish engulfing candlestick pattern. This is the strongest bullish reversal pattern.
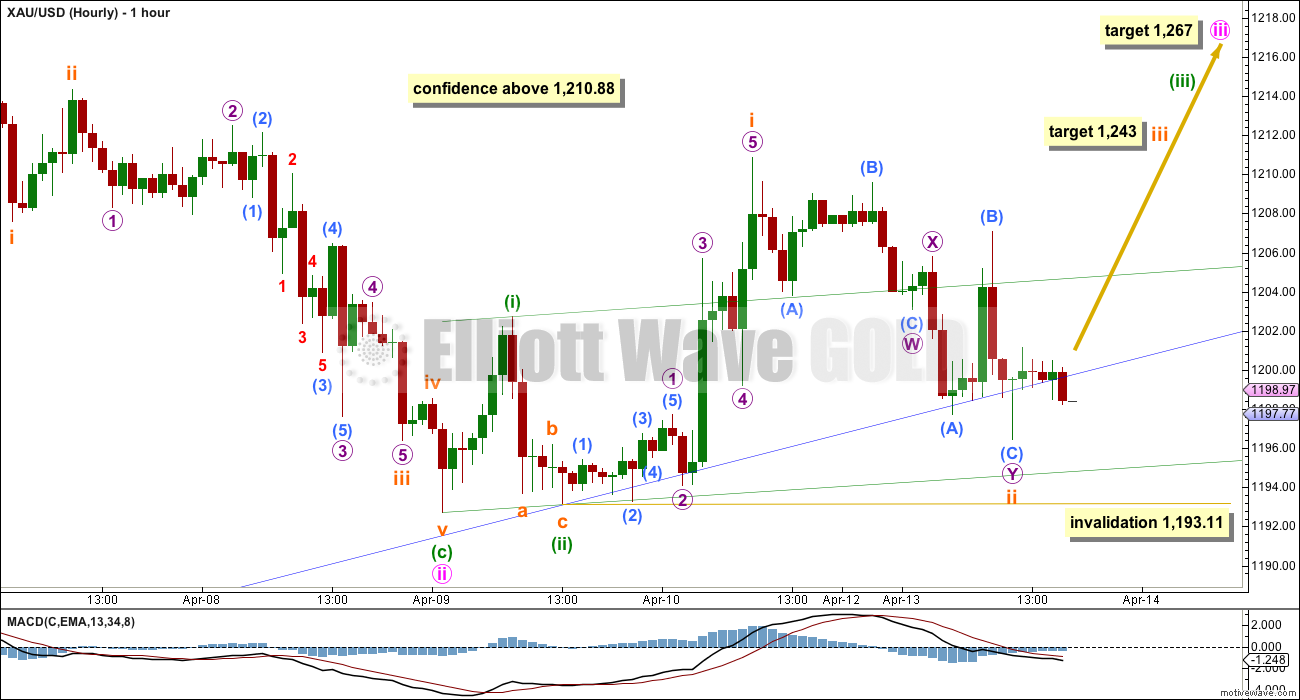
Price did not make a new high on the hourly chart towards the target at 1,215 and so a five up was not completed. This is slightly concerning for this wave count, but fits the alternate daily wave count nicely.
If minute wave iii began at the low labelled minute wave ii then so far within it two first and second waves are complete. This indicates that the middle of the third wave should begin, most likely within the next 24 hours. This wave count expects to see a strong increase in upwards momentum.
At 1,243 subminuette wave iii would reach 2.618 the length of subminuette wave i.
It is slightly concerning that downwards movement is now below the lower edge of the blue channel. Base channels almost always work, but almost always is not the same as always. I have seen several instances where they do not work as expected.
At this stage a new high above 1,210.88 would provide a lot of confidence in this wave count.
I have drawn a base channel about minuette waves (i) and (ii). If subminuette wave ii moves lower it is very likely to find support at the lower edge of that green channel.
Alternate Daily Wave Count
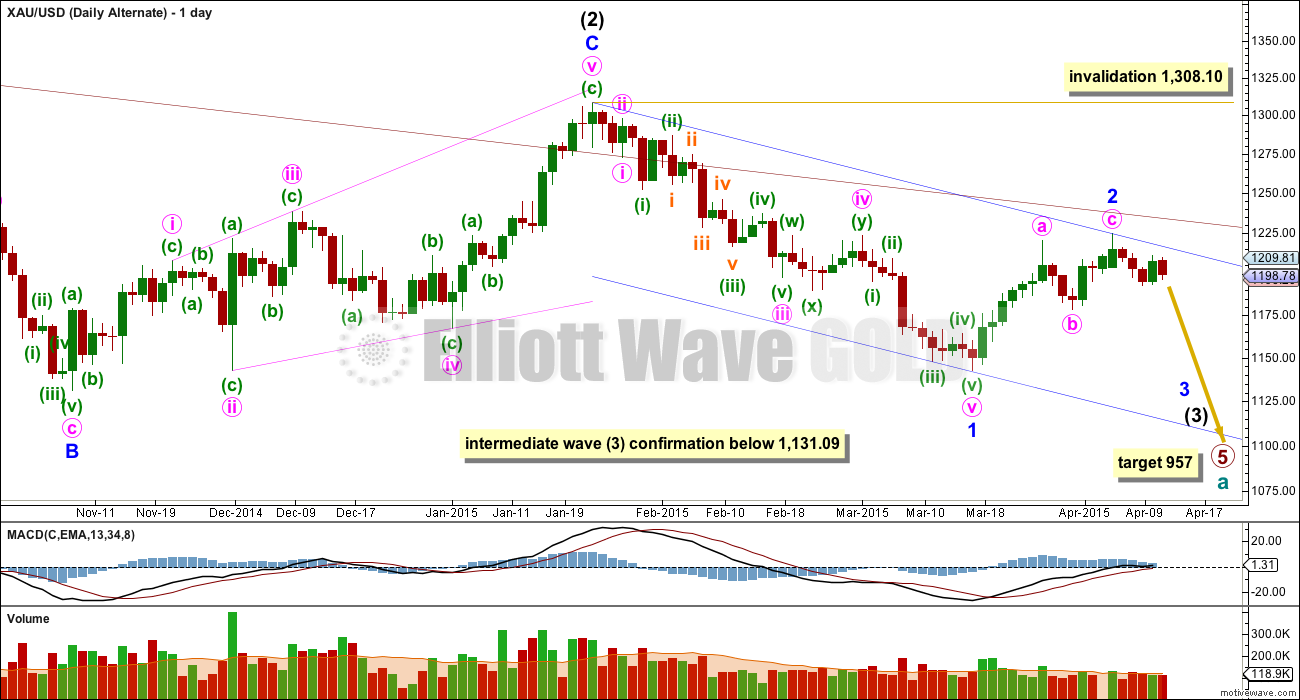
This alternate wave count sees Gold as still within a primary degree downwards trend, and within primary wave 5 intermediate wave (3) has begun.
At 957 primary wave 5 would reach equality in length with primary wave 1. Primary wave 5 may last a total Fibonacci 55 weeks. It has started its 40th week.
The maroon channel about cycle wave a from the weekly chart is now breached by a few daily candlesticks and one weekly candlestick. If cycle wave a is incomplete this channel should not be breached. The breach of this channel was the first warning this wave count may be wrong.
This wave count still has a better fit in terms of better Fibonacci ratios, better subdivisions and more common structures within primary wave 5, in comparison to the main wave count above.
Within intermediate wave (3) minor wave 1 is a long extension. Within minor wave 1 minute waves iv and ii are grossly disproportionate, with minute wave iv more than 13 times the duration of minute wave i. This also reduces the probability of this wave count.
Although the invalidation point is at 1,308.10, this alternate wave count should be discarded long before that price point is reached. If the maroon channel is breached again by one full daily candlestick above it and not touching it then I would discard this alternate wave count.
A new low below 1,131.09 would confirm that intermediate wave (3) down is underway.
Minor wave 2 would now be a completed zigzag. If this alternate is correct it should show itself this week. It now expects a big increase in downwards momentum as a third wave at two degrees begins to gather momentum. An increase in volume as price moves lower would support this wave count. A new low below 1,178.59 would be a strong indication this wave count may be correct.
For this alternate wave count volume since the end of minor wave 2 is so far highest on down days. Friday’s volume for the only up day since that high is not the lowest, but it is lower than two days prior. If the next up day shows higher volume this wave count would further reduce in probability. If the next up day shows lower volume this wave count would be supported.
This alternate wave count remains technically possible. Because the implications are important I will continue to publish it at this stage.
This analysis is published about 05:51 p.m. EST.
My conclusion from analysis of the hourly charts for bull and bear wave counts is price should continue lower for the short / mid term. The target for the bull wave count is 1,157 for minor wave 2 to complete an expanded flat.
The target for the bear wave count is 1,059 for a third wave.
This downwards movement includes heavy volume. On that basis I must swap the main and alternate wave counts over.
Both the main and alternate daily wave counts are viable. I must judge them now to have an about even probability. Both have problems, both have factors in their favour.
The bullish wave count could even see a new low below 1,178.59 if this downwards movement is minor wave 2 continuing. That would resolve the problem of disproportion between minor 2 and minute ii one degree lower, and would resolve the problem of minute ii breaching the base channel. So only a new low below 1,142.82 will provide full price confirmation of the bear wave count because minor wave 2 can move a lot lower, but not beyond the start of minor 1.
On the opposite side, for the bear wave count, we have strong volume exactly as it should be if the middle of a third wave is beginning. A new high above 1,224.35 only wold invalidate the bear wave count at this stage. In the short term a new high above 1,210.88 would reduce its probability.
So unfortunately the situation is unclear. While price remains below 1,210.88 and above 1,142.82 both wave counts will remain viable, both expecting exactly the opposite movement, both expecting that movement to be strong.
I’m off to work on that now.
As always, Thanks to Lara for the clarity, and before markets close. Much appreciated!
You’re welcome. I much prefer to have just one wave count, but in this instance it’s not possible. Price will tell us which one is correct, but we may have to wait several days to get clarity.
Thanks, Lara. Even though I’ve been down in the last few weeks, since I’ve joined your service a few months ago, my account has tripled. Though it’s been a frustrating month, I’m still very impressed with most of your calls. Keep up the good work!
WOW!!! Congrats.
I am wondering profits not by trading Miners but may be futures in gold. that will do it.
For some it has been in cash/loss most of the time due to gold being out of synch with US market opening.
.
I’m a pretty risky trader, and have been taking mostly losses lately…Tham’s a lot smarter than I am by waiting for the move to get in, but I usually get the meat of the trade with Lara’s calls. Gold is far more stable than the miners, so it’s a safer play–but a lot of confusion…a lot of really good traders have been taking losses in gold lately, too, so we’re not alone.
Thanks Victor. I know this is frustrating, and I share members disappointment that the main wave count is invalidated. I take this very seriously. Usually I have just one wave count for Gold, but sometimes the situation is just unclear and I have to have alternates.
I’m having a frustrating week with NZDUSD as well, and I wait on the sidelines to enter short there too.
Thanks for the quick note before market close Lara. Much appreciated
GDX a couple minutes ago was equal to it’s open 4 cents above its low, NUGT is only 4 cents above open 7 cents above low. GLD is only 3 cents above it’s low and GDXJ 3 cents above it’s low and JNUG only 9 cents above it’s low. Gold is $5 below Monday’s close. Gold may still retrace up to 1199 area then choose to continue up in bullish main wave or drop down in bearish daily alternate, makes for an overnight unclear move.
Agreed, very unclear. I’m close to getting stopped out of my short. Will be interesting to see what happens next
I suppose we all have different styles. I’m not sure how much clarity we ever have on a move until we are able to view it in the rear-view mirror. Hence, I pick my support levels to buy and resistance levels to sell and look for structural clues along the way. Once the move looks clear, the meat of the move may be long gone. This is just my opinion and style of course. We all need to trade what we are good with and comfortable with.
I still like the bullish structure of the GDX charts, including the attached 30-min chart….I remain long.
I wish I could stay bullish, Mark, I wish I could…but action in the metals and miners are telling me to be very cautious. GDX is below its pivot for today at 19.31, which now has a bearish sense about it…it couldn’t even challenge the 50 sma at 19.91. Copper is down, silver is down, gold volatility is up, and the US dollar is even down for those who care. Maybe I’m being impatient, but I just don’t feel it being bullish. I guess anything can happen at this point…
The US dollar is higher now that when gold was at it’s peak at 11:00 am. It may be possible that a 5th wave down may finish soon for a small bounce, however I wouldn’t want to stay in a bullish position overnight, definitely any large position. The bearish scenarios about the alternate bearish count has already began. Best wishes.
GDX daily remains in upper half of BBand and the structure contains bullish flags. Until that changes, I will stay long….I know where my exits are so I really don’t mind holding here at all.
and it looks like the intraday DUST bearish flag just broke down. This could be an interesting final hour of trading 😉
Indeed, good luck to all of us…very confusing last few weeks to say the least.
once gold break 1130 in a weeks time, the ALT will become the primary
Gold Price Dome Cap, Fall Below $1000 Likely
Commodities / Gold and Silver 2015Apr 13, 2015 – 11:28 AM GMT
By: Clive_Maund
http://www.marketoracle.co.uk/Article50227.html
What would abort the bearish scenario for gold set out here? That is very simple to say – it would be a clear breakout by both gold and silver from their major long-term downtrend channels, which would surely be occasioned by the dollar breaking down from its parabolic uptrend.
After reviewing everything, IMHO the B wave triangle in an ABC for Minor 2 idea posted by Bob below may have the most merit as an alternate to the bull case, however, the b wave of that triangle really looks like a 5, and I’m pretty sure all waves in a triangle must be 3’s.
Any thoughts on this appreciated
A VIEW: Yet again a break below 1192 required for 1189-85-83 and lower; upside limiting 1205-06 subject to break above 1197/98….
Just an idea for consideration, I don’t know if Lara looked at this before. Is it possible that where she has it labeled end of minuette 1 on the main daily, it is actually only end of Minor 1, and we are now in an ABC or WXY correction for Minor 2? Just a thought
I find it neater to just say that, for the main count, Minor 2 is over. You may refer to my post to myself 3 hours ago for details.
Okay yes and it certainly could be over. Sorry if you already considered this, i haven’t had a chance to read through all the comments this morning.
I have a question – do you see this move off of the low this morning of 1183.69 to 1198.69 as a 5 wave structure? Because according to my data, wave 4 overlaps wave 1.
Overall, i think this idea is suspect and has a low probability, and for that reason and my own TA, i remain short for the moment. Was just an idea for an alternate to the daily alternate, which is also problematic.
It could be support or resistance and a long afternoon too!
fight for 1192.98
Tham did gold just peak at 11:00 am at 1199.08? It appears to be so.
Now retracing down in the first leg 5 wave down fast which may end ASAP?
Was that a 5th wave retrace and intermediate wave 3 continues down towards a new low below 1,178.59, which would be a strong indication the alternate wave count may be correct. An increase in volume as price moves lower would support alternate wave count.
The peak was 1199.08 at 11:00 am ET.
For the main count, this is Minor 3, Minute 3, minute 1, subminuette 1. The slow drop now proceeding is subminuette 2. This count proceeds towards 1303 for Minute 3. It should be quite a slow rise.
For the alternate count, this is Minor 3, Minute 1, minuette 3, subminuette 2, micro 1. This wave count expects price to peak at possibly 1200.60 for subminuette 2. It would be downhill all the way from there.
Both counts are still valid. I have no preference for either one now. Personally, I am watching the rebound off the next low when we reach it and see what happens after 1200 because that could signal divergence between the two counts. The main count will rise in a slightly stronger momentum. The alternate count will drop with a fairly strong momentum. I will enter my trade based on that information.
I found an even easier way out. Watch 1199.08. The main count will rise higher than that point. The alternate (in its current form) will never rise higher than that point; if it does, then it needs to be reworked, or more likely, wrong.
Thanks Tham, very helpful. watch 1199.08 for direction whether it’s main or alternate.
That is what I’m doing now. It pays to be careful today as price could go either direction and once a position is placed it is very difficult to recover. Tight stops are mandatory.
not much to slow it down for a while from a technical standpoint!
unless its the new line of resistance?
That is usually what happens once support is broken then it becomes resistance.
Until Lara shows up we won’t know for sure, However last night changed my outlook for today to bearish. Even two big news releases (that reduce chance of an interest rate hike by the FED) before and after the open didn’t keep the US dollar down for long. I have no gold investments now and am cautious as today’s activities are very volatile and tricky to understand and require correct action with precise timing for the fast direction changes. Gold may be making a big direction change this week starting today? Overnight holdings are questionable? Neither daily wave count is confirmed yet and main hourly is invalidated.
Above 1,210.88 for confidence in a third wave up. A new low below 1,178.59 would be a strong indication the alternate count may be correct.
If GDX can hold this area, 19.44, a line of resistance which could act as support for today, we could rise past the second resistance area at 19.61 and make a run to the third resistance area at 19.91 which is about where the 50 sma is. That would be about $12 NUGT. That’s my target for today if we stay bullish…
Stop was hit…not looking good on the bullish side currently…awaiting confirmation of trend…
mid bollinger band @ 1192.98/lower @1161.88
Comparables
Gold futures lower on rate-hike expectations
Losses trimmed after weaker-than-expected retail sales rebound – Apr 14, 2015 10:50 a.m. ET
http://www.marketwatch.com/story/gold-futures-lower-on-rate-hike-expectations-2015-04-14
USD/ markets correcting line of resistance rejected. DUST for the afternoon session?
SPX DOW NASDAQ moving up and out or into gold?
Bullish Ascending Triangles are bullish two thirds of the time…
Bearish Descending Triangles are bearish two thirds of the time….
Lara, consider this dry bones idea for both gold and stocks in the rough
Oh yes, that looks really good. I see some issues with proportion, but I’ll chart the idea and take a closer look.
Thanks! This may resolve some problems I have with the bear wave count.
I really like these charts. I think the nested 1-2, 1-2 in gold way back in 2011/2012 looks real good. Please continue posting your charts as you update them.
Ok
USD Recovering against EURO/FRANC
Did Gold just Peak in a 5th wave now at 1198.93 at 10:41 am EST?
If so, then how low might it go? And is it time for DUST now?
I’d feel more comfortable when we see if 1198.5 becomes support or is firmly rejected. but it isn’t clear yet.
DUST is really battling to maintain support here. Falling wedges are often bullish however, based on the bearish internal structure of this wedge/flag, I think it is more likely to break down than get a bounce. Let’s see how it closes today and reassess.
Papudi–several have asked for location and or address of the blog / forum you have been pasting into comments. This seems a reasonable request.
This info is posted on Chartology forum by a member. I have requested him/her to provide the site where he/she is getting the info.
I will let you all know once i get the answer.
Papudi–thanks, I understand. These posts are interesting but would like to consider both the posts and the poster closely before taking them seriously.
This is the site for Chartology Forum members only.
http://rambus1.com/
All Articles Published by Rambus_Chartology :
http://www.marketoracle.co.uk/UserInfo-Rambus_Chartology.html
1198.5 was support yesterday and now looks like the new line of resistance
Deep Dive Into Today’s Trading Activity for Market Vectors Gold Miners ETF – GDX Alert Today
There was a low put/call volume alert raised for Market Vectors Gold Miners.
Posted on 04/13/2015 by Allen Bersch
http://www.avafin.com/articles/1046523.html
Can you tell what that means for price movment?
I don’t know.
It means sentiment is overly bullish.
Fencepost
Here is what was posted 4/13
————————————————————————–
To recap, we are now on week 23 of Gold’s approximate 6 month Intermediate Cycle (IC). This IC started after the last IC LOW on Nov 7, 2014 (22-26 weeks on average LOW to LOW for an IC).
Each IC typically has four shorter term Trading Cycles (TC) that last 24-29 Days on average LOW to LOW. It appears that we started Trading Cycle #4 on March 18 and Monday will be day 18.
Some Cyclists think that Gold may have had a shortened IC and that the IC LOW was on March 17th. Supporting this position is the fact that this TC has been more bullish than most of the 4th TC’s during the long Bear Market. So are we now in TC #1 of a new 6 month IC or is this still TC #4 and the IC LOW is still ahead? Sorry, but I don’t have the answer and only the charts can tell us with a bit more time.
That said, we should know this week as Monday is day 18 and 4th TCs tend to be shortest in duration during most ICs. If this is TC #4, Gold should start moving lower very soon and should not move above 1224 before finding the IC LOW.
Here is an updated chart on the current Intermediate Cycle that I last posted on March 16th (the second chart is the Chart from March 18).
Below another cyclist responded:
I have the 14 Apr as an important LOW from triangulation
And 20 Apr was the “double bottom” in 2009 so expect a HIGH or LOW
And 24 Apr was a very volatile day in 2009
8:00 p.m.: Minneapolis Fed President Narayana Kocherlakota
I sold my GDX at 9:35 am basically broke even.
Doesn’t look bullish to me, however I might be wrong.
May just wait for Lara analysis before buying anything as overnight Gold was very bearish. However the US dollar was very strong yesterday and overnight so gold down. This morning from 8:30 am to 9:20 am the US dollar gradually dropped 1% so gold went up $14 even though many feel there is no inverse effect between the US dollar and Gold. We’re all entitled to believe whatever we want. At 8:20 am gold stopped dropping and went up .2% from 9:20 to 9:40 am and gold started dropping again and now US dollar dropping and gold going up. I’ll let Lara figure it out.
I’m not sure what doesn’t look bullish here. An update of my same chart since last week is attached. All bullish flags breaking to the upside. Very bullish structure is maintained.
And here is my same GDX hourly chart untouched in a week. Everything moving as expected. I’m looking for a move above red dashed line resistance to confirm the breakout.
So if GDX reaches, but struggles at 19.8, you’d sell GDX/JNUG etc. and consider going short/entering DUST, right?
Yes, but I’d need to see a bearish intraday structure develop as well, such a rising wedge on low volume. So far the structure looks bullish and I’m seeing charts like GG break resistance and I’m seeing DUST break support so I would not be getting into DUST at this point. I will re-evaluate at the end of the day.
Thanks, Mark – sounds like a good plan.
Not disputing your charts.
Not bullish based on Lara’s forecasts and what happened and main hourly wave count invalidated because gold deep dived much lower than forecast and main daily wave count in trouble.
However may have been an error in Lara’s wave count as gold appears bullish and US dollar is looking weak since the open.
However looks like gold may be in a 5th wave now, see how high that goes.
Well, again…I only use Lara’s charts and analysis as one piece of data informing my thinking. I do hope for confluence but I don’t always get that and that’s ok. Everything that I trade (GDX-related) is behaving exactly as I mapped out and looks indisputably bullish. Here’s the GG chart from last week….which has broken resistance. I’m sticking with my bullish trading plan until warning signs show themselves.
Well after all those overnight gyrations it all turned out to be noise from the perspective of my charts. Bullish structures remain intact and we have a strong open. Still waiting to see if GDX can break resistance however.
Papudi posted a quote from a cycle blogger last week that said today would be in inflection. Gold price action over the past hour looks like a potential bullish inflection. Papudi, could you tell us the source of your information so we can follow that blogger?
I agree with fencepost. It will be very interesting. Thanks in advance!
Dollar crashing and gold pushing up.
JP Morgan report strong earnings.
FMOC will say these are positive indicators for June liftoff
this may be a falling knife
gold rallies $8 in 1 minute.
Triangle looking good so far thanks to bob if $1184 holds
At this point , I would have to go with the triangle idea . Although Lara has said minor 2 shouldn’t last that long .
I personally worry more about what scenario can we eliminate. I think a third wave is off the table for now due to sharp rebound. If it was third wave, gold should have moved sharply lower after data release and it did not.
Yes , I agree with everything you say .
If triangle is good, this d wave should look like a 3 on daily and reach $1214-$1218
ppi up .2
retail sales up 9/10
Today’s retail sales report (0630) are expected to climb
+1.1%m/m after falling the last three months. At 9am the IMF will re‐ lease its
updated growth forecasts.
The daily counts keep changing …Daily
The only chart that has nice EW ratios and hasn’t changed in quite a while is the ALT
Is the expanded flat correction from the Main hourly analysis on April 9th in play now?
The problem is , if we are in C of a flat , the 1st wave down was a 3 wave structure . That is according to Lara’s charts . I don’t think she ever had it as a 5 . So if that’s the case , it can’t be C of a flat . That’s why the daily alternate looks better now . But Bob B might be onto something in his chart below . Although this down move looks a litle too strong maybe .
However (sigh) if we are moving down as in daily alternate , I assume that 1st wave would have to be a 5 . So I am VERY confused . Looks like that 1st wave is very ambiguous and hard to pin down .
Lara/All,
As I post this, gold is down to about 1188. The main hourly is now invalid, yet many indicators still signal more upside. If we do not go down hard from here, what do you think of this possible triangle scenario to take us to approx. 1240-1250 before we head down hard to complete the large H&S pattern and target 957?
Hi Bob: My layman view: For now 1187 appears to be holding and with hourly RSI tagging below 30, it would be reasonable to expect a price rise through 1196/97 to take out 1200 though pivot 1201-02 may be limiting…. one can never tell!
Just an FYI…that really is not a H&S and I don’t why everyone is posting it as this. The left side of ‘head’ does not come remotely close to the neckline therefore not forming a head. Anyway, your labeling of the running contracting triangle could be correct if $1185 holds
Assuming that is a 2nd wave you are referring to , Lara has repeatedly said that 2nd wave can’t be a triangle .
Never mind I am still sleepy . You are actually drawing an ABC . Good idea , thanks .
This fits the bear wave count. You’re looking at minor wave 2 continuing further, and it’s only within the B wave (as a triangle).
If minor wave 2 continues further it’s going to be quite long in duration and at the end it will probably again breach the maroon channel on the bear wave count weekly chart. That should mean that count is discarded.
For the bear wave count minor wave 2 has to be over.
there are gold analyst’s: Wave surfers, Gann Cyclists and now Skiers.
Here is a Jeff Kern a skiers with his complex mathematical model is now bearish on gold.
Apr 12 2015: The SKI indices generated a simultaneous Double Sell index pattern last Monday (4/06/15)
and SKIers were supposed to initiate short positions or at least
sell/hedge any long positions the next day. Such Double Sell index
patterns have often yielded significant declines (not “always”)…..
. A simultaneous Double Sell index situation absolutely “should” mark a significant technical moment….
http://www.321gold.com/editorials/kern/kern041315.html
Gold completely didn’t do what I expected and when my premise is wrong I sell and ask questions later. I am however curious where price heads from here at the bottom of this new potential channel and where the US markets open. I will wait until the open to see what happens before selling. http://bit.ly/1DDqMD6
Good chart. My post above my align with this for a bounce.
Yeah, those thin zones (in yellow) often act as gaps and get backfilled before a move higher. Nonetheless, if GDX doesn’t close above 19.16 level today, my bullish structures will be eroding and I will bail.
What really conflicts me is how bullish the structure looks (bullish flags). Let’s see how things shake out today. I will want to see structure maintained and I want to see GDX stay in upper half of BBands. http://bit.ly/1zcYwlt
Bullish structure appears to have won out….for now.
Gold below the neckline of small HnS. But there is bigger Top HnS : Neckline at 1141.
For this HnS to validate gold need to drop below 1141 NL.
Great chart Papudi – this is what I was referring to. Expect to see 1155 as a minimum, however medium term think we will bounce from 1140 and start a sustained rally.
Hourly invalidated. Wow.
I’ve been watching gold’s price movements for days now. (waiting for that sense of assuredness.
All I can say is… I’m glad I’m not in the market. Cash is King.
With 1192 holding, it remains to be seen if gold price can get back to 1202-09 range subject to a break above 1199/1200…. OR with a break below 1192-90 will Gold price continue for further downside towards 1185-80-117x?….
my data shows we had a low of 1189.96.
Me thinks bull rally is over.
Hi dsprospering: With a low of 1187x already, upside ought to remain curtailed under or within 1204-09 with 1224 on the outside…. With the upper band having dropped to 1217, to expect higher gold price is futile as yet but possible subject to RSI / MACD is supportive…. We will just have to wait for guidance regarding which of the E/W counts is the valid one for the current price movement today.
Hourly wave count has been invalidated with movement below 1,193.11 at 2:22 am. Main daily wave count is still valid however it is now in trouble as per Lara comment she posted. Gold has already dropped to 1,190.16 at 2:28 am. A new low below 1,178.59 would be a strong indication the alternate daily wave count may be correct.
Looks like selling time for bullish positions.
It remains to be seen if Gold price can take out 1193.36 as anticipated earlier today; and subsequently 20dma 1192.44….!
Lara posted some concerns over the main count “Price did not make a new high on the hourly chart towards the target at 1215” and that is precisely what I had uncertainties about yesterday over whether 1196.42 had been subminuette 2 in my post yesterday. My counts are exactly the same as hers except for my doubts on the last point. I had surmised that subminuette b has not ended and could continue.
Right now, the price movement has gone to as low as 1197.95 and unless it holds and bounces from there, the count may have to be revised.
The movement actually fits the alternate better. Let’s see how it plays out.
Below 1,193.11 invalidates the hourly wave count and the daily count is in trouble. So I would sell my GDX if that happens. Will wait calmly andf patiently in the meantime.
Lara feels the odds of that are low.
Volume favours the bullish wave count. If subminuette wave ii moves lower it is very likely to find strong support at the lower edge of that green channel at about 1,195. On the daily chart I think this deep second wave
correction should be over now, finding support about the lower edge of that
blue daily channel. That should continue to provide support if this wave count
is correct. If that lower blue trend line is breached on the daily chart I’d be
very concerned for that main wave count. I’d be using that trend line for
support. I don’t want to give that alternate wave count
undue weight by including an hourly chart for it.
Yesterday, I didn’t feel the odds against dropping below 1196.42 was low. In fact, I thought that it was actually higher since I posted that the subsequent price movement was very much sideways. These consolidations are characteristic of 2nd and 4th waves. I was only uncertain as to what form the wave would take, whether combination, or triangle (which alex77 said could not be in wave 2) or a very rare triple zigzag; that is a learning point to me). I decided that the issue couldn’t be resolved yesterday, so I left my positions in cash and went for an early night of sleep.
Anyways, it needs some rework. Looks like even Minuette 2 is wrong. But the price movement fits the alternate count very well. I’m just back from some obligations and had just turned on my system.
In brief, Minor 2 of the main count has completed 1224.35 – 1192.71 – 1210.83 – 1184.06. The low 1184.06 can also be subminuette 3 in the alternate.
The height of the rebound can shed some light on which count is correct. For the main, a large rise is indicated as this is Minor 3. In the alternate, a very much smaller rise is in the cards.
Tham you were right about gold dropping. Ouch glad I only bought a little GDX due to these indecisive times.
Watching this channel and inverse H&S. If it holds, I think 1266 could be in the cards in 10 days. http://bit.ly/1O8Klol
If not, I will probably bail unless GDX somehow holds support.
Mark there is a much bigger H&S formation in play that should be recognised. The whole of the inverse H&S you show here sits in Right Shoulder. I may be wrong but IF correct we have huge downside to come.
Yes, I’m aware of that one too. Gold didn’t do what I expected last night and I will likely bail on long without a hard bounce from here.
side ways movement for last 3 hours
But poor results in March didn’t help gold.
one of many FMOC indicators for raising the rate. disappointing numbers cout mean Sept. vs June hike?
severe winter weather, an economic speed bump and merchandise delays resulting from the West Coast port disruptions dragged down results, leading to the month’s sales gains falling below views.
Read more: http://www.nasdaq.com/article/march-retail-sales-stung-by-weather-economy-slowing-cm463767#ixzz3XF8Kc0WY
March Retail Sales 0630 Eastern
Syed – Can you substantiate that reasoning through Elliott Wave count?
Hi. I am too new to E/W to be able to figure out what wave count Gold price is in. The analysis here though helps guide me through my trades.
Expecting pullback / short term decline from within 1205-07 for a break below 1198/96 to possibly take out 1193.36
it is a clear 3rd wave if you do the fibonacci extension of the previous two wave counts
This is certainly an interesting juncture . Once I again I don’t feel totally convinced by the count but we are also at the point where doesn’t seem to be any alternative for the bullish count . This will be very interesting .
In next 24 hours or within that period, the first target to hit is 1217
Following the H&S formation here and favoring the alternative.
I only see an inverse H&S on the gold futures which is what Lara tracks and has more merit IMO. I see a H&S on the GLD chart, but it’s really not because there are not 2 touches on the neckline to form the head. Also, studies have shown H&S are more reliable at tops than at bottoms or midway points. Can you post the H&S you are seeing?
I would also like to see it , ty .
GDX chart
GDX Weekly
I see it the same way. And the 20ema is at 19.16 which is still providing support. I’m positioned very long GDX right now but won’t hesitate to pull the plug if 19.16-19.18 levels stop providing support.
The 24 hour Gold countdown begins.
Above 1,210.88 is strong up in Main Daily wave.
Volume favours the bullish wave count.
Below 1,193.11 is strong down in Alternate Daily wave.
If the next up day shows lower volume this wave count would be supported.
The Battle of the Red Bull and the Grizzly Bear begins.
Richard, as I read this, below 1193 invalidates main hourly but below 1178 is needed to support daily alternate. Which means 1193 to 1178 is “no man’s land” of indecision.
Maybe I am wrong–would like your opinion.
For a move all the way down to 1178 to still support the “bull” count, you would likely need to see minor 2 (blue) continuing. I think that would make minor 2 too long and would no longer have the right look.
Bob B, thanks that helps, I’m trying to preplan, if I wake up in the morning and gold is at 1188 what do I do? It’s an unclear area.
davey
If gold drops below 1193.11 then hourly wave count is invalid and main daily wave count is still valid, however Lara did advise in a comment today,
“If price breaks below 1,193.11 the main wave count is in trouble. The alternate is still viable (although it has a low probability). If the alternate is correct this is right where it should move price strongly lower.
So the two daily wave counts now strongly diverge; main expects a third
wave up, alternate expects a third wave down. Price will tell us this week
which one is correct.
If that lower blue trend line is breached on the daily chart I’d be very
concerned for that main wave count. I’d be using that trend line for support.”
Thanks Richard