
A strong upwards movement fits one of the three hourly Elliott wave counts from yesterday. The next 24 hours should tell us which Elliott wave count is correct.
Summary: My main wave count expects a third wave has just begun, which is supported by volume and momentum. The target for it to end is 1,303 which may be met in 12 more days, and along the way there should be two corrections which show up on the daily chart. In the short term a clear five up on the hourly chart would add confidence to the main wave count and invalidate the alternate hourly wave count, which today has a low probability. The daily alternate wave count has further decreased in probability.
Click on charts to enlarge.
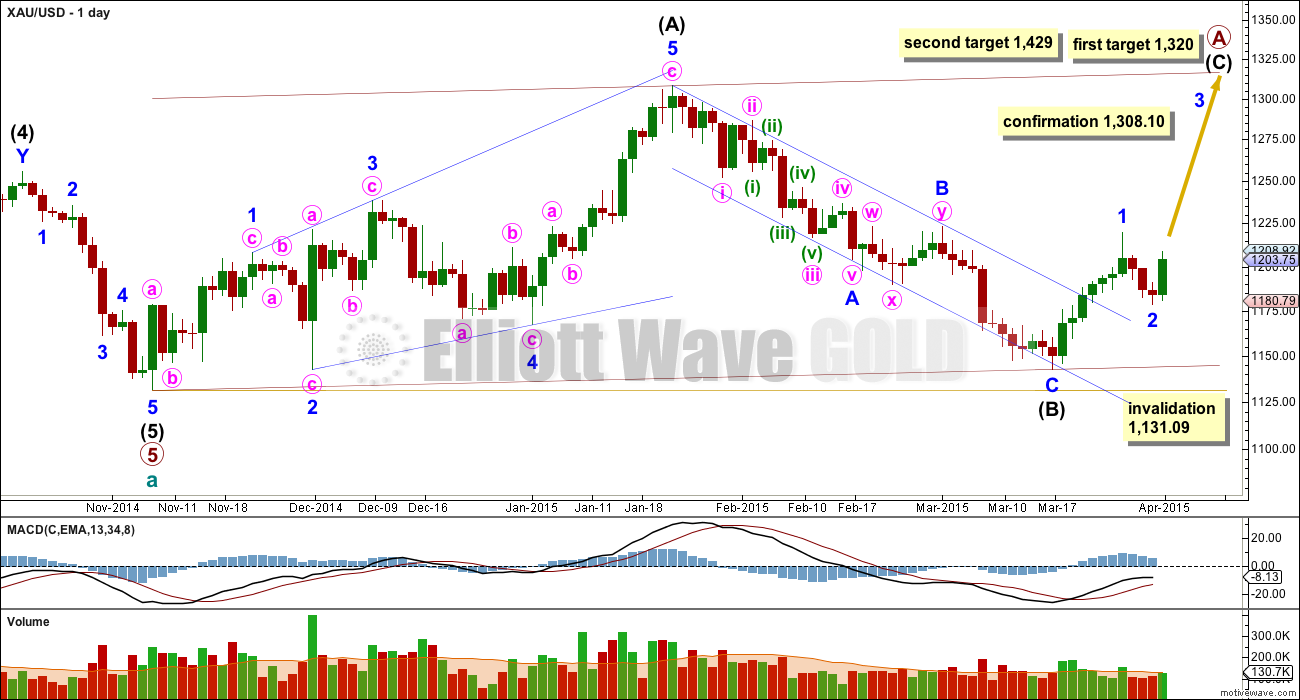
Main Daily Wave Count
There are more than thirteen possible corrective structures that cycle wave b may take. At this stage it is unclear what degree to label this big movement. Primary wave A (or W) may be an incomplete zigzag.
Cycle wave b may be a flat correction where primary wave A is a zigzag. Cycle wave b may be a triangle where primary wave A is a zigzag. Cycle wave b may be a combination where primary wave W is a zigzag. Cycle wave b may be a double zigzag with the first in the double, primary wave W, incomplete.
When the big zigzag now labelled primary wave A is complete it is also possible that cycle wave b could be over there with the degree of labelling within it moved up one degree.
A new high above 1,308.10 would invalidate the alternate and confirm this main wave count at primary and cycle degree.
The upwards wave labelled intermediate wave (A) fits only as a five wave structure, a leading expanding diagonal. Within a leading diagonal the first, third and fifth waves are most commonly zigzags, and the fourth wave should overlap first wave price territory.
Because intermediate wave (A) subdivides as a five, intermediate wave (B) may not move beyond its start below 1,131.09.
At 1,320 intermediate wave (C) would reach equality in length with intermediate wave (A). This would complete a 5-3-5 zigzag trending upwards. At that stage alternate wave counts would be required to manage the various possibilities for cycle wave b.
At 1,429 intermediate wave (C) would reach 1.618 the length of intermediate wave (A).
Because intermediate wave (A) is a diagonal then it is highly likely intermediate wave (C) will be an impulse in order to exhibit alternation. Intermediate wave (C) may end about the upper edge of the channel drawn about primary wave A.
This wave count sill has problems of structure within primary wave 5 of cycle wave a:
– within primary wave 5 intermediate wave (2) is a running flat with its C wave looking like a three and not a five.
– within intermediate wave (5) the count is seven which is corrective; either minor wave 3 or 5 will look like a three wave structure on the daily chart where they should be fives.
It is for these reasons that I will retain the alternate until price confirms finally which wave count is correct and which is invalidated.
Wednesday’s candlestick completes a bullish engulfing pattern. This is the strongest bullish candlestick pattern and supports the main hourly wave count.
Volume for downwards movement of minor wave 2 is lower than the prior upwards movement of minor wave 1. Importantly, Wednesday’s session sees volume increase beyond that seen for the prior three downwards days, which supports the main hourly wave count.
Minor wave 1 lasted seven days (no Fibonacci number) and minor wave 2 is now most likely over lasting a Fibonacci three days. If minor wave 3 exhibits a Fibonacci duration it may last thirteen days, which would see it end in twelve more sessions (depends on how long the corrections within it last).
Main Hourly Wave Count
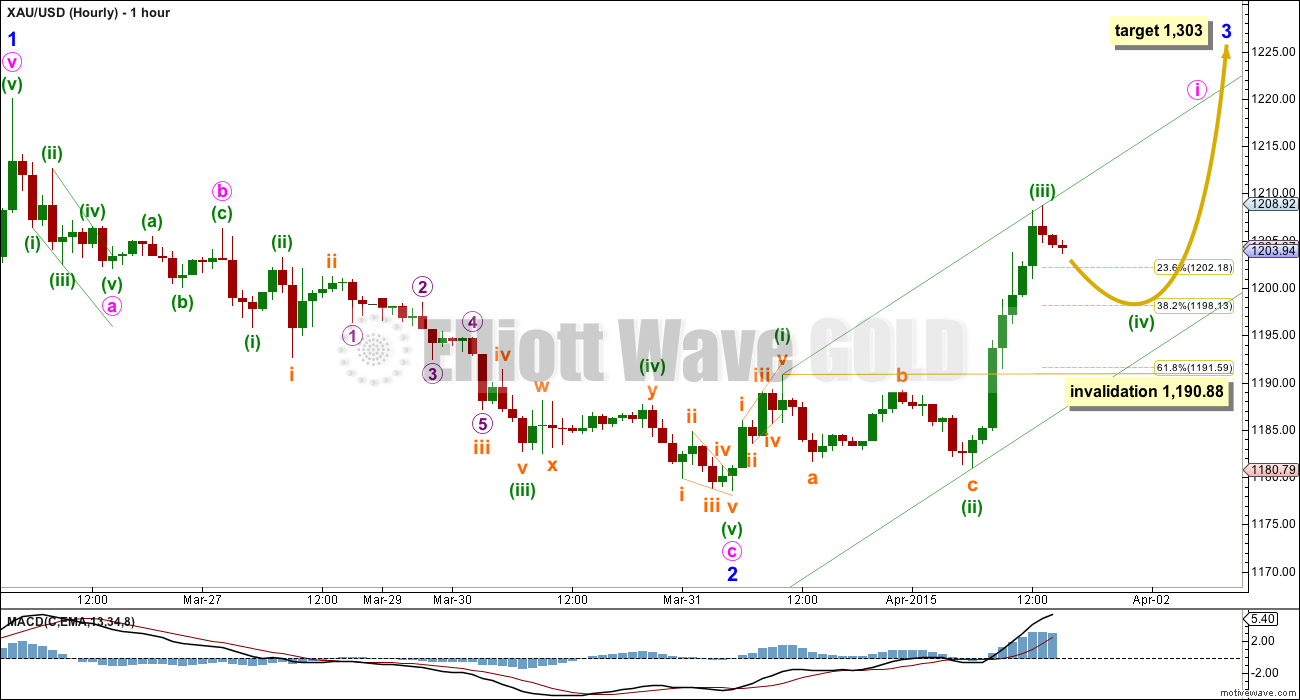
This is the main wave count and has a higher probability today. It is supported by an increase in volume on the daily chart and a strong increase in momentum here on the hourly chart.
To have full confidence in this wave count a clear five wave structure upwards must be seen. So far only minuette waves (i), (ii) and (iii) are complete. There is no Fibonacci ratio between minuette waves (i) and (iii) which makes it more likely that minuette wave (v) will exhibit a Fibonacci ratio to either of (i) or (iii). Equality with minuette wave (i) at 12.29 would be most likely, and 0.618 the length of minuette wave (iii) at 17.13 would be next likely.
Minuette wave (ii) was a very deep 0.8 zigzag. Minuette wave (iv) should exhibit alternation so is most likely to be a shallow flat, triangle or combination. It is most likely to end about the 0.382 Fibonacci ratio at 1,198. If it unfolds as an expanded flat, running triangle or combination then it may include a new high above its start at 1,208.72 while it unfolds. It that happens the alternate wave count below may be discarded.
When minuette wave (iv) is complete a final wave up for minuette wave (v) would complete a clear five up on the hourly chart. That would provide full confidence in this main wave count and invalidation of the alternate below.
Minuette wave (ii) lasted 19 hours but does not show on the daily chart. Minuette wave (iv) is extremely likely to be over within 24 hours and should not show up on the daily chart. I expect to see another green candlestick for Thursday’s session.
Minuette wave (iv) may not move into minuette wave (i) price territory below 1,190.88.
Alternate Hourly Wave Count
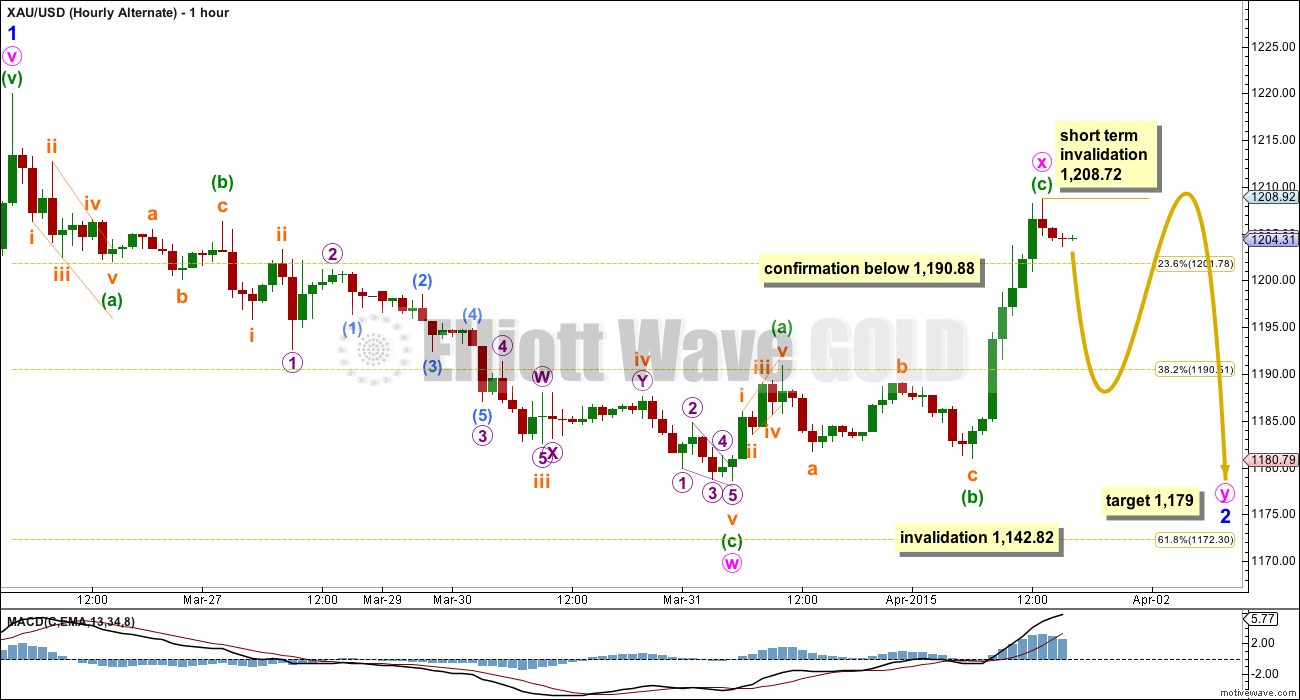
It is possible that minor wave 2 may continue sideways as a double combination, but this wave count is not supported by volume or momentum.
Yesterday’s multiple wave count (which was named Hourly 3 in yesterday’s analysis) looked at the possibility of a double zigzag. Double zigzags normally, almost always, have shallow X waves in order to achieve their purpose of deepening a correction. Double zigzags have a clear slope against the main trend.
Double combinations are a different type of structure, they are sideways movements. Their purpose is different, to take up time. To achieve this purpose a double combination normally has a deep X wave which is most often a zigzag. Within a double combination the X wave may make a new price extreme beyond the start of the first structure in the combination. The second structure in a double combination normally ends close to the same level as the first.
It is still possible that minor wave 2 may continue and last a Fibonacci eight days in total. This has a very low probability, but we should consider all possibilities.
Minor wave 2 may be a double combination with a typically deep X wave which would now be complete. The second structure for minute wave y may be either a flat or a triangle. The first downwards movement within it may not make a new high beyond its start above 1,208.72 in the very short term. For this alternate the short term invalidation point will probably only apply for the next 24 hours. If minute wave y is an expanded flat or running triangle then it may include a new high above 1,208.72, but only after wave A within it is complete.
Minute wave y is most likely to end about the same level as minute wave w at 1,179 to achieve the purpose of a sideways correction.
Minor wave 2 may not move beyond the start of minor wave 1 below 1,142.82.
If price moves below 1,190.88 in the next 24 hours the main hourly wave count would be invalidated and this alternate would be confirmed.
Alternate Daily Wave Count
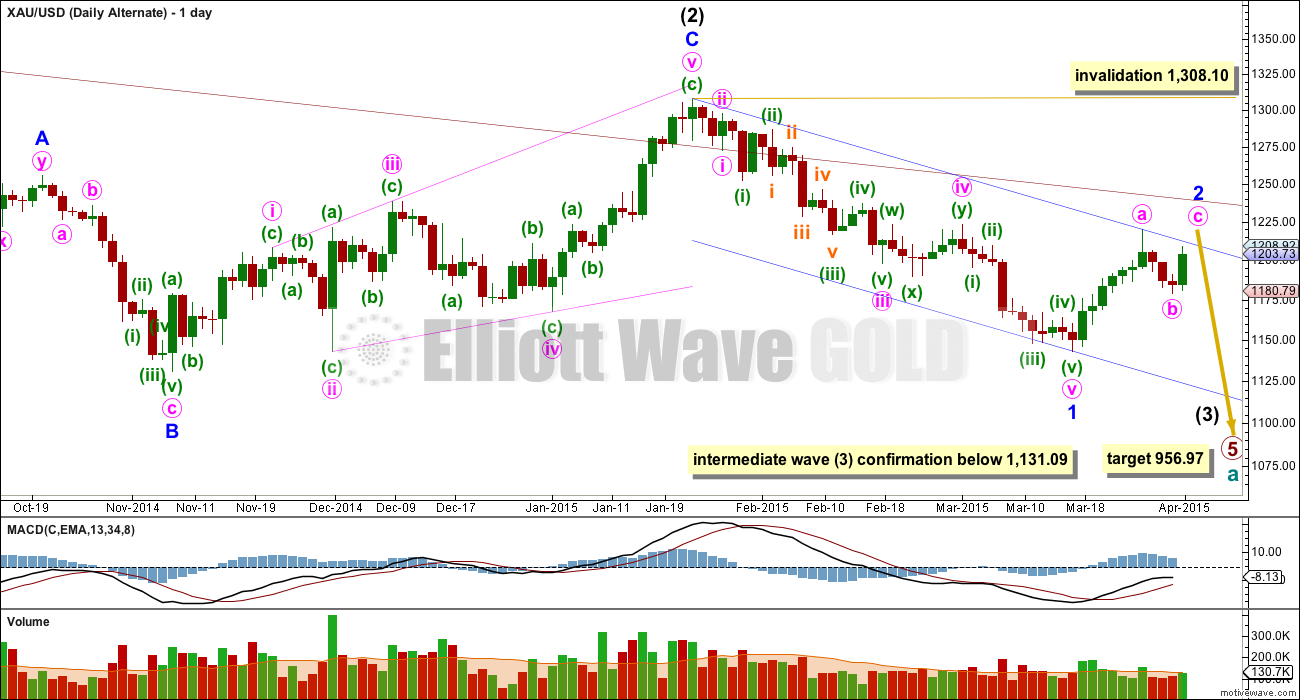
This alternate wave count sees Gold as still within a primary degree downwards trend, and within primary wave 5 intermediate wave (3) has begun.
At 956.97 primary wave 5 would reach equality in length with primary wave 1. Primary wave 5 may last a total Fibonacci 55 weeks. So far it is now in its 37th week.
The maroon channel about cycle wave a from the weekly chart is now breached by a few daily candlesticks and one weekly candlestick. If cycle wave a is incomplete this channel should not be breached. The breach of this channel was the first warning this wave count may be wrong.
This wave count still has a better fit in terms of better Fibonacci ratios, better subdivisions and more common structures within primary wave 5, in comparison to the main wave count above.
Within intermediate wave (3) minor wave 1 is a long extension. Within minor wave 1 minute waves iv and ii are grossly disproportionate, with minute wave iv more than 13 times the duration of minute wave i. This also reduces the probability of this wave count.
Although the invalidation point is at 1,308.10, this alternate wave count should be discarded long before that price point is reached. If the maroon channel is breached again by one full daily candlestick above it and not touching it then I would discard this alternate wave count.
A new low below 1,131.09 would confirm that intermediate wave (3) down is underway.
I will allow for the possibility that minor wave 2 may be completing as a big zigzag, but the duration is longer than minor degree corrections normally are so the probability of this idea is very low. The probability of this alternate wave count has further reduced today.
This wave count now needs to prove itself. It needs to show strong downwards movement with an increase in momentum and an increase in volume. A new high above 1,219.99 would further reduce the probability of this alternate at this stage, I may discard it at that point.
This alternate wave count remains technically possible.
This analysis is published about 04:35 p.m. EST.
Might get that green candlestick after all…
My charts were giving me mixed signals too so when in doubt I go to cash. Plus, unless I feel really confident, I don’t want to trade against Lara’s signals as her main count seems spot on right now I think.
maybe Lara took off for the long weekend already…
No, but I did sleep in.
It looks like the fourth wave is over. My target for minute wave i to end is at 1,212. I expect upwards movement from here.
The alternate is also still viable (but with a very low probability). It too needs upwards movement from here to a minimum 1,207
Is it still possible that the 4th wave can move lower and still be in the main wave count?
Yes, but I would judge it to be extremely unlikely. Its already longer in duration than minuette wave (ii), so if it’s over here the proportions look pretty good. If it continues it will look disproportionate.
U.S. Employment Data To Drive Gold Next Week – Analysts -http://www.kitco.com/news/2015-04-02/US-Employment-Data-To-Drive-Gold-Next-Week.html
If GDX doesn’t fall any further than 18.82 by the close, I will close out my DUST and just sit in cash over the weekend. That would be supportive of a bullish flag forming. http://scharts.co/19NsLsw
Took profits on my DUST. Holding no gold-related positions over the weekend but did buy back UWTI as I love the chart right now.
US pres. just spoke about supporting peaceful policy and working with Iran on peaceful nuclear power program. Might be why gold pulled back a tad. Silver gave up almost all of yesterday’s gains. Miners started heading back down after the speech…is it enough to make the alternate hourly count more valid?
Lara is gold now in minuette wave (v) up with the two possible upper targets 12.29 and 17.13 in length and gold still bullish for the weekend?
Do you still think gold will close with a green candlestick today?
Yes. My target is 1,212.
The alternate also would require upwards movement to a minimum 1,207
It hasn’t quite managed a green candlestick though
Hi Lara,
If possible, can we get an early analysis for the long weekend….
Ty, Scott
Is nugt in a third wave up? Target 12.95???
Papudi–about blogger and cycle dates you posted below.
Cycle theories are interesting, but do they work? What is the blogger’s record of correct calls?
There is one other reason for my keeping it short with upside risk 100dma/50dma… 50dma is dropping and I expect it to drop and cross over below 100dma in another few days which will not be a bullish crossover; gold price ought to then take a nice drop to hopefully take out 1173!
Anyone else with balls of titanium shorting right now?
Ive been short since yesterday…ie long DUST.
I am back in long JNUG.
In DUST still – seeing where this goes.
Yes, DUST is a better risk/reward play right now that NUGT for sure. It’s trading at pretty solid support and it’s easy to place your stop on a move below my blue trendline. http://scharts.co/19MTQML
15-min DUST chart looks very solid too. http://scharts.co/1EEEp6P
I saw DUST as solid for awhile this morning. However I believe it would be a risky trade as gold forecast to now be in a minuette wave (v) with a move up $12.29 or $17.13 in length. Long weekend trade with a 3X ETF and US jobs data Friday with NYSE closed is not a sure bet. I would be more inclined to buy some GDX and hold over the weekend as it is not a 3X and it is in the direction of Lara’s forecast and the main wave is playing out so far today and ADP report yesterday moved gold up. Perhaps US jobs report may do the same?
I hear you but anytime I ever bet on resistance getting taken out I’m taken to the cleaners. Gold has lots of resistance immediately above and the GDX components can’t seem to trade to above their 20MAs. Take a look at gold backtest resistance. http://scharts.co/1IRnGvE
And look at GG as an example at the 20MA. This is not a bullish chart. http://scharts.co/1BIgLPH
US market traders will be getting out or flat today for long weekend. No one wants to be long or shorts in PM.
Has the channel been breached in the main hourly chart? I see the low has hit 1196.80 so far.
It appears to me that the hourly channel was breached at 10:00 am, however at 12:00 pm EST it would be 1 full hourly candlestick under channel if gold stays under 1200 until then. Lara didn’t mention anything about channel breach just the may not go below 1,190.88 invalidation point.
As of 12:00 noon I calculate hourly channel breached by 1 full hourly candlestick. Next hourly appears to be partly back inside the channel.
Thanks. I’m not sure how relevant it is as you point out.
Gold heading for 1,198 wave iv retrace now
I am watching 1190.88 and below????
Hello, I see that Lara’s main hourly count is in progress and that silver has dropped much more than gold so far.
Cycle dates by a blogger:
GOLD
Members who have read my recent comments would have noted that GOLD hit resistance on 31 Mar at the Fibonacci Number ratio 3/5 = 1178 and climbed to a HIGH on 01 Apr as I predicted some time ago.
GOLD would normally turn and move lower here making a….
LOW on 06 Apr (based on 72 month time count from 2009)
HIGH on 09 Apr
LOW on 14 Apr
“Inversion” is possible but I am pretty confident, from long time triangulation, that the 14 Apr will be a LOW
Will the 14 Apr be a directional turn date?
Remember TIME is the key to successful trading so whether it be GOLD or EQUITIES I hope these turn dates add a new dimension to your trading skills.
EQUITIES
As previously discussed the DOW will bottom shortly, maybe as early as the first trading day after the FULL MOON or maybe 07 Apr but remember there will be no respite (for some time) from this period where there is no trend (either up or down).
Gold has built a HnS bullish and bearish. If gold breaks above 1220 it is a bullish HnS. If gold held back at 1202 and moves lower and below NL 1141 it is a bearish HnS.
GDX Chart
With a high range close, upside price movement expecting for gold price today (and it appears to be strengthening) before reversing to encounter resistance at 100dma (1208-09) and 20weekMA (1210-11) notwithstanding the upper band. It appears that gold price is looking to top soon. Hope it does! Upside risk comes in at 1254-55.
If spot gold can get a close above $1,205 I think gold will be off to the races. Perhaps all it needs is a shallow correction as Lara has mapped out over the next day or so. Clearly it is at resistance at current levels. If the correction looks shallow, I will be ditching my DUST and preparing to get long. http://scharts.co/1EGIoQh