I still have four Elliott wave counts for you, with altered hourly charts. The short term expected at least some downwards movement for all four wave counts, which is what happened, but only after a very slight new high was made.
Summary: Gold remains in a sideways consolidation phase which began on March 27th. Since price entered the consolidation phase the strongest volume is on down days, indicating that when the breakout comes it may be more likely to be down than up. Volume continues to decline, which often happens towards the end of a consolidation phase. However, the Elliott wave picture remains unclear.
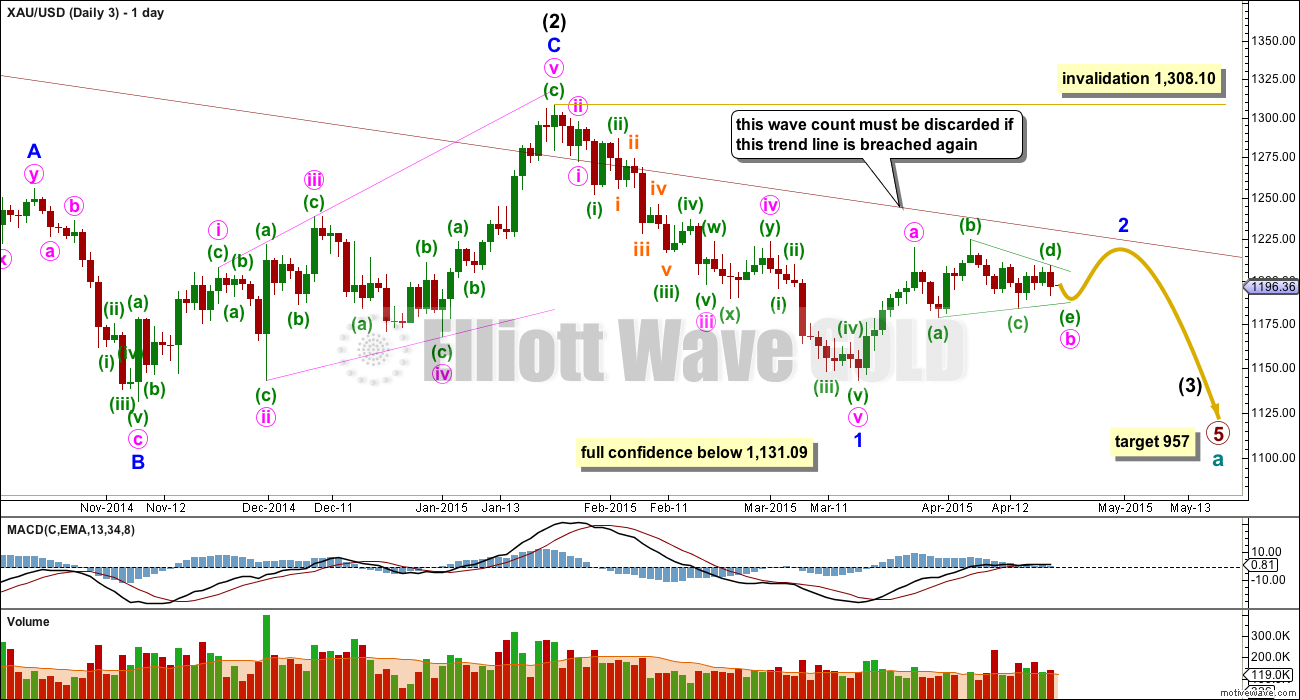
A new high above 1,224.35 is no longer final confirmation that the breakout is upwards, but it would substantially increase the probability of an upwards breakout. The maroon channel on the bear wave count must differentiate the bull and bear wave counts now. If that trend line is breached the bear wave counts should be discarded, and that would provide confidence in the bull wave count.
A new low below 1,184.04 would be a very strong indicator that the breakout is downwards.
Click on charts to enlarge.
To see weekly charts for bull and bear wave counts go here. Wave counts 1 and 2 follow the weekly bull count, wave counts 3 and 4 follow the weekly bear count.
Wave Count #1
So far within cycle wave b there is a 5-3 and an incomplete 5 up. This may be intermediate waves (A)-(B)-(C) for a zigzag for primary wave A, or may also be intermediate waves (1)-(2)-(3) for an impulse for primary wave A. Within cycle wave b primary wave A may be either a three or a five wave structure.
Intermediate wave (A) subdivides only as a five. I cannot see a solution where this movement subdivides as a three and meets all Elliott wave rules. This means that intermediate wave (B) may not move beyond the start of intermediate wave (A) below 1,131.09. Intermediate wave (B) is a complete zigzag. Because intermediate wave (A) was a leading diagonal it is likely that intermediate wave (C) will subdivide as an impulse to exhibit structural alternation. If this intermediate wave up is intermediate wave (3) it may only subdivide as an impulse.
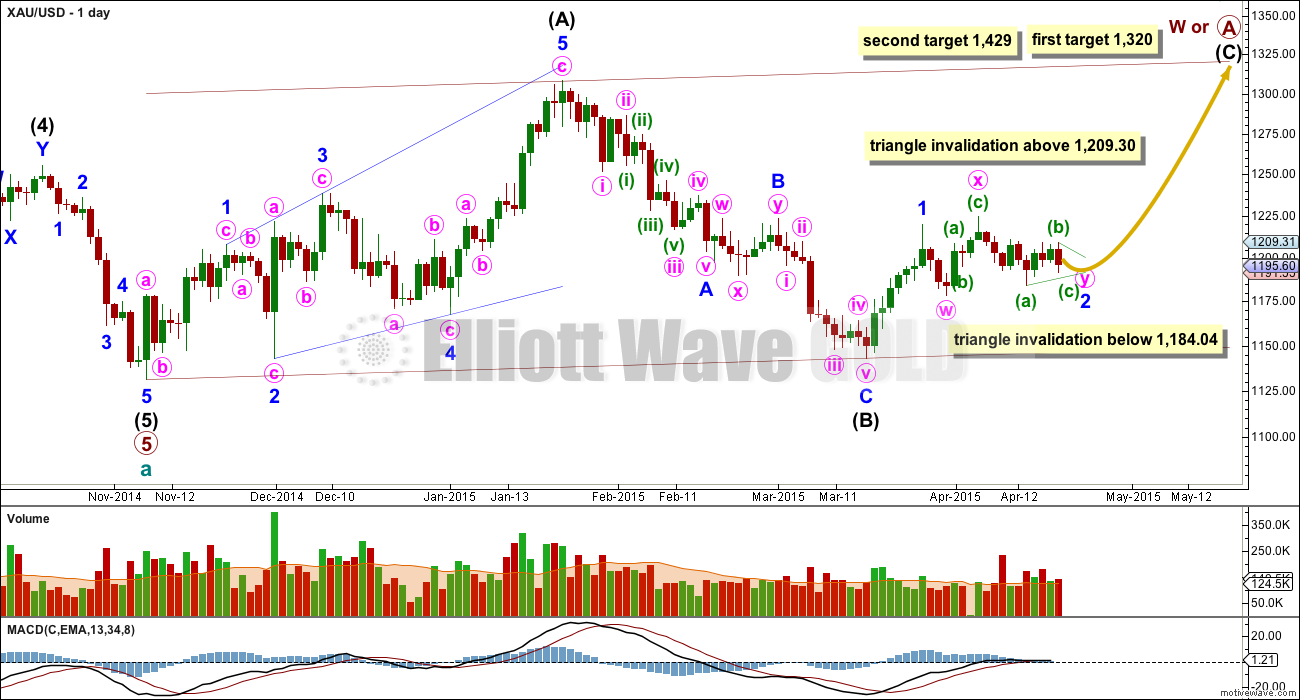
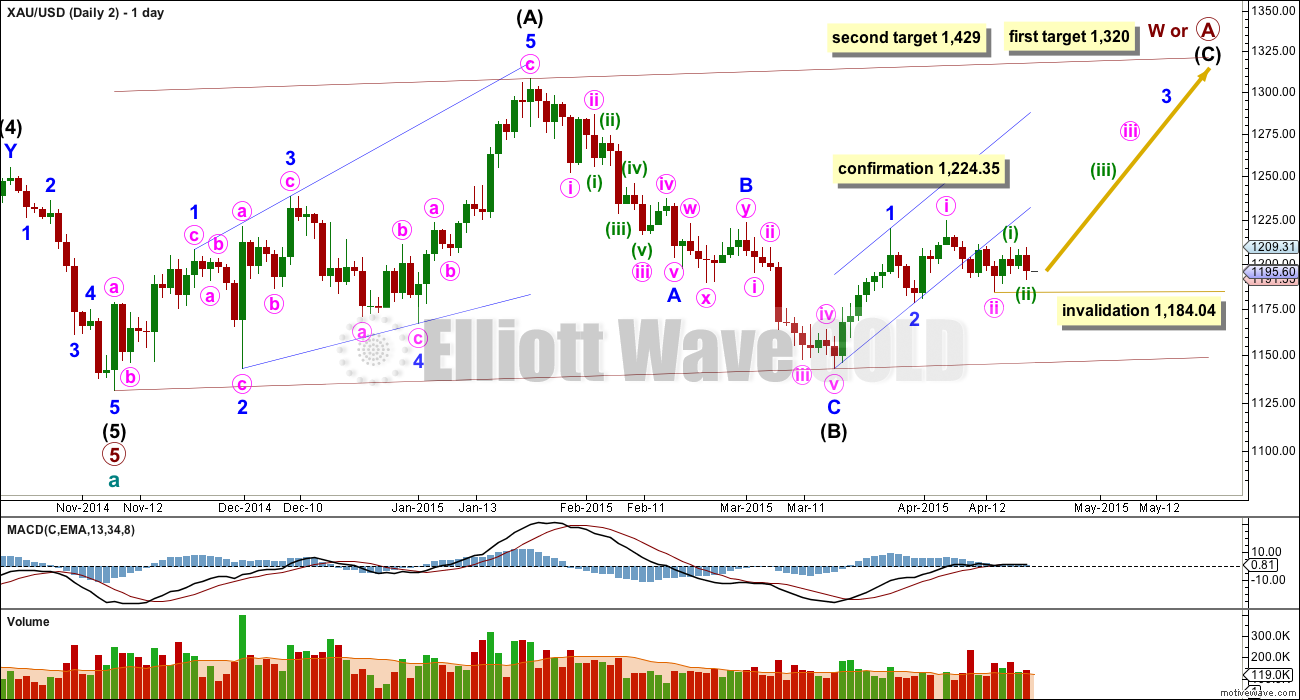
At 1,320 intermediate wave (C) would reach equality in length with intermediate wave (A), and would probably end at the upper edge of the maroon channel. At 1,429 intermediate wave (C) or (3) would reach 1.618 the length of intermediate wave (A) or (1). If this target is met it would most likely be by a third wave and primary wave A would most likely be subdividing as a five wave impulse.
Within intermediate wave (C) minor wave 2 is today adjusted. It is now seen as a double combination: zigzag – X – triangle. The triangle for minute wave y would be about only halfway through.
Pros:
1. Combinations are reasonably common structures.
2. On the daily chart MACD is hovering at zero. This sideways chop of the last few days does look like a possible triangle.
3. The upwards wave labelled minute wave x does look like a three on the daily chart.
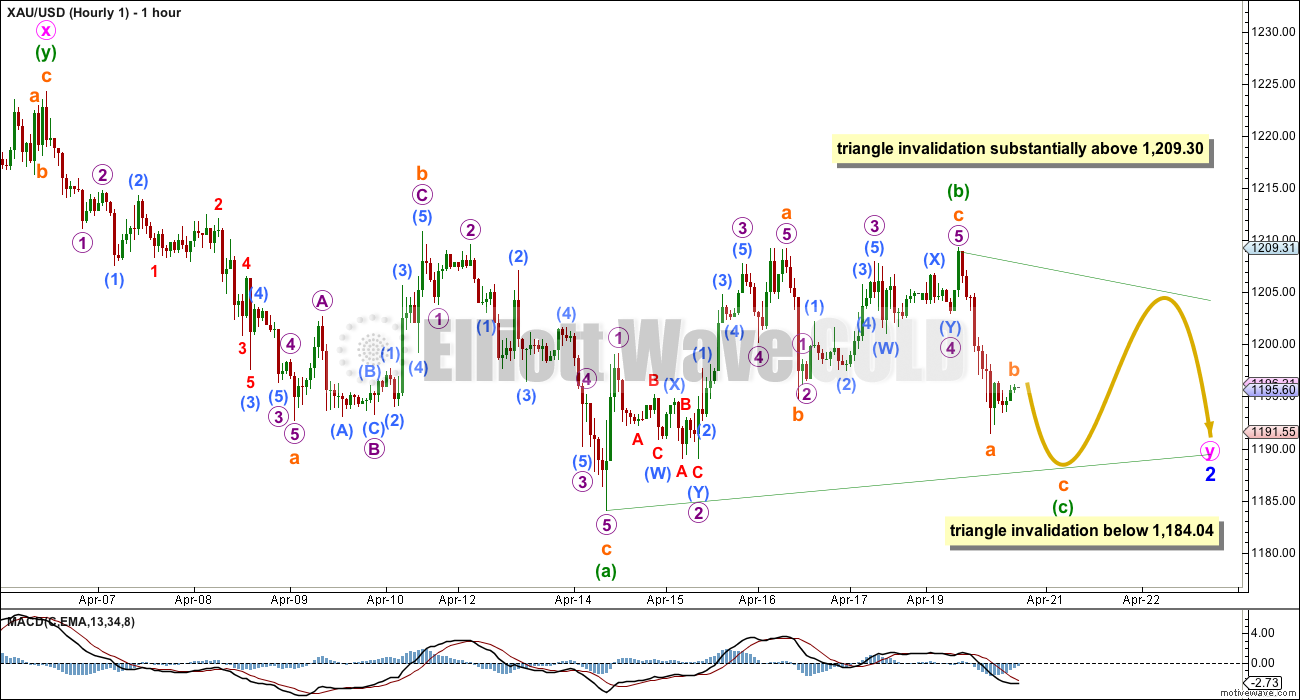
Within the triangle of minute wave y minuette wave (c) may not move beyond the end of minuette wave (a) below 1,184.04.
If minute wave y is a contracting triangle then minuette wave (d) may not move beyond the end of minuette wave (b) above 1,209.30.
If minute wave y is a barrier triangle then minuette wave (d) should end about the same level as minuette wave (b) at 1,209.30, as long as the (b)-(d) trend line is essentially flat. In practice this means that minuette wave (d) may end slightly above 1,209.30. This is the only Elliott wave rule which is not black and white.
For this wave count 1 I would expect sideways choppy movement for much of this week. The breakout would be expected to be upwards.
The hourly charts will all show movement since the high at 1,224.35.
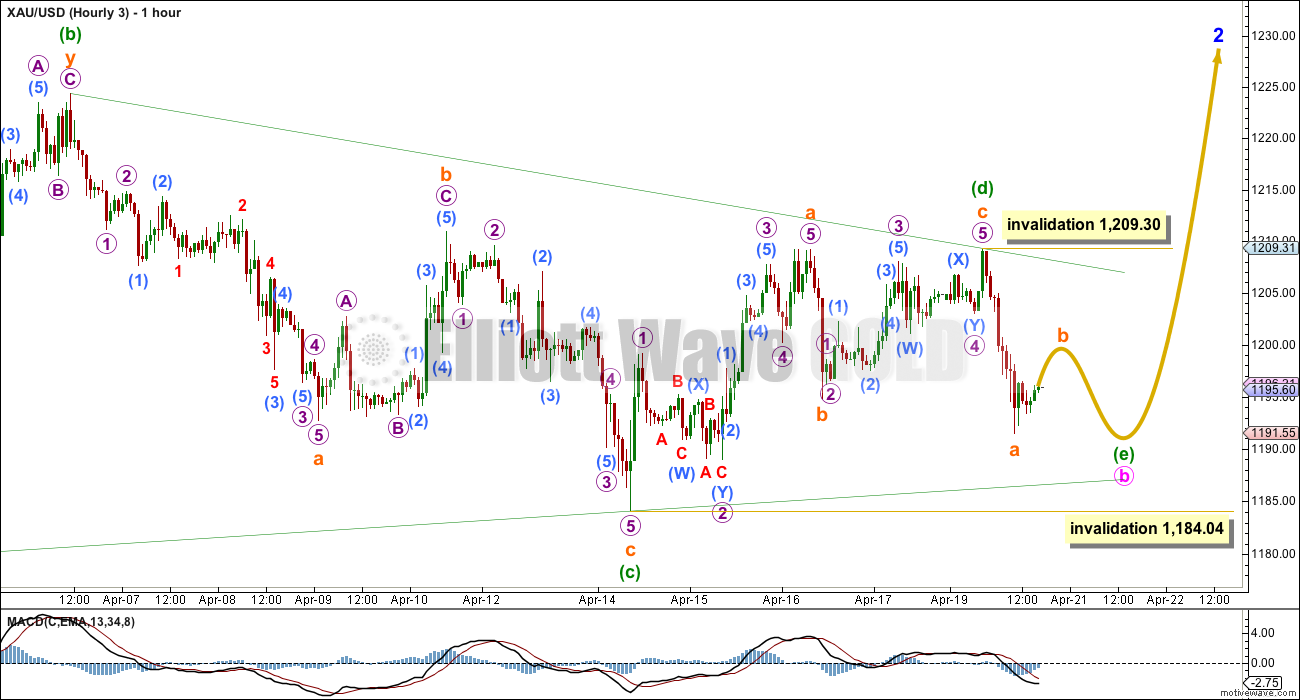
This first wave count sees all this movement as a regular contracting or regular barrier triangle. Only waves (a) and (b) are complete, and both subdivide best as single zigzags. This means that one of the remaining sub waves should subdivide into a more complicated and time consuming double, or possibly a triangle to complete a nine wave triangle.
The final wave of the triangle for minuette wave (e) would be most likely to undershoot the (a)-(c) trend line, and less likely to overshoot the (a)-(c) trend line.
Wave Count #2
This wave count is identical to wave count #1 up to the high labelled minor wave 1. Thereafter, instead of minor wave 2 continuing it sees minor wave 2 as complete, within minor wave 3 minute waves i and ii complete, and now within minute wave iii minuette waves (i) and (ii) are also complete.
Pros:
1. Minute wave ii looks like a clear three wave movement now on the daily chart.
2. Minor wave 3 should show its corrections for minute waves ii and iv clearly on the daily chart.
Cons:
1. Minute wave ii clearly and strongly breaches the lower edge of a base channel drawn about minor waves 1 and 2, one degree higher.
2. Minute wave ii is twice the duration of minor wave 2 one degree higher.
3. The upwards wave of minute wave i looks like a three on the daily chart, but it should be a five.
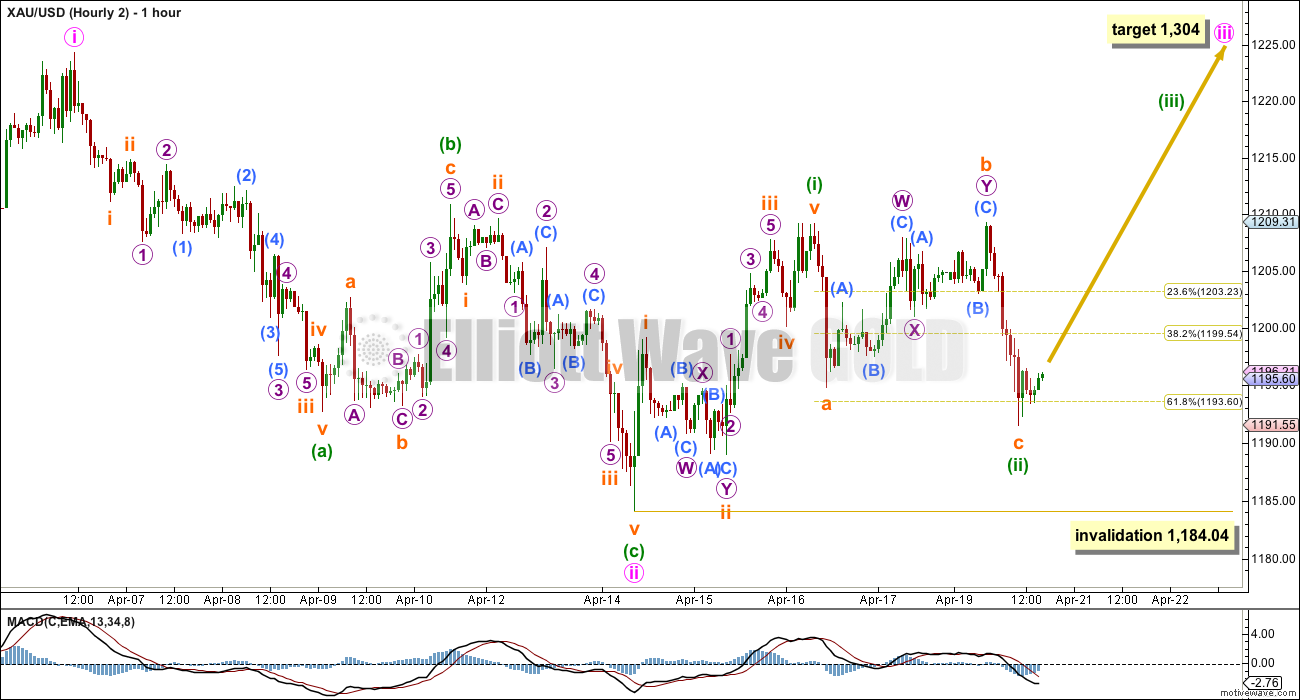
Within minute wave iii no second wave correction may move beyond its start below 1,184.04.
Minuette wave (ii) may have completed as a regular flat correction. Within it there is no Fibonacci ratio between subminuette waves a and c.
At 1,304 minute wave iii would reach 1.618 the length of minute wave i.
If minuette wave (ii) continues further sideways as a double flat it may not move beyond the end of minuette wave (i) below 1,184.04.
Wave Count #3
This wave count follows the bear weekly count which sees primary wave 5 within cycle wave a as incomplete. At 957 primary wave 5 would reach equality in length with primary wave 1.
This wave count is today adjusted to see minor wave 2 as an incomplete zigzag, and within minute wave b a close to complete running contracting triangle (Bob’s idea).
When the triangle is complete then the zigzag for minor wave 2 should end with a small wave up for minute wave c. It should find strong resistance at the upper edge of the maroon channel copied over here from the weekly chart. If this maroon trend line is breached again by a full daily candlestick above it and not touching the maroon trend line then this bear wave count should be discarded.
Pros:
1. The upwards waves of minuette waves (b) and (d) do look like threes on the daily chart. A triangle nicely explains the sideways chop of the last 17 days.
2. MACD supports the idea of a triangle unfolding as it is hovering at the zero line on the daily chart.
Cons:
1. Minor wave 2 would be much longer in duration than a minor degree second wave normally is for gold.
The triangle of minute wave b may be almost complete and may end within the next 24 hours. Thereafter, an upwards breakout for minute wave c would be extremely likely to move price at least slightly above the end of minute wave a at 1,219.99 to avoid a truncation. Minute wave c may be 0.618 the length of minute wave a at 48 in length.
Minor wave 2 may not move beyond the start of minor wave 1 above 1,308.10.
Within the triangle one of the sub waves is already a more time consuming complicated double, so the final wave of minuette wave (e) is likely to be a simple zigzag.
Within the final zigzag of minuette wave (e) subminuette wave b may not move beyond the start of subminuette wave a above 1,209.30.
Minuette wave (e) may not move beyond the end of minuette wave (c) below 1,184.07.
Minuette wave (e) would be most likely to undershoot the (a)-(c) trend line, but it may also overshoot the (a)-(c) trend line.
Wave Count #4
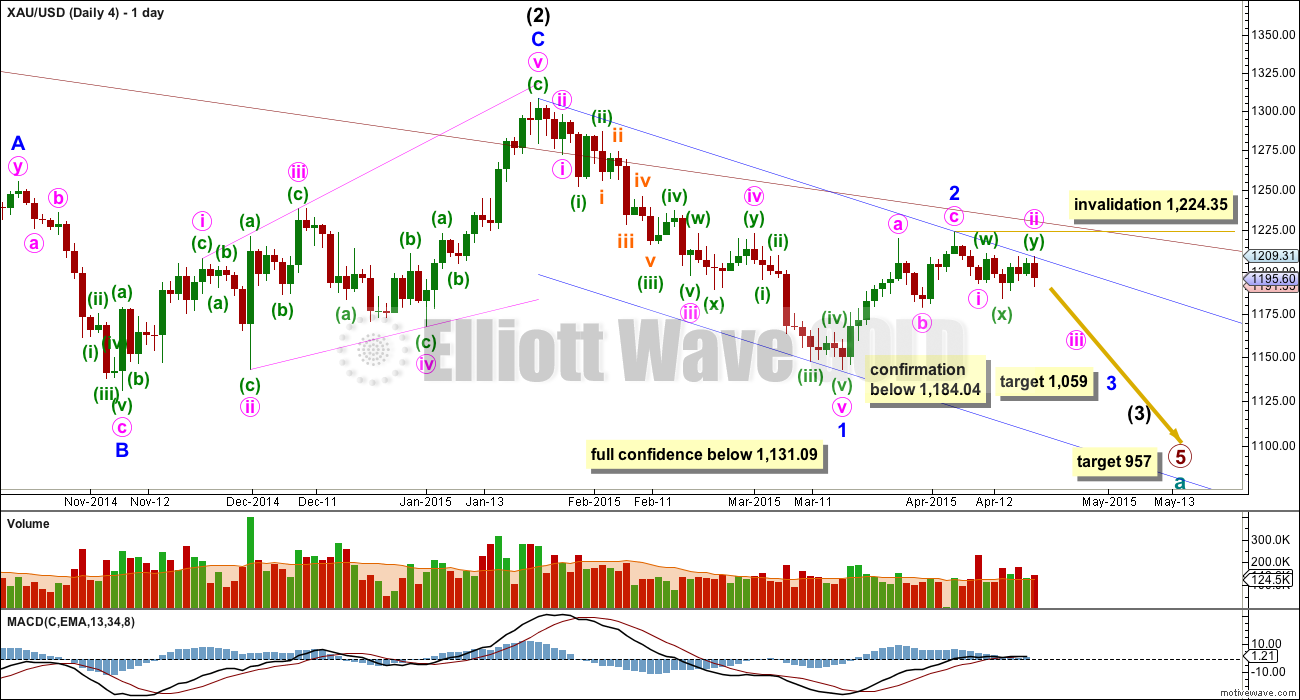
This wave count is identical to wave count 3 up to the low labelled minor wave 1. Thereafter, it still sees minor wave 2 as a completed zigzag, and minor wave 3 in its very early stages.
Minute wave ii is now seen as a completed double combination, and this neatly resolves the problem (which was only slight) of a rare running flat.
Pros:
1. The proportion of minute wave ii still looks right.
2. Upwards movement for Monday absolutely perfectly found resistance at the upper edge of the blue base channel.
3. It is very common for a third wave to begin with a series of overlapping first and second waves.
At 1,059 minor wave 3 would reach equality in length with minor wave 1.
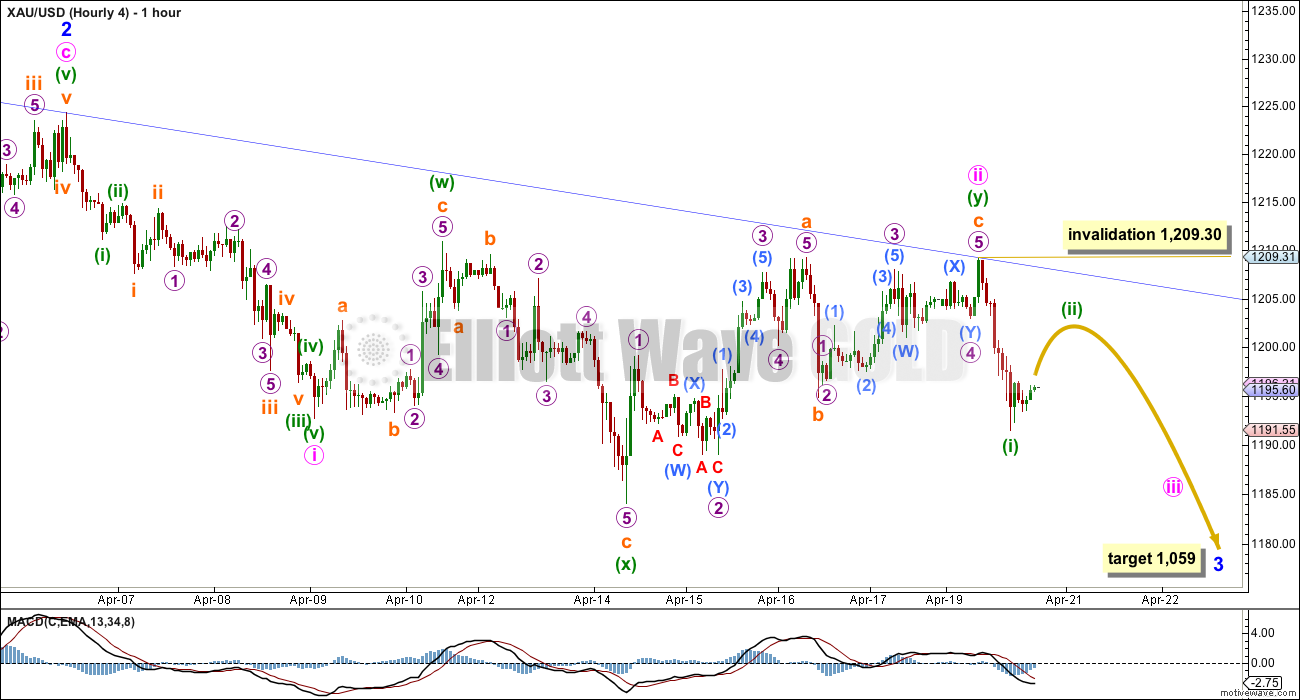
Minute wave ii subdivides perfectly as a double combination: flat – x – zigzag. Combinations are very common structures, and their purpose is to take up time and move price sideways.
The blue base channel is copied over to the hourly chart. Upwards movement perfectly ends when price touched this trend line.
This wave count now expects the middle of a third wave to begin to develop an increase in downwards momentum. The downwards breakout should be imminent. A new low below 1,184.04 would now provide a reasonable amount of confidence in this wave count.
If I had to pick a winner it would still be wave count 4. However, it has too many problems for me to have confidence in it. I would wait for price to indicate which count is correct.
This analysis is published about 06:33 p.m. EST.

Looking at the GLD charts, if it gets over 115.75 it could be off to the races. Trading gold right now just looks like so much of a gamble….I think Lara stated it very well last night….trading something within a trend is so much easier.
If anything, it’s trending up at the moment in the context of this channel that I showed this morning. The only times I would have considered taking a position long or short would have been at channel touches. Like I said, this morning was a rare no-brainer lately to have gone long gold.
I still favour scenario #4. This sideways wave 2 action reminds me of ~July 15th to Aug 15th when gold moved sideways for a month before finally resolving to the downside. I do find it unsettling that gold now hovers above the intraday downtrend
based on todays movement I take it scenario #1 is most likely?
No, all four are in play and not resolved yet (see my “blog” below for a play by play running commentary).
I’m short gld with gold at 1203…stop near 1206, looking for 1195 area…
You are quite accurate. If this is Bull wave #2, then it will drop to 1198.54, worst case 1194.94. Bull waves #1 and #3 can drop to a value that is slightly higher than 1184.04. Wave #4 is more contorted.
If it does go down below 1200, I will move up my stop…it would be a gain regardless of the wave at that point…
Lessening my sell target, tightening up my stop…want to exit this position before market close…gold isn’t cooperating…
Out, tiny gain…I expect a further drop, but I’m done for the day…good luck everyone!
You must be trading Futures contract or Options????
Suggest you think this through; a pop above 1204 is likely to break above 1207-08….
That’s what the stop is for…im OK with a small loss…I’ll be out automatically…
Other indicators to me also, silver did not bounce as strongly as gold and copper is negative for the day…but you’re right, it is a risky gamble…
Just as suspected, gold bounced on the TL and the GDX flags are breaking out.
Excellent work Mark. Let’s see how it goes
Thanks Eli. GDX seems so much easier to trade right now than gold. It’s in such a steady and predictable uptrend.
Personally I tend to watch and take cues from GDX and GDXJ, since they generally do lead the metals. Also, i trade weekly options and they are pretty liquid in GLD (GDX not so much).
Gold & Silver Trading Alert: Silver Stocks’ Signal (Bearish)
Monday, 20 April 2015
http://news.goldseek.com/GoldSeek/1429545600.php#disqus_thread
Great article says go short half position – all bearish gold, silver, miners, and ratios gold/silver, gold/oil.
Tough call: With 1197 holding, a pop through 1201-04 required seeking 1208; a break below 1195/94 required to seek a break below 1191….
Price today reached a high of 1202.39. It dropped to 1194.94 and is now rising again. From my analysis of price movement, I consider this rise the first interesting sign.
In order for the bulls to continue their run a la bull wave count #2, price must rise higher than 1202.39. If it reverses before 1202.39, this, to me, is the first serious sign that bull wave count #2 is going to run into strong headwinds, with a very good chance of being invalidated.
If price rises higher than 1202.39, then the other wave counts will need to be monitored carefully. Further rise beyond 1209.25 will invalidate #1 and #4, and also probably #3 (if there is a trendline breach). It will most likely enable bull wave #2 to be the final contestant.
With the break of 1202.39, the last bastion is 1209.30. Any rise above that and the probability is substantially higher for a bull run along with wave count #2. Let’s see how it plays out.
The upside rally stalled at 1204.37. This point fits all four of Lara’s count perfectly, and the play so far fits the “schedule” of all of them to the letter. It is going to be a long wait till the situation is resolved. So, I might as well go to sleep.
🙂 thumbs up!
Possibly wave e ended at $1191, but usually you get a sharp reversal after its completion. So far that has not happened.
C of e wave in triangle may be underway. My guess it bottoms near $1188. Watch for fast reversal in this area in the next few hrs.
I highly doubt that prices will drop that far. GLD is bouncing right on the channel support. I’m looking for up movement the rest of the day and a breakout of GDX flags.
This is what I’m looking at. Not trading GLD right now as I’m solely in GDX-related trades but if I were trading GLD this would be a no-brainer long and it’s easy to keep a tight stop.
I have no brain… ;). I’m waiting for 1190 gold–will try to enter gld small amount…will then look to sell near 1200…will sell at loss if we go under 1188…that’s my plan, anyway…
Oops, guess I’m too late…sitting sidelines for today, then..
Lara. I really appreciate this almost impossible task of trying of make sense out of the capricious whimsical nature of the gold market. It looks like the original horse race is scrapped as the spectators have got bored of the race going nowhere. Many have already lost huge bets and have been cursing. In its place, a much more complex movement is unfolding. Without a proper guide, punters will get severely burned again. Thank you once again for the illumination afforded.
You’re welcome.
If I traded gold i’d be sitting this one out on the sidelines. I’m sitting out NZDUSD waiting for the right moment to enter short there…
Sometimes it’s the trades you don’t try to make which make the difference between profit and loss.
Trading sideways chop like this is for experienced experts only. It’s easier to make profits when markets are trending, not sideways. I’m concerned that some of our newer members haven’t learned this yet… but then I remember that the only way to really learn that lesson is by losing.
Hi Lara. You are absolutely correct. If you had read my posts these past few days you will notice I have been consistently exhorting members to refrain from trading especially as most of them trade leveraged ETFs in which a single up and down move back to the same point also entails a significant loss even on small positions. I usually place higher bets on third waves in which minimal effort monitoring is needed. For all others, I trade for the thrill of it only. Of course the side effect of earning profits is always a welcome feature. Hopefully, they will heed your advice. Always try not to lose money!
Thats brilliant. I can’t do that, so when you do it’s most helpful.
I’m not a legally registered investment advisor, so what I provide is educational not trading advice.
I may consider becoming a registered advisor… but only when I’ve finished CMT. One thing at a time…
Lara thanks a lot for the monumental effort you put into providing extra charts and details and time frames to provide as much clarity as possible for us to follow along with gold.
You’re welcome, and yeah, it is much more work. But it’s necessary this time. Not sure that I’m providing you with much clarity though…
I am confident of that downwards price point, 1,184.04 should provide confidence of a downward breakout. I’m not happy that I can’t find an upwards price point for a potential upward breakout though.
Lara: it wasn’t totally clear to me how much immediate upside should be expected for wave count #4. Shall we assume that gold may trade back above $1200 again before collapsing? You also mentioned that gold may take 2-3 days until it breaks $1184. What kind of a structure are you anticipating for it to take that long? Thanks. Also I really appreciate the additional hours that you have invested recently for the sake of your subscribers.
1,202.46 would be the 0.618 Fibonacci ratio of minuette wave (i) for hourly wave count 4. That would be a reasonable expectation.
Although I don’t trade off the weekly charts, I do find them useful in trying to understand the current bigger picture context so I can get a feel for whether I’m trading against the grain or “swimming upstream” as I like to call it. When I look at the weekly gold chart, it really looks like gold is in a transition period towards exiting a multiyear downtrend. It just doesn’t look like there is a lot of meat left on the short side of this bone. We’ll see…..I’m neither bull nor bear.
So if gold price trades below $1184.04 bear count is in play and all other counts get invalidated.
Price may stay between 1209 and 1190 …….
Hi papudi. sorry to interrupt again. The ongoing movement is much more complex than you envisage. The following is what I understand from Lara.
Firstly, a price below 1184.04 only invalidates #1 and #2.
In the short term, it also invalidates #3.
After the short term has died down, it confirms #3.
It will always confirm #4.
Secondly, if price moves above 1209.30, #2 is confirmed.
#1 is invalidated in the short term, but confirmed in the longer term.
How’s thst for starters?
You are right.
My head is spinning???? I am calm as long as gold moves side ways in a narrow band.
When the breakout comes it is also likely to be associated with an increase in volume, particularly if it is upwards (not so necessary for downwards).
So to the downside look at 1,184.04.
To the upside look for a strong up day with a clear increase in volume.
It WILL break out of this sideways chop eventually. The question is, which direction?
The evidence of volume indicates down more likely.
Sentiment: Initiate shorts. With 1196/1201 limiting, expecting to see a break below 1191-90 for 1188 and possibly lower down to 1181. Gold price has probably already made Interim highs at 1224 with 1212.50 below that and subsequently at 1209. Gold price has not been able to rise and sustain past 20weekMA / 100dma recently. Upside risk is not seen beyond 1208-09 with 1220-21 and 1224-25 on the outside subject to see Gold price rise above the upper band 1213/14 which is falling. The downside remains a concern and bottomy with ADX continuing to remain weak for the downside. Won’t take much for ADX to turn and strengthen the downside though; but when?! Aarrgghh
and if it breaks $1181 it will seek $1180????
Hi Chapstick: As yet for gold price to get as low as 1181 is a remote possibility. Gold price may stall at 1188-86. Will just have to wait and see how this plays out. For the current, need to see a break below 1191-90 first.
The bottom trendline according to me is not drawn the right way…breakdown to 1184 or above makes it even intact on daily chart
Hourly gold channel I’m watching….http://bit.ly/1bmFnZ3
So, a point about trendlines and channels. Over the years I have found them to be more reliable when drawn after the prior trend changes and not incorporating the top or bottom of the preceding broken trend. My method is probably pretty unconventional but I find it to be more reliable. Here’s an example looking back a bit further to explain my method. http://bit.ly/1bmZMgL