
Two Elliott wave counts expected downwards movement to 1,197 to 1,200. The alternate bear Elliott wave count expected the start of a strong third wave down. Price has moved strongly lower. All three Elliott wave counts remain valid.
Summary: The wave counts now diverge. The bull and main bear counts need upwards movement from here and the target is 1,242. The alternate bear wave count expects downwards movement to 1,168, and only a new low below 1,175.28 would confirm it. Gold has still not broken out of this range it has been in since 27th March. Volume continues to favour the bear alternate wave count, and this is another piece of information which must be considered carefully.
Click on charts to enlarge.
To see weekly charts for bull and bear wave counts go here.
Bull Wave Count
The bull wave count sees primary wave 5 and so cycle wave a a complete five wave impulse on the weekly chart. At the weekly chart level this has a good look.
The problem with the bull wave count is within the subdivisions of intermediate wave (5). I have not found a solution which avoids running flats and has good proportion between the second and fourth waves of the impulse. The bear wave count has a better fit for this movement.
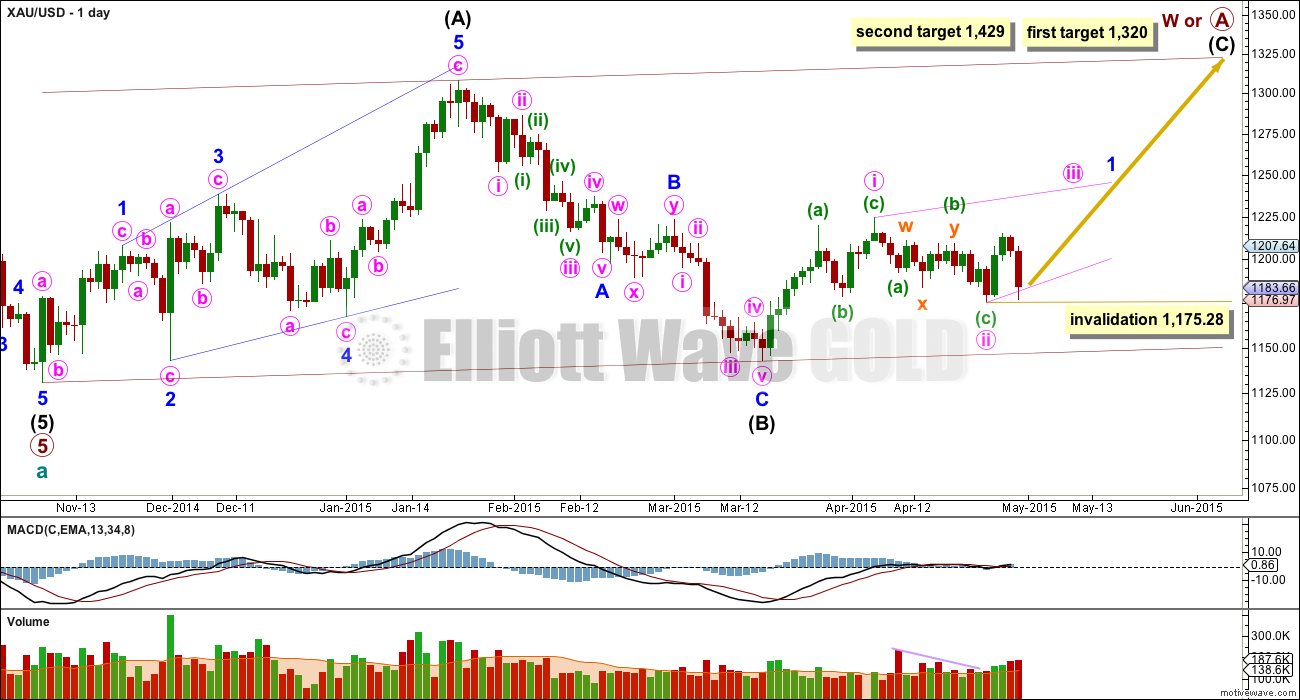
So far within cycle wave b there is a 5-3 and an incomplete 5 up. This may be intermediate waves (A)-(B)-(C) for a zigzag for primary wave A, or may also be intermediate waves (1)-(2)-(3) for an impulse for primary wave A. Within cycle wave b primary wave A may be either a three or a five wave structure.
Intermediate wave (A) subdivides only as a five. I cannot see a solution where this movement subdivides as a three and meets all Elliott wave rules. This means that intermediate wave (B) may not move beyond the start of intermediate wave (A) below 1,131.09. That is why 1,131.09 is final confirmation for the bear wave count at the daily and weekly chart level.
Intermediate wave (B) is a complete zigzag. Because intermediate wave (A) was a leading diagonal it is likely that intermediate wave (C) will subdivide as an impulse to exhibit structural alternation. If this intermediate wave up is intermediate wave (3) it may only subdivide as an impulse.
At 1,320 intermediate wave (C) would reach equality in length with intermediate wave (A), and would probably end at the upper edge of the maroon channel. At 1,429 intermediate wave (C) or (3) would reach 1.618 the length of intermediate wave (A) or (1). If this target is met it would most likely be by a third wave and primary wave A would most likely be subdividing as a five wave impulse.
It is possible that the intermediate degree movement up for the bull wave count is beginning with a leading diagonal in a first wave position for minor wave 1.
A leading diagonal must have second and fourth waves which subdivide as zigzags. The first, third and fifth waves are most commonly zigzags but sometimes they may be impulses.
Here, within minor wave 1, minute wave i may be a zigzag, and now minute wave ii also may be a completed zigzag.
This wave count sees very time consuming first and second waves at minute degree, but sometimes within diagonals the waves may be longer in duration. The diagonal is most likely to be contracting so minute wave iii is most likely to be shorter than minute wave i and so end before 1,257.
Diagonals don’t normally exhibit Fibonacci ratios between their actionary waves, so a target for minute wave iii cannot be calculated until some structure within it can be used. Minute wave iii must move above the end of minute wave i at 1,224.35.
There is another problem for this bull wave count today. If minor wave 1 is unfolding as a leading contracting diagonal then the ii-iv trend line will be overshot by the lower shadow on today’s strong red candlestick. Diagonals normally adhere very well to their trend lines, providing strong support and resistance and rarely overshot. The only way this problem could be resolved is if the leading diagonal is expanding, which is entirely possible but less likely than the contracting variety.
Volume does not support this wave count. If the last two up days are the start of minute wave iii then volume for those two days should be higher than volume of the following two down days. If the trend is up then corrections against the trend should have lower volume. But they do not. They have higher volume.
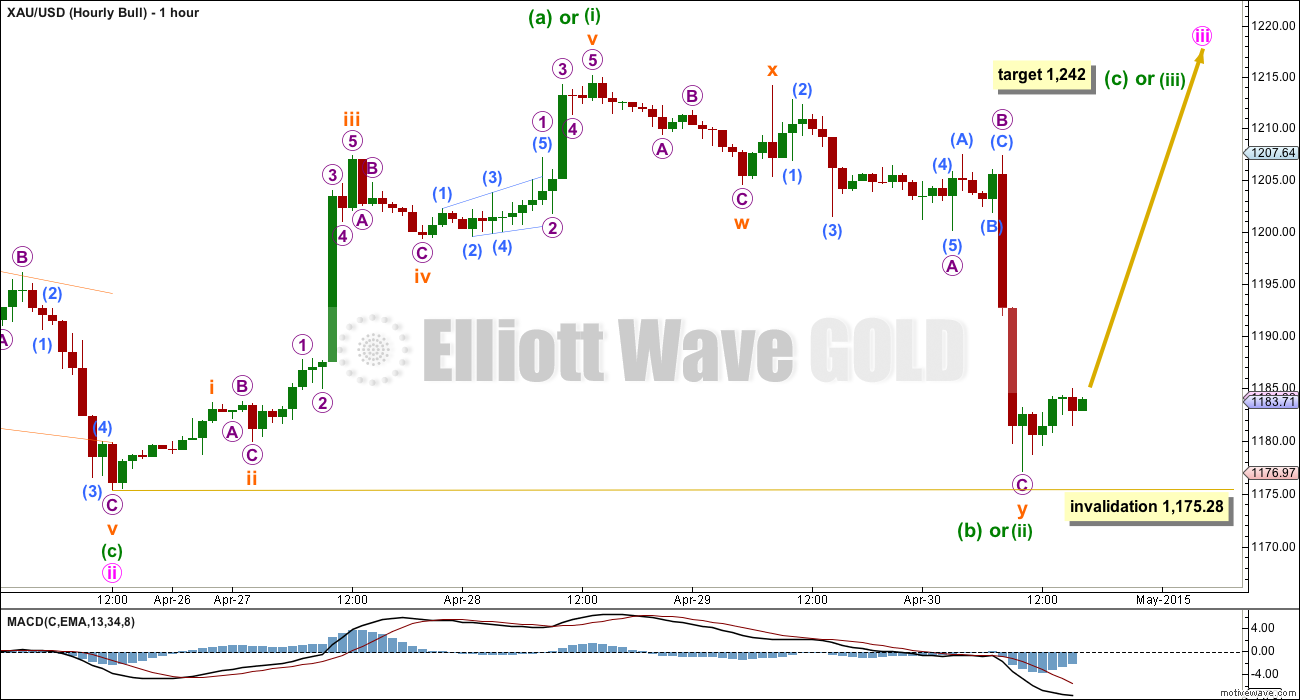
Within the leading diagonal of minor wave 1 minute wave iii would most likely be a zigzag but it may also be an impulse. So far neither are complete. Minute wave iii must move beyond the end of minute wave i above 1,224.35.
Within minute wave iii minuette wave (b) or (ii) subdivides as a double zigzag. If this downwards wave is corrective and if it is complete then the only way I can see it subdividing at this stage is as a double zigzag. If this correction continues any further it may not move beyond the start of minuette wave (a) or (i) below 1,175.28.
At 1,242 minuette wave (c) or (iii) would reach 1.618 the length of minuette wave (a) or (iii). If this is where minute wave iii ends then the diagonal would be contracting.
Main Bear Wave Count
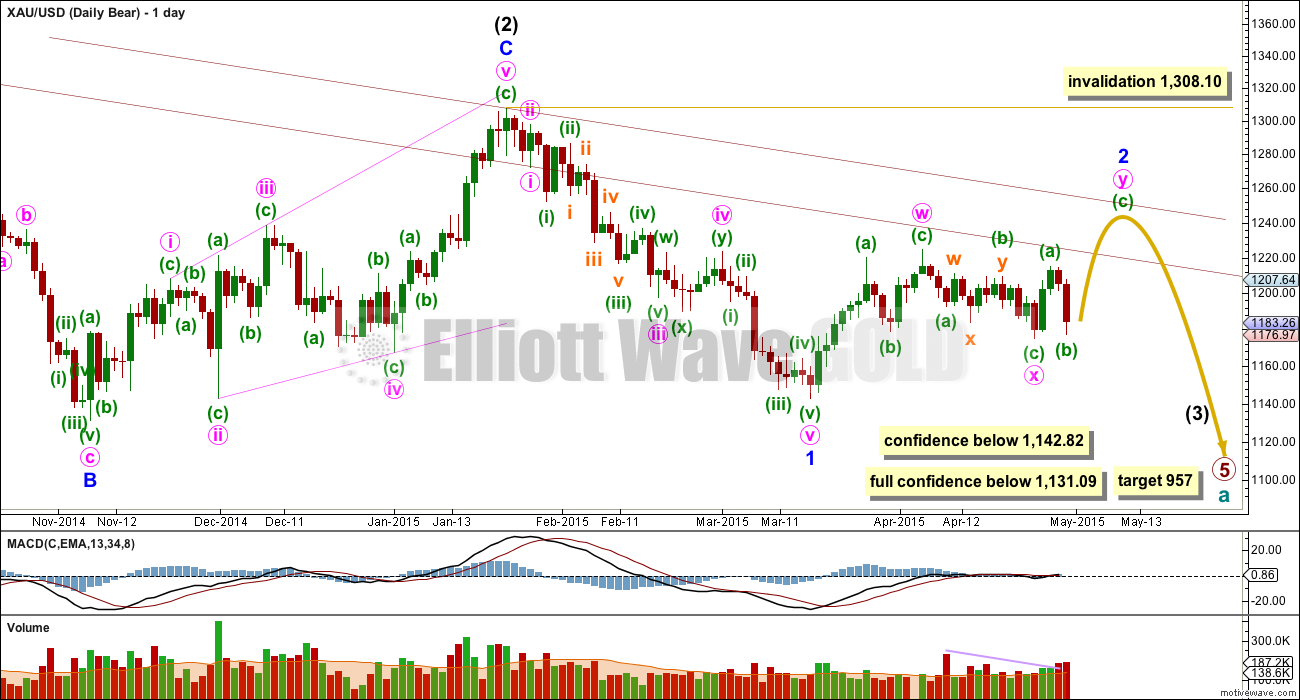
This wave count follows the bear weekly count which sees primary wave 5 within cycle wave a as incomplete. At 957 primary wave 5 would reach equality in length with primary wave 1.
Within primary wave 5 intermediate wave (1) subdivides perfectly as an impulse, and intermediate wave (2) subdivides perfectly as an expanded flat correction. Intermediate wave (3) should have begun.
The problem with the bear wave count is twofold. The channel about cycle wave a (upper maroon trend line, copied over from the weekly chart) is clearly breached. If cycle wave a is incomplete this trend line should not be breached.
The second problem is the duration and size of intermediate wave (2). Although all the subdivisions are perfect it looks too big at the weekly chart level.
Because the base channel on the alternate bear wave count is now clearly breached it has been relegated to a less likely alternate. This main bear wave count has about an even probability with the bull wave count at this stage.
Minor wave 2 may be continuing as a double zigzag. The only problem with this part of the wave count is the duration of minor wave 2. Now both minor wave 2 and intermediate wave (2) look too big on the weekly chart.
The purpose of a second zigzag is to deepen a correction when the first zigzag does not move price deep enough. Within double zigzags the X wave is normally shallow, but here it is 0.60 of minute wave w. That is acceptable, but slightly unusual. The second zigzag may end when price touches the parallel copy of the upper edge of the maroon channel, in line with resistance at the high of intermediate wave (2).
Minor wave 2 may not move beyond the start of minor wave 1 above 1,308.10. Before price reaches that point this wave count would substantially reduce in probability.
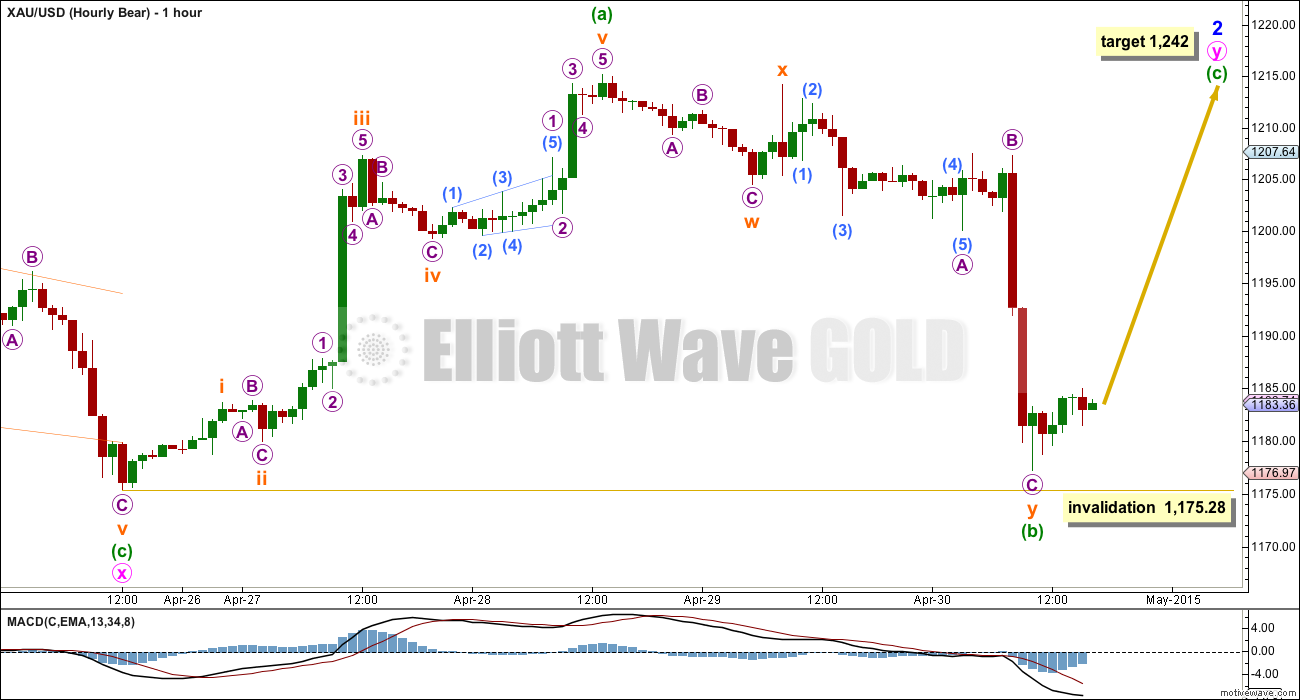
The structure and expectations for this main bear wave count are today identical to the bull wave count for the short term. At 1,242 minuette wave (c) would reach 1.618 the length of minuette wave (a). This target is high enough for minute wave y to move comfortably above minute wave w so minor wave 2 has a reasonable double zigzag look, and it would have a clear upwards slope at its end.
Within the zigzag of minute wave y minuette wave (b) may not move beyond the start of minuette wave (a) below 1,175.28.
Alternate Bear Wave Count
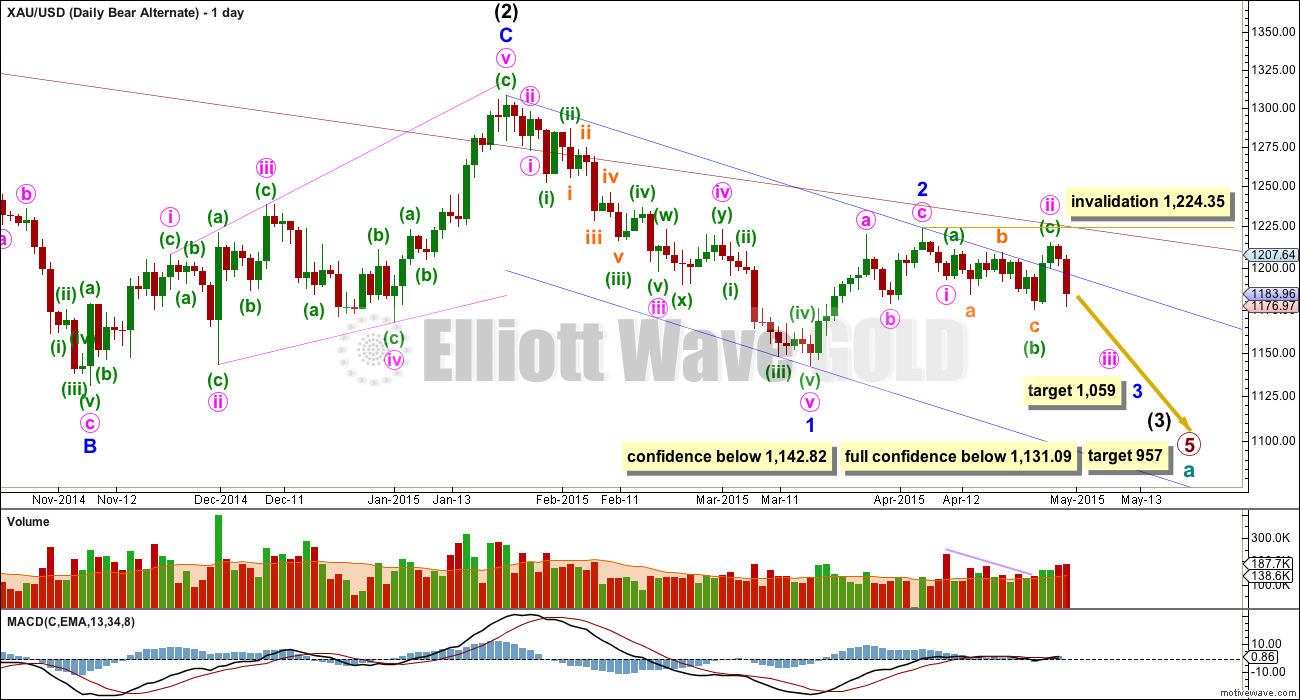
This wave count sees minor wave 2 as a completed zigzag, and minor wave 3 in its very early stages.
Minute wave ii is seen as a complete expanded flat correction.
The base channel about minor wave 2 is breached reducing the probability of this wave count. This alternate bear wave count has a lower probability than the main bear wave count, but only for the reason of the breach of the channel. Base channels often work as they should, but not always. Sometimes a lower degree second wave does breach a base channel.
The middle of the third wave has not yet passed. This wave count still expects to see a strong increase in downwards momentum at the daily chart level, beyond that seen for minor wave 1.
At 1,059 minor wave 3 would reach equality in length with minor wave 1.
If minute wave ii were to continue higher it may not move beyond the start of minute wave i.
Volume supports this bear wave count. If the trend has switched back to down then down days with the trend should have higher volume than up days against the trend. The last two down days show higher volume than the prior two up days. Volume keeps indicating that the breakout is more likely to be down than up, and it is a piece of information which should be carefully considered. Although this is an alternate wave count at this stage, it is entirely viable and has volume in its favour.
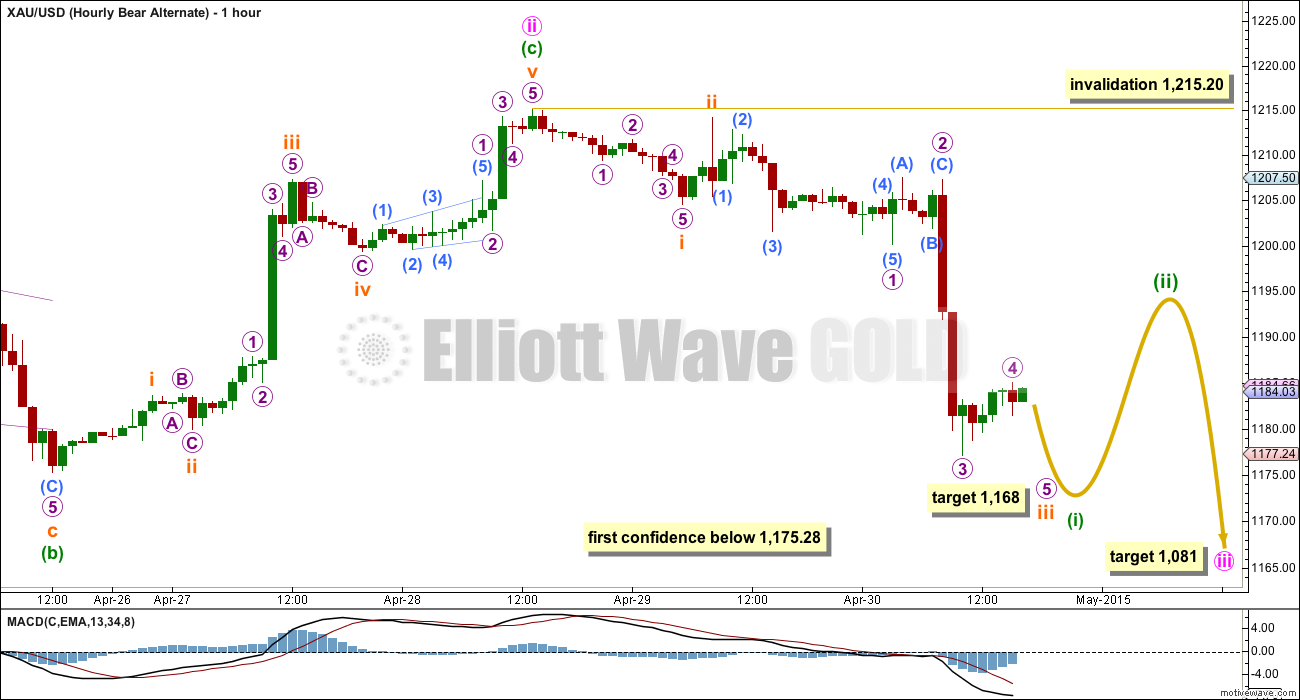
If this downwards movement is the start of a third wave then it would be an impulse and it would be incomplete.
At 1,168 subminuette wave iii would reach 4.236 the length of subminuette wave i. Subminuette wave iii has passed 1.618 and 2.618 the length of subminuette wave i, so this is the next Fibonacci ratio in the sequence.
When minuette wave (i) is over then minuette wave (ii) should correct upwards. At that stage both the 0.382 and 0.618 Fibonacci ratios would be reasonable targets for this correction. It is a low degree second wave correction within a third wave one, two and three degrees higher. There may be enough of a strong downwards pull at this stage within the third wave to force a second wave correction to be more shallow than second wave corrections normally are.
Minuette wave (ii) may not move beyond the start of minuette wave (i) above 1,215.20.
If price breaks above 1,215.20 this alternate bear wave count would substantially reduce in probability. It is difficult to see how minute wave ii on the daily chart could continue yet further.
Weekly Bear Wave Count – Volume
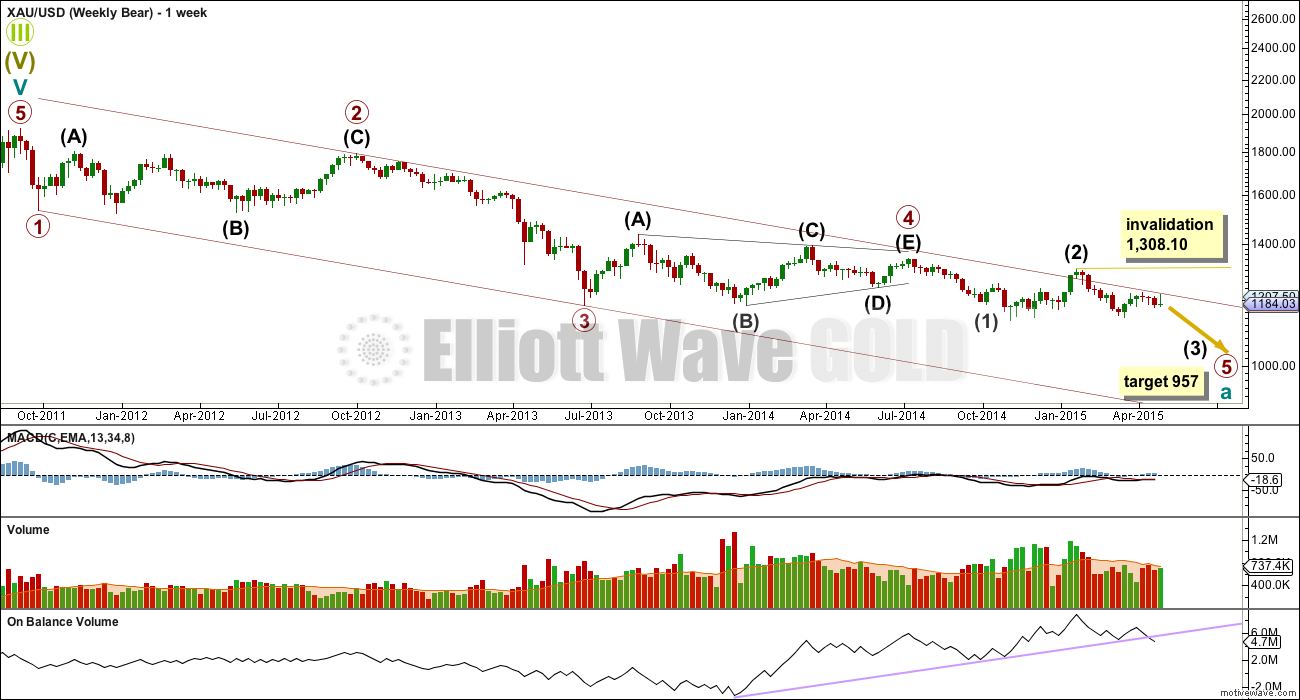
I publish this weekly bear wave count today just to illustrate a couple of interesting points regarding volume. During the sideways move from 27th March it is a downwards week which also has strongest volume.
On balance volume has just breached a trend line which began in December 2013. This favours the bear wave count.
This analysis is published about 05:42 p.m. EST.
A break below 1,175 has increased the probability for the bear wave count. The alternate bear wave count will now be my only bear wave count. The confirmation points remain the same, and they’re still just as important. To have substantial confidence in the bear wave count price must break below 1,142.82. I will only have full and final confidence in the bear count with a new low below 1,131.09. That eliminates the possibility of intermediate wave (B) continuing lower / sideways for the bull count. That target on the bear count is a big call, 957 is a long way away, so I want to provide price points beyond which members may have confidence in that call.
It is possible for the bull wave count that minute wave ii is moving lower. The invalidation point for the bull count moves down to 1,142.82. It needs a C wave to complete a five down. This move down would be a third wave for the bear wave count. Third waves and C waves both subdivide as five wave structures, this one is an impulse. When this five down is complete then the bear count would expect a three up to not move above 1,215.20. The bull count would expect a three or a five up which must move above 1,215.20.
The structure to the downside does look like it should be a complete five, but this comment comes with the caveat that I need to take more time to check the subdivisions work first. If it is a complete five down then the bear count expects a second wave correction to end at either the 0.382 Fibonacci ratio at 1,187 or the 0.618 Fibonacci ratio at 1,198. The bull count now should see upwards movement above 1.215.20 from here.
Short term: both counts would expect some upwards movement from here. How high it goes should tell us which count is more likely.
Thank you Lara for this timely analysis pre-post!
You’re welcome. See the second comment above too.
I’m off to write that up now and finish charts.
🙂
After spending more time with the hourly charts I don’t like seeing this downwards move as a complete five, that needs a second wave correction early on which has a strong slope WITH the trend, it should slope against the trend.
So my conclusion is one final fifth wave down is necessary to complete a first five down.
That is more likely, and then a second wave correction or new bull trend up would be expected.
If the bear wave count is correct then the possibility of a strong extended fifth wave exists, commodities do that fairly often.
It is also possible that a five down is complete as I wrote in my first comment above, and I’ll present this idea for members to judge for themselves. It must have a lower probability though.
Time to close shorts? This is looks like it is only going north from here?
Go for it. But you may question that move in 3 months. It all depends on your trading horizon. If you scalp for profits then definitely bag it and move on. Here’s a chart for context.
Hmmm, interesting chart Mark.
Analyst I follow is expecting a bounce from 1155 Gold.
If you believe that the alternate bear wave count is in play and you have a trading timeframe of more than a daytrade or 1-2 day swing trade, why would you pull the plug on short positions here?
The lack of miners movement makes me think that the bear count is less likely.
Will see how the day finishes before acting.
Good question. I’m a bit nervous about my DUST position here too. Anyone have any idea on the wave structure at this point?
FWIW, I think I’m going to add a little to my JDST before the close. This really looks ready to fall apart and USD is making a reversal. I don’t think the bounce will come until GDX 18.75 area.
Thanks Mark, I sold after Lara’s comments to break even, and am glad I did, but I am definitely looking to get back in at a similar or better price. I admire your nerve to stick to your plan. BTW you almost got your GDX 20.31 just now.
This is a low volume, “nothing-but-consolidation” day with some gap backfills on many charts as well as backtests to resistance on many GDX components. I suspect GDX will move down Monday but for now you might as well mow the lawn.
lol,
its mowed 🙂
Could minute ii have completed already at 1179.6?
Could be right??? Lara wrote that wave iii needs to trade below 1177. Which it did at 1170.
Also Lara wrote above that wave ii will be shallow.
At 1179 the bounce is fib 0.243. ????
“When minuette wave (i) is over then minuette wave (ii) should correct
upwards. At that stage both the 0.382 and 0.618 Fibonacci ratios would
be reasonable targets for this correction.”
UUP may have just broke out intraday as the USD makes the turn. Let’s see how this affects gold…..
I’m actually hoping GDX can move up to 20.31. If so, I will be adding to DUST/JDST. That would be a 5-pt touch on a Wolfe Wave I’m seeing on the 5-minute charts.
This is how it looks on the NUGT 15-min chart. 5 may be in now but I prefer a little higher move to add to short position.
$45 down and GDX has barely moved.
Any views as to why?
$10+ = – 10% in dust last back end of last week.
Dust down… Seen it all now.
The dollar remains in correction mode.
yup.
keeping a watch on the DUST macd for entry. I like to enter when nearing cross 0 line from below. I’m thinking the hrly chart will have time for macd to drop to underneath and position itself for me. Unless this correction is brief. we’ll see.
Looks like bear alt is in play. Retrace target for minuette 2 is 1186 to 1197.
Agreed. Based on my gold chart presented last night below the consolidation will finally break today and to the downside as suggested by multiple lines of evidence. Support appears to be around 1135-1140 at the moment based on my lower fork and I cant see a retrace getting much above 1186 over the next few sessions. It’s nice knowing where the new resistance is now so we can short it!
Mark F – I hope to God that this is the day miners run for the hills!
My Birthday on Sunday and this would be the best present I could get!
I hope things go in your favor. We are finally getting the sort of clarity today that we haven’t had in months. We need a close below about 19.64 on the GDX to confirm structural breakdown on the daily charts.
Agree, but I would argue still need subminuette iv & v to unwind which means one more low below $1169 for complete 5 down
SENTIMENT: Gold price is expecting to continue to decline for some time. //// Tricky and interesting day trade this. Currently I favor the alternate bear count although there is a short term bull lurking around!…. Gold price is bearish, oversold. The SlowK is indicating a sell signal. A good downward move is possible without SlowK being oversold. DMI has signaled a bearish trade, the ADX has turned up indicating a strengthening in the current down trend. Additional market weakness is possible from current levels. A good downside move is possible from here to take out 1177-76 for 1172-71 and possibly down to Lara’s earlier downside target 1160-59. Upside risk 1195-99 with 1210-14 on the outside though not expecting Gold price to rise past 1186 or reach pivot 1189…. . I would consider switching to the long side should a break above 1216 occur. /// With Gold price sitting at or just above the lower band, I would exercise extreme caution.
Mark, I want to like the bearish case, but this falling wedge looks like it could go either way. Even looks like an attempted break to the upside. Maybe a false move. What are your thoughts on this? Thanks,
Anything is possible…I’m just sharing my case based on what I think are multiple lines of evidence. Another line, I don’t think GG believes it’s going to break upwards.
HL broke support too today.
Yes, this does look bearish.
Bob , This is a weekly chart, yes miners will go up, right after gold breaks $1,000, and that is when the real money will be made!!
Bob – I have a different interpretation of the GDXJ weekly structure and it requires looking back a bit further in the past to understand the transition from bull to bear. See my chart below. I believe this has a long way to fall.
I created the attached gold chart a month ago and it’s been uncanny in its ability to frame support and resistance including pegging today’s support right as predicted. So the big question is “Does today’s strong volume move finally initiate a break of the consolidation tomorrow?” I believe there is a really good chance “yes” and I’ll explain why in a follow up.
The reason why I favor Lara’s alternate bear wave and believe gold has a better chance of breaking support is primarily due to this hourly GDX chart which shows today’s action forming a very classic gap down bearish flag. These rarely immediately resolve to the upside and in fact often are followed by another gap down the next day. I’m not saying we are likely to gap down tomorrow but I do favor the down move which I think would be accompanied by a breakdown of the gold consolidation above finally with a target at the bottom of the fork near term. If you couple this with massive resistance on weekly/monthly channels and the great looking bottoms in JDST & DUST, I think you have picture of momentum continuing down tomorrow. Plus the S&P and Naz today broke trendlines dating back to last Fall. I think folks may start selling everything as we possibly enter a market correction. Dollar is due to bounce too!
I think i agree with everything and i am positioned that way except I do not understand why the USD stayed weak. It really should have starting moving up much stronger already. That aspect is very confusing and makes no sense to me. Couple of other things bother me about the bear case especially for tomorrow but that is the biggest.
Baffles me too but still looks like bottoming structure.
I’m trying but I just don’t see it on the USD. Of course I could be wrong but it just looks like it’s locked into a downtrend with no signs of reversing yet. UUP daily is barely clinging on to the 100 day. If I looked at it in a vacuum I’d say it’s about to crash. Shorter term charts do show a hint of divergence though. We’ll have to see. So far it’s very late to the party and it shouldn’t be
Mark – While I agree that it is a bearish flag, we should also see the volume increase/decline as well. We could see that yesterday’s drastic pull down happened with only low volume
The day before to that had a good increase in volume with price dipping down. Now the question is definitely ruled out from a bull perspective however both daily bear and alternate bear play are reasonably having a fair chance
If it is bear play then price action could take it to nearly 1240
I’m not sure what low volume you are referring to. GDX volume was over 58M shares which is huge and much more than the previous day’s 48M. In fact, yesterday’s volume was the highest selling volume day since March 9th. As Lara’s metal charts show above, the volume was huge on the sell side for gold too, so high in fact that it created a trend break on the weekly OBV. Help explain what low volume you’re referring to because I’m confused on that one.
Lara – A quick question, do you have a wave count that you see more probability of happening out of the wave counts provided?
It’s a bit hard to answer this long after your question (now we know what Gold did).
I really don’t want to try and pick a winner.
Based on EW structures I must say bull and bear counts are even in probability. Both have problems either with trend channels and trend line breaches, with subdivisions not fitting as neatly into the structure or with rare structures like leading expanding diagonals and running flats.
Both are viable.
Volume does favour the bear wave count though, even though today is on low volume. And that right there is the problem with volume and bear markets. The market can fall of its own weight. It doesn’t need increased volume to fall, it just needs an absence of buyers. All the TA books I’m reading keep repeating this point, downwards breakouts don’t have to happen with an increase in volume.
But when you do have increased volume on a downward breakout it increases the probability of a bear market.