
The main hourly Elliott wave count expected upwards movement. It had two targets, 1,212 and 1,223, for a possible extended fifth wave. The second target was met and exceeded slightly when price reached 1,224.35.
Summary: It looks like minute wave i is now over, but this is unconfirmed. A clear breach of the channel on the hourly chart is required for confidence that minute wave ii has begun. Minute wave ii is likely to show on the daily chart as one to three red candlesticks, and is most likely to end about the 0.382 Fibonacci ratio of minute wave i at 1,207, or a little less likely at the 0.618 Fibonacci ratio at 1,196. The trend at minor, intermediate, and cycle degrees remains up, but the short term trend sees Gold in a small correction at minute degree.
Click on charts to enlarge.
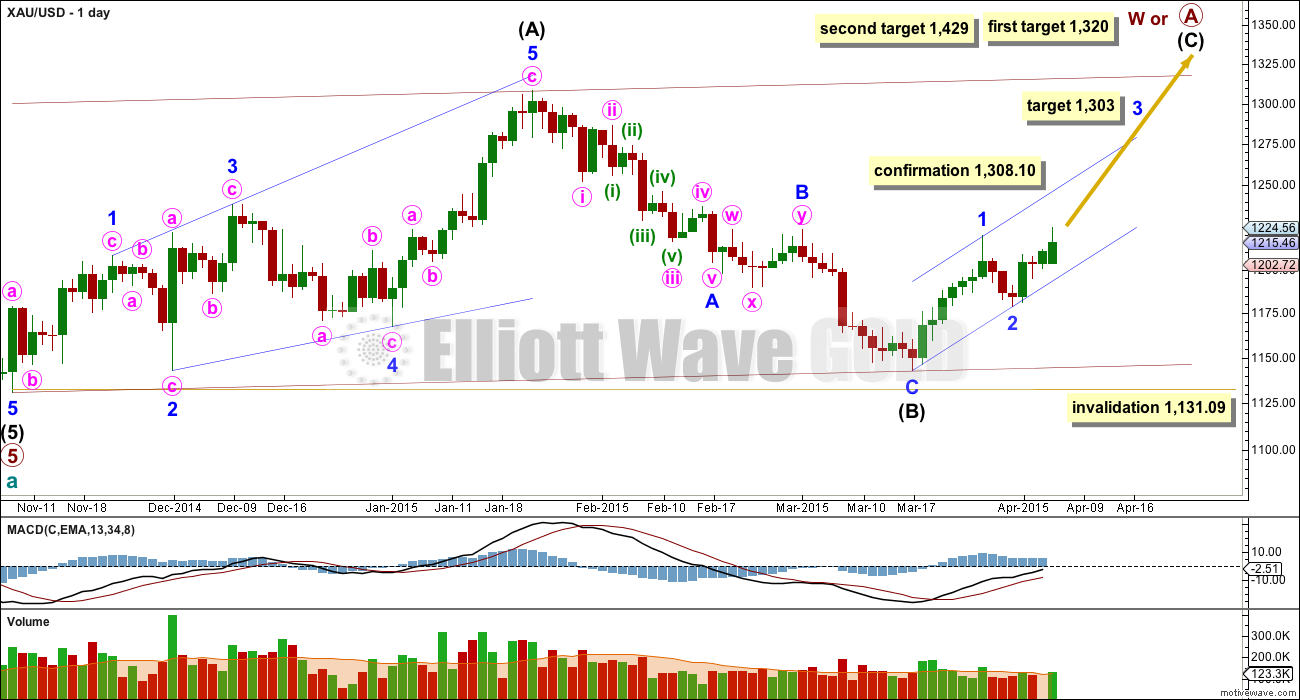
Main Daily Wave Count
There are more than thirteen possible corrective structures that cycle wave b may take. At this stage it is unclear what degree to label this big movement. Primary wave A (or W) is an incomplete zigzag.
Cycle wave b may be a flat correction where primary wave A is a zigzag. Cycle wave b may be a triangle where primary wave A is a zigzag. Cycle wave b may be a combination where primary wave W is a zigzag. Cycle wave b may be a double zigzag with the first in the double, primary wave W, incomplete.
When the big zigzag now labelled primary wave A is complete, it is also possible that cycle wave b could be over there with the degree of labelling within it moved up one degree.
When intermediate wave (C) is a complete five wave structure alternate wave counts will be required to manage the various possibilities of cycle wave b continuing.
A new high above 1,308.10 would invalidate the alternate and confirm this main wave count at primary and cycle degree.
The upwards wave labelled intermediate wave (A) fits only as a five wave structure, a leading expanding diagonal. Within a leading diagonal the first, third and fifth waves are most commonly zigzags, and the fourth wave should overlap first wave price territory.
Because intermediate wave (A) subdivides as a five, intermediate wave (B) may not move beyond its start below 1,131.09.
At 1,320 intermediate wave (C) would reach equality in length with intermediate wave (A). If price keeps rising through this first target, or if when it gets there the structure is incomplete, then I would use the second target. At 1,429 intermediate wave (C) would reach 1.618 the length of intermediate wave (A).
Because intermediate wave (A) is a diagonal then it is highly likely intermediate wave (C) will be an impulse in order to exhibit alternation. Intermediate wave (C) may end about the upper edge of the channel drawn about primary wave A.
This wave count sill has problems of structure within primary wave 5 of cycle wave a:
– within primary wave 5 intermediate wave (2) is a running flat with its C wave looking like a three and not a five.
– within intermediate wave (5) the count is seven which is corrective; either minor wave 3 or 5 will look like a three wave structure on the daily chart where they should be fives.
It is for these reasons that I will retain the alternate until price confirms finally which wave count is correct and which is invalidated.
Volume for downwards movement of minor wave 2 is lower than the prior upwards movement of minor wave 1. Importantly, Wednesday’s session sees volume increase beyond that seen for the prior three downwards days, which supports the main hourly wave count.
Minor wave 1 lasted seven days (no Fibonacci number) and minor wave 2 lasted a Fibonacci three days. If minor wave 3 exhibits a Fibonacci duration it may last thirteen days, which would see it end in nine more sessions (depends on how long the corrections within it last).
At 1,303 minor wave 3 would reach 1.618 the length of minor wave 1.

Minute wave i is now a complete five wave impulse. Ratios within minute wave i are: there is no Fibonacci ratio between minuette waves (i) and (iii), and minuette wave (v) is just 1.55 longer than equality with minuette wave (iii). Minuette wave (v) shows slightly stronger upwards momentum than minuette wave (iii). This is a reasonably strong long fifth wave which is typical of Gold.
So far price remains within the channel drawn using Elliott’s second technique about minute wave i. When this channel is breached by at least one full hourly candlestick below the lower trend line and not touching it that shall provide trend channel confirmation that minute wave i is over and minute wave ii has begun.
Minute wave ii is a second wave correction within a third wave one degree higher. It may be more brief and shallow than second waves often are. In the first instance it is more likely to correct to about the 0.382 Fibonacci ratio of minute wave i at 1,207. If price keeps falling through this first target the next expectation would be at the 0.618 Fibonacci ratio at 1,196.
Minute wave ii is likely to show up on the daily chart as one to three red candlesticks or doji so that minor wave 3 has the right look at the daily chart level.
There are several structural possibilities for minute wave ii. It should be choppy and overlapping. If it unfolds as an expanded flat or combination it may include a new high above its start at 1,224.35. There is no upper invalidation point for this reason.
Minute wave ii may not move beyond the start of minute wave i below 1,178.59.
Alternate Daily Wave Count
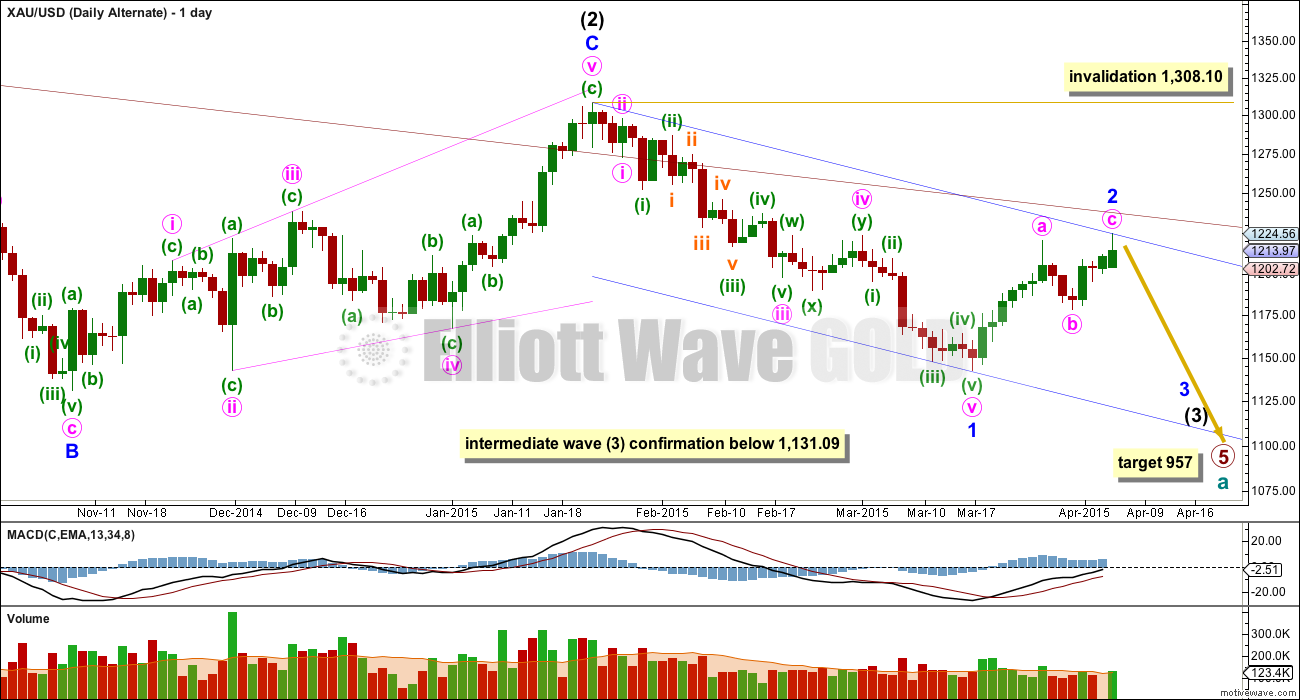
This alternate wave count sees Gold as still within a primary degree downwards trend, and within primary wave 5 intermediate wave (3) has begun.
At 957 primary wave 5 would reach equality in length with primary wave 1. Primary wave 5 may last a total Fibonacci 55 weeks. It is now beginning its 39th week.
The maroon channel about cycle wave a from the weekly chart is now breached by a few daily candlesticks and one weekly candlestick. If cycle wave a is incomplete this channel should not be breached. The breach of this channel was the first warning this wave count may be wrong.
This wave count still has a better fit in terms of better Fibonacci ratios, better subdivisions and more common structures within primary wave 5, in comparison to the main wave count above.
Within intermediate wave (3) minor wave 1 is a long extension. Within minor wave 1 minute waves iv and ii are grossly disproportionate, with minute wave iv more than 13 times the duration of minute wave i. This also reduces the probability of this wave count.
Although the invalidation point is at 1,308.10, this alternate wave count should be discarded long before that price point is reached. If the maroon channel is breached again by one full daily candlestick above it and not touching it then I would discard this alternate wave count.
A new low below 1,131.09 would confirm that intermediate wave (3) down is underway.
Minor wave 2 would now be a completed zigzag. If this alternate is correct it should show itself this week. It now expects a big increase in downwards momentum as a third wave at two degrees begins to gather momentum. An increase in volume as price moves lower would support this wave count. A new low below 1,178.59 would be a strong indication this wave count may be correct.
This alternate wave count remains technically possible. Because the implications are important I will continue to publish it at this stage.
This analysis is published about 05:16 p.m. EST.
Hi Lara, it would really help us NY market guys playing 3x ETF’s if you could be available for the last 1/2 hour of the day. It would make a huge difference for us…
respectfully, Scott
I picked up a little NUGT at 10.81….perfect into weakness.
Mark congrats on your great trades today.
Thanks for your helpful charts.
I did buy DUST at close last night and sold for profits today. I just bought GDX at day low of 19.19 at 3:58 pm today.
Based on my research I am optimistic that gold may go up from Wed 2 pm FED FOMC minutes release. Will watch gold and $DXY very closely at 2:00 pm for their reaction in case I need to switch my position.
Thanks Richard. I’m glad my input is helpful. I will post a GLD chart tonight on the April 7th analysis page that looks really bullish to me provided certain support levels are maintained. Good luck with your trade!
I know, and i normally am here. I had a water supply disaster this morning to deal with. Done now. Comment to Richard below is a quick outline of where I see the wave count.
I hope things turn around for you Lara. I look forward to seeing you at the end of each day.
Yeah, I know you’re all waiting for me when I get up. I need at least one coffee to get going 🙂
I’m living on NZ time (+13GMT I think) and working on NY time, and I’m permanently confused. I don’t know why, but time zone differences are something I have difficulty with. My brain tries to understand it in 3D and numbers don’t fit in that picture for me very well. Add in daylight savings changes in NY and NZ and its even more confusing.
NZ had daylight savings this weekend and everything is an hour earlier for me now. So I’m going to be having to get up an hour earlier to get this analysis out before NY closes. That will happen most of the time, but not all of the time.
Time zone adjustments: I handle that and any other energy issue even zero sleep with ginseng, green tea or Matcha, fish oil and plenty of Greens+ superpowders and superjuices and water, born again in ten minutes :o)
Hi Richard. Do take care of your health. I gather that you are not from the US otherwise you won’t have the rest / energy issues. For me with a 12-hour time zone difference, I would trade the first two hours after the market opening and one hour before the market closes, sleeping in between, and after the market closes. I find that the two periods, at the opening and closing of the market respectively, have the greatest price movements. An exception is the days of the Fed meeting and the minutes release.
How I see it
Lara, are you awake?
Yes. The wave count is pretty much the same.
I had water supply issues this morning to deal with, a bit of a major disaster here at home.
Lara, hope your water supply issue gets fixed up good and fast.
Lara
Do you think gold may bottom next at 1207 or 1196 today or tomorrow morning before 2 pm FED FOMC minutes release? Or maybe bottom or jump up after the 2 pm minutes released?
I’m on the fence to which direction direction to buy and which day?
The fence is getting crowded!
Please use your Elliott Wave crystal ball.
I think it is 45% likely minute ii is over, and 55% likely it’s only half way through.
I’ll have a main hourly wave count which sees only minuette wave (a) or (w) of a flat or double zigzag complete, and an alternate which sees minute wave ii over and minute wave iii beginning.
If we see strong upwards movement with an increase in momentum and an increase in volume in the next 24 hours the alternate would be correct.
If we see more choppy overlapping sideways movement in the next 24 hours the main wave count would be correct.
Off to write that up now.
Gr8 summary
I will say that the intraday price movement in the GDX looks corrective today. If prices continue to just drift lower into the close I will probably take profits on my DUST as a jump up tomorrow/overnight wouldn’t surprise me.
just sold all my DUST at $15.91. Will post chart showing why in a sec.
Are you planning on holding overnight at this point?
Nope. I sold it all. Here is my rationale on the chart. Plus gold seems to have held a second test at 1207.
I thought you bought NUGT to replace it… My mistake…
Oh gotcha. No, I dont plan to hold any gold-related positions overnight. I just don’t see a low risk set up right now like we had yesterday when I got into DUST at 14.66.
Ok, thanks Mark..
You know, a small NUGT position overnight may not be a bad play. I really like the bullish action in gold today holding the shallow retrace at 1207.
Miners are totally wound up on a knifes edge…
No kidding. Just look at the coil on the NEM weekly chart.
Hi Mark, Which indicators are you looking at?
Here’s my weekly NEM chart I put together at the end of Feb which helped position me short at the time. But now note the coil building above the BBands midpoint. Looks a bit more bullish to me than during previous coils as it’s staying above the 20ema.
Nice chart. For FX and commodities, price often moves from one side of the BB to the other, so for this stock it’s still down I think.
I guess down to 1200, then up to 1300
I dont see a corrective 3-waves structure yet
I guess up
I guess down…
Whew!
Cause I just had computer brain freeze during that little wait.
I guess we’re all waiting to see if it’s 1224+ or 1196…
the ‘ol wait-n-see. Hmm. 🙁
Anyone good at EW on the 5 min. chart?
Hehe….
It appears that gold price has made its low at 1207xx and now poised to take out 1212-14 for target 1223-24+ unless it has other ideas and falls from under 1214/16 to take out 1199….
1224+ would invalidate the ALT as well
I am expecting for gold price to top soon…. just a question of at what level gold price would top.
You mean something like the ALT or a ST top?
Well MACD, ROC, Momentum, DMI are bullish, CCI is long; gold price had a narrow trade range and an impulse move can be expected. I think in the text above Lara has mentioned a new high above 1224xx is possible…. Stochastic does not support too high a price rise therefore I would expect gold price to top soon; 50dma is very close to getting under 100dma which may not be bullish when it does cross below 100dma!
on GLD 50 day SMA is 116.30, we re above it now
Hi Syed, does 1224+ breach the maroon trendline enough to discard the Alt?
No or Lara would of discarded Monday
“If the maroon channel is breached again by one full daily candlestick above it and not touching it then I would discard this alternate wave count.”
It may be decided tomorrow.
It appears waves are decided by FOMC day.
I’m not seeing any breach at all. It hasn’t even touched it …. yet.
Now that Lara is about to discard the alt wave with conficence once that happens palnning to put togather gold stocks portfolio for multi year bull market in PM sector : GG,RGLD,SLW,GOLD,NEM,ABX and a dividend paying GGN (11.5%), etc.
I am generating a list.
It looks like Gold will declare its Cycle direction before the end of the week. Gold Cycle update from LikesMoney who is urging caution.
https://likesmoneycycletrading.wordpress.com/
At this time we have ‘trend channel confirmation’ that minute wave i is over and minute wave ii has begun as now have 4 full hourly candlesticks below the lower trend line drawn about minute wave i.
I am just thinking: With 1198/97 holding, gold shorts will be lucky to see a break below 1210 if only to fill the gap down to 1204…. Gold price remains bullish; upside move is expecting for takeout 1221 and top…. An impulse move with thrust is in the making, it could go either way; gold price is and remains bullish….
This is very easy to me….trade below 1196 indicates a big caution flag and the alt count could be playing out. If 1196 holds, main count is easy $. No need to talk about diverging OBV or any other technicals. The waves in gold are always clean so let the waves guide you.
Always enjoy your posts 🙂 …
But I’m not worried about price until its below 1188, which is the 78.6% retracement of minute 1, as usually the trend can stretch up to that ratio before it loses all credibility.
But one thing bothering me at the moment, is that silver has not confirmed gold’s rally, yet. On monday gold reached higher than its minor 1 high of $1220.3 (Mar.26), but silver is below its wave i high of $17.44 (also Mar.26). Also, on monday gold reached up to touch & turn at the trendline drawn from the $1131 low up thru the January pop, but silver hasn’t yet reached up anywhere close to its equivalent trendline.
gap got filled so let’s see how price reacts. I would not worry about what silver is doing at this point. Let the waves and price guide you. Price should never reach 78.6% retrace within a third wave so if it reaches 1188, probabilities substantially increase alt is playing out
Since the gap, the sharp momentum down vanished and price path looks corrective. There’s still a large gap to fill in comex gold from 1151-1160 and small one at 1285.
Maybe I’m in the minority here but I’m not sure I’m convinced of the bullish character of the daily gold chart over the past week. Today’s action was particularly troublesome with the gap up shooting star right into 50% retrace of the huge down move from January on very light volume and divergent OBV. It was an easy call to get into DUST under all scenarios we should expect a down day tomorrow. Hopefully the next few days bring some clarity. I will post a chart shortly.
Here’s the chart I’m reflecting on.
The extended 5th wave to 1224 today leads me to believe that the trend is up. I appreciate the chart though. One chart I like to look at is the $gold:gdxj ratio chart. That one looks like it could build some momentum and become very bullish for miners.
Price-volume analysis indicates that gold tested high volume day with very light volume and closed below the high of high of the previous high.
Means price will retrace back down. I am still open to alt daily count but Lara makes strong argument for trend change.
I agree with Lara that for the alt daily count to be valid it needs to assert itself this week! I’m keeping an open mind for sure, on both counts.
I am also in bearish minority, there is very nice bearish set up since high $1345, 1-2-1-2… so it s almost now or never for strong final capitulation breakdown which should reach $970 at least. Volume for yesterday doesn’t have strong analytical value, because HongKong, London, Germany were closed.
Now the gold chart is at very important junction… Break below $1195 should trigger panic selloff, and breakout of $1225 could trigger strong buying with target above $1400. It should be decided within 2-3 days. For bullish scenario we need to close above $1225 ASAP, just be all extremely careful of tomorrow’s FOMC meeting minutes.
What is -2 1-2 analysis?
You meant Friday’s volume.
For Monday all markets were open and volume was low.
Nope… http://www.investing.com/economic-calendar/ Germany, UK (so London with OTC market was closed), China (some festival), Hongkong, France have holidays also on Easter Monday…So today is very important, if we don’t close above $1225 I would expect strong panic selling very soon.
Anyone like to comment on possibility of daily alternate wave?
Current daily alternate is on life-support but world economic picture and several big picture cycle theories indicate gold low is not in until the 900s – 800s. I am not a forecaster or EW guru, just can’t shake the sense some event is lurking to resuscitate the daily alternate.
Gold trading at 1214.06 below hour ly chart channel.