
Yesterday’s Elliott wave analysis expected it was extremely likely price would move higher, although confirmation was required by a channel breach on the hourly chart and a new high above 1,206.49. We did not get confirmation of a trend change and price moved lower.
Summary: The wave count is changed substantially for the mid term. The main wave count expects more downwards movement to 1,172. This would be confirmed with a new low below 1,178.59. The alternate wave count follows on from yesterday’s analysis, and it too expects downwards movement but only to 1,180. The price point to differentiate the two ideas is 1,178.59. The trend at intermediate, primary and cycle degree remains up, but in the short term a correction is not over yet.
Click on charts to enlarge.
Main Daily Wave Count
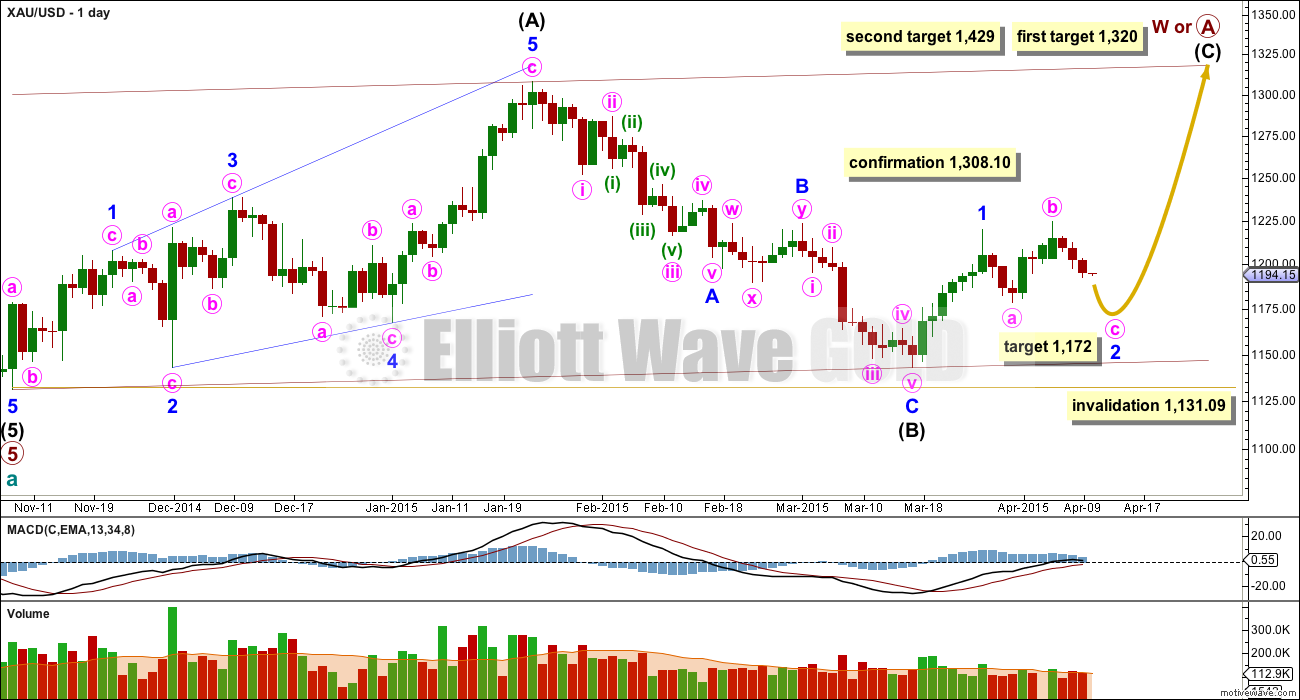
There are more than thirteen possible corrective structures that cycle wave b may take. At this stage it is unclear what degree to label this big movement. Primary wave A (or W) is an incomplete zigzag.
It is also possible that primary wave A will subdivide as a five wave impulse if cycle wave b is a big single zigzag. This idea would relabel intermediate waves (A), (B) and (C) to intermediate waves (1), (2) and (3) within primary wave A trending upwards. The length of this current upwards move labelled intermediate wave (C) on the chart will indicate if this scenario is possible.
Cycle wave b may be a flat correction where primary wave A is a zigzag. Cycle wave b may be a triangle where primary wave A is a zigzag. Cycle wave b may be a combination where primary wave W is a zigzag. Cycle wave b may be a double zigzag with the first in the double, primary wave W, incomplete.
When the big zigzag now labelled primary wave A is complete, it is also possible that cycle wave b could be over there with the degree of labelling within it moved up one degree.
When intermediate wave (C) is a complete five wave structure alternate wave counts will be required to manage the various possibilities of cycle wave b continuing.
A new high above 1,308.10 would invalidate the alternate and confirm this main wave count at primary and cycle degree.
The upwards wave labelled intermediate wave (A) fits only as a five wave structure, a leading expanding diagonal. Within a leading diagonal the first, third and fifth waves are most commonly zigzags, and the fourth wave should overlap first wave price territory.
Because intermediate wave (A) subdivides as a five, intermediate wave (B) may not move beyond its start below 1,131.09.
At 1,320 intermediate wave (C) would reach equality in length with intermediate wave (A). If price keeps rising through this first target, or if when it gets there the structure is incomplete, then I would use the second target. At 1,429 intermediate wave (C) would reach 1.618 the length of intermediate wave (A).
Because intermediate wave (A) is a diagonal then it is highly likely intermediate wave (C) will be an impulse in order to exhibit alternation. Intermediate wave (C) may end about the upper edge of the channel drawn about primary wave A.
This wave count sill has problems of structure within primary wave 5 of cycle wave a:
– within primary wave 5 intermediate wave (2) is a running flat with its C wave looking like a three and not a five.
– within intermediate wave (5) the count is seven which is corrective; either minor wave 3 or 5 will look like a three wave structure on the daily chart where they should be fives.
It is for these reasons that I will retain the alternate until price confirms finally which wave count is correct and which is invalidated.
The wave count is changed to see minor wave 2 an incomplete expanded flat correction. So far it has lasted 10 days and is beginning its 11th day. If it completes in another three sessions it may end in a total Fibonacci 13.
During the correction for minor wave 2 it is up days which have strongest volume. This indicates that the overall trend is up and supports this wave count.
Main Hourly Wave Count
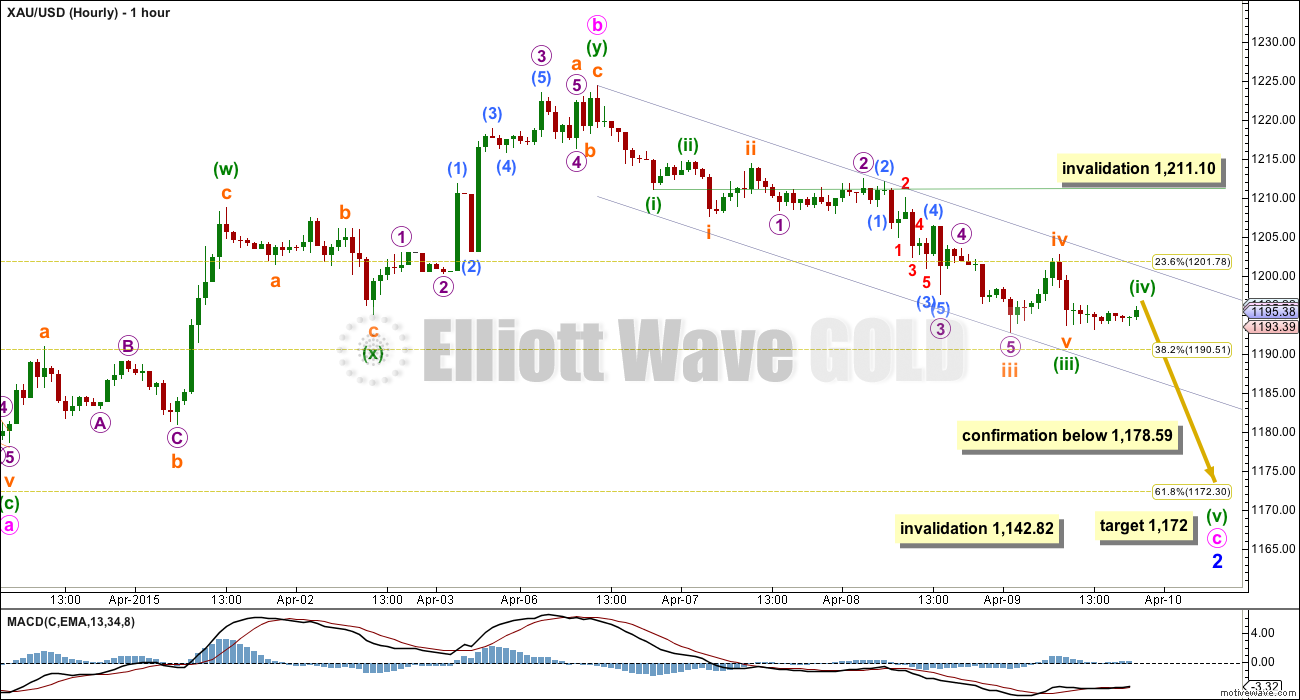
Within the expanded flat of minor wave 2 minute wave b can be seen as a double zigzag, and it does have a three wave look to it on the daily chart. Minute wave b is a 110% correction of minute wave a indicating an expanded flat.
In this instance I do not think that minute waves a and c will exhibit a Fibonacci ratio to each other because that would give a target for minute wave c 1.618 the length of minute wave a at 1,157. That target looks to be too low considering how minute wave c is unfolding, although it may be reached if minuette wave (v) is a swift strong extension within minute wave c.
A more likely target of minute wave c to end may be at 1,172 where minor wave 2 would reach the 0.618 Fibonacci ratio of minor wave 1. It is extremely likely that minute wave c will make at least a slight new low below the end of minute wave a at 1,178.59 to avoid a truncation and a very rare running flat.
Minute wave c must subdivide as a five wave impulse. So far within it minuette waves (i), (ii) and (iii) may be complete. Minuette wave (iii) subdivides perfectly as an impulse, and this part of the wave count has a perfect fit.
Minuette wave (iii) is just 0.28 short of 1.618 the length of minuette wave (i).
Ratios within minuette wave (iii) are: there is no Fibonacci ratio between subminuette waves i and iii, and subminuette wave v is 0.79 longer than 0.382 the length of subminuette wave v.
Ratios within subminuette wave iii are: micro wave 3 is 0.95 short of 2.618 the length of micro wave 1, and micro wave 5 is 0.99 longer than 1.618 the length of micro wave 1.
The middle of the third wave subdivides perfectly as an impulse and has the strongest downwards momentum of this movement so far.
Minute wave c does not fit into a channel drawn using either of Elliott’s techniques. The channel drawn here is a best fit. It is possible if the lower trend line continues to provide support that minute wave c could continue slowly for another three days towards the target.
Minuette wave (iv) looks like it may be unfolding as a triangle. If it gets that far it should find resistance at the upper edge of the best fit channel. It may not move into minuette wave (i) price territory above 1,211.10.
It is worth noting that within this impulse of minute wave c both subminuette waves ii and micro wave 2 would breach a base channel drawn about minuette waves (i) and (ii). This is a perfect illustration of how base channels work most of the time, but not all of the time. In this instance the base channel would have been breached completely and substantially, and price would be still above the upper edge of it.
Alternate Hourly Wave Count
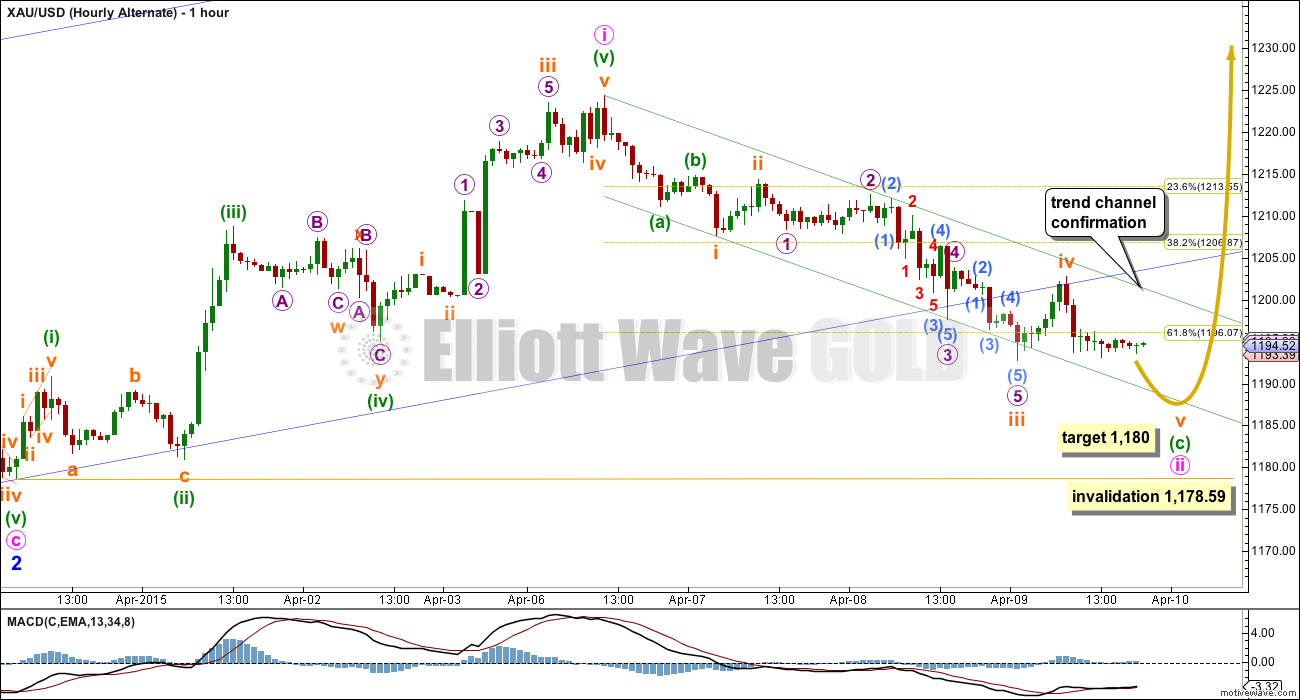
This wave count follows on directly from yesterday’s analysis.
Although the blue base channel about minor waves 1 and 2 is now breached by downwards movement, this wave count remains entirely viable.
The breach of the base channel reduces the probability of this wave count to an alternate.
The current sideways movement within subminuette wave v does not fit at all well within this wave count. This further reduces the probability of this wave count today.
A second wave correction within a third wave is not usually this time consuming or deep. That also reduces the probability of this wave count today.
At 1,180 minuette wave (c) would reach 2.618 the length of minuette wave (a).
I have adjusted the wave count within minute wave ii. Here the subdivisions are seen in the same way as the main wave count, because A-B-C for a zigzag and 1-2-3 subdivide the same way.
Minute wave ii may not move beyond the start of minute wave i below 1,178.59.
Alternate Daily Wave Count
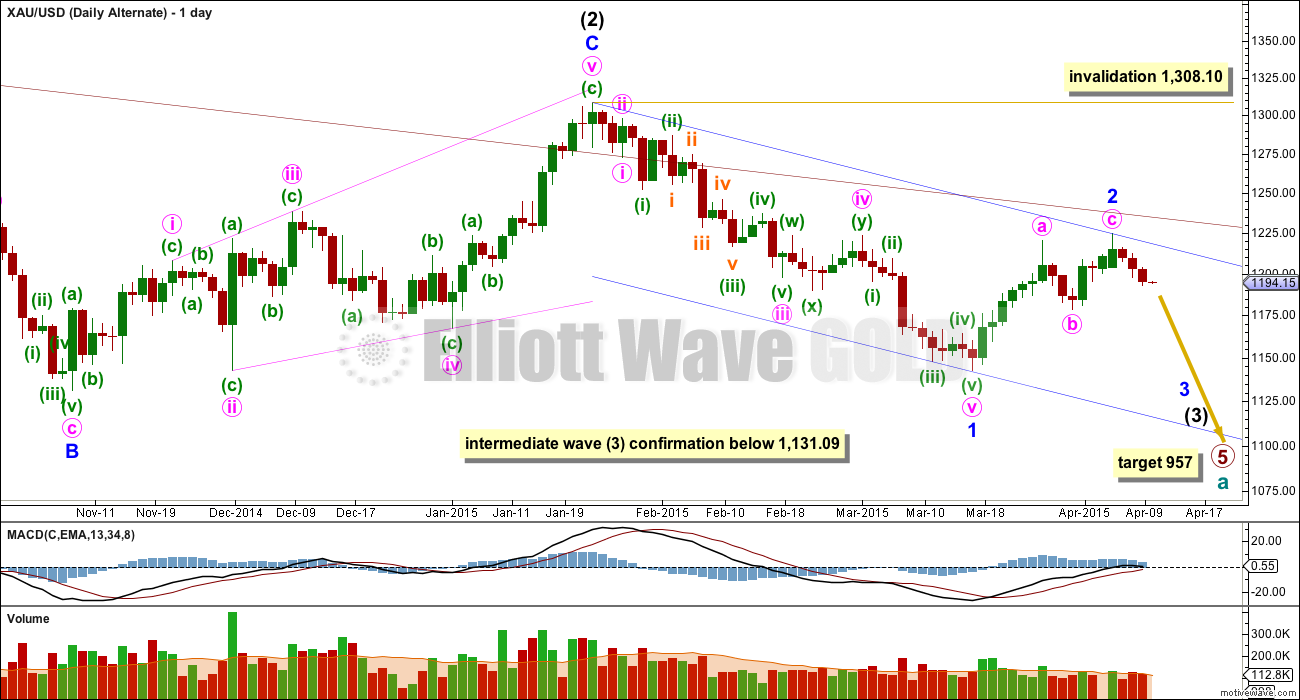
This alternate wave count sees Gold as still within a primary degree downwards trend, and within primary wave 5 intermediate wave (3) has begun.
At 957 primary wave 5 would reach equality in length with primary wave 1. Primary wave 5 may last a total Fibonacci 55 weeks. It is now in its 39th week.
The maroon channel about cycle wave a from the weekly chart is now breached by a few daily candlesticks and one weekly candlestick. If cycle wave a is incomplete this channel should not be breached. The breach of this channel was the first warning this wave count may be wrong.
This wave count still has a better fit in terms of better Fibonacci ratios, better subdivisions and more common structures within primary wave 5, in comparison to the main wave count above.
Within intermediate wave (3) minor wave 1 is a long extension. Within minor wave 1 minute waves iv and ii are grossly disproportionate, with minute wave iv more than 13 times the duration of minute wave i. This also reduces the probability of this wave count.
Although the invalidation point is at 1,308.10, this alternate wave count should be discarded long before that price point is reached. If the maroon channel is breached again by one full daily candlestick above it and not touching it then I would discard this alternate wave count.
A new low below 1,131.09 would confirm that intermediate wave (3) down is underway.
Minor wave 2 would now be a completed zigzag. If this alternate is correct it should show itself this week. It now expects a big increase in downwards momentum as a third wave at two degrees begins to gather momentum. An increase in volume as price moves lower would support this wave count. A new low below 1,178.59 would be a strong indication this wave count may be correct.
If the next green candlestick corresponds with higher volume this wave count will further reduce in probability. If however the next green candlestick corresponds with volume which is lower than the last three downwards days, this wave count could increase in probability.
This alternate wave count remains technically possible. Because the implications are important I will continue to publish it at this stage.
This analysis is published about 08:46 p.m. EST.
Davey, I have deleted your comment because I have closed that topic.
I will delete any further comments on it.
Thank you to all members for remaining aware of the comments policy and keeping this space well mannered and polite.
OK
mortgagefree
Suggest you check into rehab and gain some perspective. You and you alone are responsible for decisions you make. Pay your money and take your chances. Possibly someone is holding a gun to your head and forcing you to be here? Or maybe ISIS has taken your family hostage and force you to join elliottwavegold.com? Otherwise stop complaining. Don’t let the door hit in the $%& on the way out.
A Rare Occurrence
Friday April 10, 2015 17:56
http://www.kitco.com/ind/Wagner/2015-04-10-A-Rare-Occurrence.html
http://www.kitco.com/ind/Wagner/images/20150410-WagnerXAUUSD.GIF
COT data was captured tuesday, part-way thru the first day of the 3 black crows, and it indicated to short:
http://news.goldseek.com/COT/1428694372.php
But it’s useless now. I wonder whether the banksters have real time COT data? I use a proprietary real-time sentiment indicator.
they dont need it LOL
I concur. It is widely acknowledged, although stronglt denied by the banks in cahoots with the government, that larger banks manipulate the market. In that modus operandi, what need is there to have data to work with?
Great day to end a great week. Anyone else got/watch real-time sentiment? After all, EW purports to be sentiment-driven so why not monitor it. Sentiment + Fundamentals + Technicals = Trade Cheers!
Sentiment is very important especially at the sentiment extremes. Such as when Daily Sentiment Index DSI hits lows like 5% or highs like 95%. I’ve seen that, however still useful when not extreme. There are other Sentiment providers.
Yes, indeed. And a real-time sentiment indicator should (is) included on best-of-breed platforms. EUR is extreme now. But no indicator is flawless 🙁
Lara I have a real problem with your approach to this work.
Of late your analysis has been consistently inaccurate and has undoubtedly cost people hard earned money. The latest being your suggestion that we were due two days strong upwards movement (incorrect) followed by an ‘aha’ moment expecting downwards movement (incorrect) and now we are expected to believe in further upwards movement after a $15 up date that was due to go down.
While I appreciate that this is an art and can never guarantee outcomes, I feel your shifting and analysis consistently places people on the wrong side of trades.
Frustrations are compounded by your ‘need to go out’ messages. People have undoubtedly lost money today. Unsure whether you have a serious need to be ‘out’, however when my clients need me I am always available, especially if I feel they have been ill advised by myself.
I have learned over the years that NOBODY knows what gold (or anything traded) is going to do, alls we can do is try to find the best probability. I dont follow her recommendations to the letter, but her outlook combined with mine, and some others on this board 🙂 helps me swing the probability more in my favor. She will never get them all right and I dont expect her to anymore….but for the most part she is a valuable asset. I sympathize as your might have had a bad day….take a deep breath relax for the weekend and will get’m next week!
I understand your frustration although I can’t myself blame Lara . Her daily count has been very valuable when merged with my weekly analysis . I am surprised however that the bottom yesterday ( if it was a bottom ) wasn’t picked out as a possible count .
Anyway , I am not going to follow the hourly anymore . I am not daytrading but trying to hold for the longer term and these daily squiggles are just throwing me off .
My sentiments exactly. I did consider that the bottom was in place at 1193.06 (you can find my posts about this possibility scattered all over the place in real time), but was too mesmerised by the fact that the upper invalidation point was not breached. One day prior to this, it was quite difficult to call the bottom, and even so, not at the moment when it did because the subsequent rise was of a small magnitude for a long time before the spike. I had thought that the spike was an expanded fourth wave flat as it too had not reached 2.00 retrace. Comparison with different markets yield no clue either. SPX and USD both rose with gold, a real anomaly. I guess my past experiences were not sufficient to cope with such behaviour. It takes years of practice to really tell the real McCoy.
Dude, mortgagefree…the medium trend is up, and Lara has been very accurate as of late, and, as a matter of fact, she has been very good (especially at re-analyzing and changing) for as long as I can remember. You were ALREADY positioned at close yesterday for a one day +/-$15 move down in gold? I know this because you were positioned BEFORE her analysis came out. The only one you can blame is yourself. Did you catch here awesome call from $1300 down to $1140 (and before that $1200 to $1280)? Did you catch the first $70 UP that she forecast from $1150? Did you catch the $20 down move that she forecast correctly when gold hit $1220 for wave 2 down? I think the disconnect YOU have is being able to use Elliott Wave to help you be a better trader. You have a lot to learn when it comes to using analysis to make money, and blaming someone else for YOUR trading is the #1 reason why you’ll continue to be frustrated. Unbelievable.
For myself, i just use her analysis as one of the tools i use to gauge the market – and I find it extremely helpful. I frequently do not agree with her conclusions, but that is not as important as the analysis. Also, I feel Lara is quite responsive and for the amount of the subscription fee provides a ton of analysis. It is daily, it is professional, it is instructive. I don’t know where else you can get this kind of work for this kind of fee. I have learned long ago you can never blame anyone else for a market mistake, because you should never follow anyone else. She is not advising anwyay, just providing analysis. I think that’s a big difference. Anyway, I have no vested interest in this other than to say I hope Lara continues her work because i learn plenty from it and I really find it indispensable, whether her conclusions are right or wrong.
I’ve learned the hard way that trading waves 2 and 4 is asking for losses. I was positioned correctly for today, partly because I watched the behavior of the miners late yesterday, partly because I have a bullish bias, partly because I’ve learned that the main vs alternate in a corrective wave is a toss-up, and partly because I took note of Papudi’s post of the cycle blog (would be nice if he said where he got that). I know what to look for on a cycle inflection day and yesterday behaved like a low key inflection in my book.
This is a once a day analysis service which will publish analysis in the afternoon or early evening NY time.
If this does not meet your needs you may cancel your membership at any time.
Exactly, how dare they complain or offer feedback!!
I still await every days offering like an addict. And I know It has consistently adversely affect my trading decisions. But its good for learning Elliot Wave.
After all if it was so easy to trade using a once a day service, Lara would be trading gold and SPX.
The great pity is I think this service could be much more valuable if there was a additional very brief update say half way through London.
Please read the comments policy. It will be strictly adhered to.
I do not think this comments section is an appropriate place to engage in this to and fro.
Members are always welcome to email me with concerns, cricitism or feedback.
This comments section is for members to hang out and share trading tips and analysis.
I expect the highest standards of discourse on this website. Snark, as illustrated in your first sentence, will be deleted.
Finally, I will not be adding to the posting beyond once a day for Gold. I do not and never have undertaken to always have analysis out before NY closes. This will not change.
This topic is closed.
I really don’t agree with your (mortgagefree’s) view, I feel Lara’s analysis is really really great, it is impossible that every prediction always precisely correct by day, by hours and by minutes. Lara’s analysis is very valuable and precise on market direction on days, week and months. Honestly it is a matter of fact how do you put the portion of your bets and what time and price you are putting in. Remember, Lara has reminded us before upon her experience, we should focus on more the mid term trend rather than the hourly trending, on my theory, markets also have lives, knows to reacting to our bets, that is why the market reacts in different patterns differs from time to time; but they still cannot escape the patterns of eilliott wave. Lara is teaching us how does she applying the Elliott wave theory practically on the real market. I am very appreciate of her, her contribution to us ( addict to investing)with this little membership fee, if the fee is high, i will missed that oppurtunity. The other half is based on yourself how to bet relying on Lara’s analysis. Honestly, i have been lost money too, but I have never blame on Lara analysis, because the market finally run as her analysis in mid term. Lara is not always right, but she is almost never wrong. Based on her analysis , i already double and double my capital, i would reward back to Lara when time is right. Eilliott wave also have short term, mid term and long term, Elliott wave already include all the markets message and interaction and reflects on the patterns, it cannot escape from the patterns, it is a matter of how do you put your investment. Thanks Lara once again
I sympathise and can empathise with your frustrations. It is always very difficult to work with waves 2 and 4, especially in a very choppy market. There are just too many variations to consider, and these can change very quickly. I have also been hoodwinked by this in guessing wrong. It is just part of the hazards of day trading. You win some, you lose some. Hopefully, we can do better in he future.
I have to go out so analysis will be later than normal again today.
The alternate hourly wave count looks much more likely to be correct. The channel is breached, there is a bullish engulfing candlestick pattern on the daily chart (the strongest candlestick reversal pattern), the structure for minute wave ii may now be complete.
It is most likely that this upwards movement is the start of a third wave within a third wave up. A new high above 1,211.10 would provide further confidence in this idea.
Lara gold has already breached the upper green base channel to know that minute wave (ii) is over. So gold moves up from here and a new high above 1,211.10 would provide further confidence in this idea.
Yep. And the invalidation point can now be moved up to 1,192.71.
I expect to see increasing momentum, and increased volume.
My only small concern would be that volume for today is lower than the prior three down days. This could certainly resolve itself over the next few days, and first waves don’t always start off with increased volume right on their first day.
Okay, I’m off now. Good luck everyone, and I’m sorry for the mish mash and invalidation of the last two days. That was badly managed.
Dang it . I was going to buy back in but the volume thing now has me second guessing .
And we are sitting right under broken daily trendline . I guess I have to pass .
Lara
Is gold now finishing the 2nd wave and about to start the 3rd wave down of minuette wave 5 down towards the main hourly wave count target of likely 1,172?
No. This looks like the alternate is correct, upwards movement is way more likely to be the start of minute wave iii of minor wave 3.
This does not look like a correction within minute wave c for the main hourly wave count.
The alternate hourly wave count looks correct.
From GDX standpoint, all still looks good on the long side. Unless you’re a daytrader, I can’t understand why one would be buying DUST right now. See notes on my updated chart.
Mark F, will you be holding long over weekend?
Yes, I’m long over the weekend.
Good Mark I’m long on gold also. Thanks for all your valuable assistance. Really glad you are on this site.
Asking any EW experts here . What is the possibility that we completed DZZ yesterday and that now we are in another corrective structure like an X and then we do another corrective structure down ? I remember Lara said there is a limit to the number of nested Three’s ? So will this idea work ?
Lets see if this quote comes true today. usd strength has accelerated everyday this week at exactly 2 pmJamie http://www.sbtradedesk.com . Risk Disclaimer: http://bit.ly/6xPcjR
EUR/USD doing something strange right now
Tham, please let me know when you think this count is in position please.
“the third wave of minuette 5 will then be playing out. The trade will hence be clearly marked.
Certainly. The first wave may have been over. If so, watch the rebound to see if it takes out 1211.10. If not, then I will buy DUST. If it does exceed 1211.10, then I will go long.
I think we are getting close to the top of the 2nd wave of minuette wave (5). The 2nd wave may retrace to 1,208.26 then 3rd wave of minuette wave 5 down.
1210.83 at 9:47 am top of minuette wave (iv)
1204.11 1:26 pm bottom wave 1 minuette wave(v)
1210.83-1204.11= 6.72 x .618= 4.15
1210.83 – 4.15 = 1208.26 Top wave 2, start wave 3
Time to buy DUST unless gold goes above 1211.10
I’m also watching.
Ok. Let’s listen to Lara.
Ok Tham time to buy GDX now.
Yup.
I did buy GDX before the close today.
I really love your gung-ho attitude.
I’ll pass and wait till Monday for clarity. I could buy in on the third wave up.
I guess I was right in calling for minor 2 to have ended at 1193.06. Was too mesmerised by the fact that 1120.10 wasn’t reached and hence invalidate the main hourly.
I’ll recalibrate when Lara’s report comes out. Looks like we are now in the fourth wave of minor 3 minuette 1. I’ll go in once minuette 2 completes.
Have a wonderful weekend. Need to catch up on much needed sleep.
Thanks Tham. I’m in the upwave now relax.
I need sleep also. Will go eat then sleep.
Next week trade wave cycles.
CurrencyShares Swiss Franc ETF (FXF) just dipped
Regarding the question of whether we will break through 1211.10 today….
If we assume today’s action is an impulsive move up, then we are in wave 4 now. That wave 4 just entered wave 1 territory based on pmbull chart. That means we are either dealing with a leading diagonal or we are now in wave C of the expanded flat and going down.
I believe minuette wave (iv) ended at 9:47 am at 1210.83 and now in wave 2 of minuette wave (v)
The only wave count which I’m certain can be eliminated is a third of a third wave is underway. Either minor 2 ended as a running flat or minor 2 is still ongoing per main wave count. $1205-$1207 resistance looks to be too much to overcome at this stage.
Chap , it can’t be a running flat for reasons I have outlined below . But I suppose minuette 4 could have completed . Seems oddly large to me though .
Looks like a perfect running flat to me on the daily chart. I have not checked hourly subdivisions if that’s what you’re referring to.
Hourly subdivisions don’t work at all . C is 3 . Running flat needs to be a 5 .
To be precise , C in a running flat needs to be a five .
sure it does…see lara’s alt hourly count. 5 wave would show a slight truncation.
I don’t see it sorry . Lara’s subdivisions are same as on April 8 . Even if there is a truncated 5th in the Alt , C is still a 3 and needs to be a 5 in a running flat .
The truncations in running flats are normally not nearly that big.
That would be a truncation of 14.12, 34% of the A wave. That is just way too big for a running flat to be considered.
Isn’t it possible, and more likely than a running flat, that minute wave 2 down ended with a very slightly truncated fifth wave (which would be somewhat reasonable assuming a third of a third just started)?
It doesn’t need a truncated 5th . If minute ii ended , it ended at the wave labelled subminuette iii in Lara’s hourly main and alternate . To make a DZZ .
You know what you’re right. Not sure what i was thinking, but i had that thought yesterday for some reason and went long. Forgot the exact idea, but whatever, it worked 🙂 (it may have been i was working with a smaller degree wave because i was concerned a lower low wasn’t made to finish the movement off). Plus my regular TA alerted me to a pop in price coming today
I see what I did now. I have the hourly candlestick that occurred yesterday at 1 PM ET as a truncated 5th (the end of a c wave to end minute 2). I thought a third of a third might then unfold. Still unclear if that is what is happening, but looks pretty bullish all around
Where we are now?
Man o man….104 comments??? really??? I am wasting a lot of time reading through unrelated noise to get the nuggets of EW that I pay for here….if you want to test your opinion of a perceived $US/GOLD correlation try statistically quantified analysis here…
http://www.mrci.com/special/corr030.htm.
then if it’s still warranted …..find a blog that discusses the imagined correlation and go take up those peoples’ time…or start your own.. don’t mean to flame….just can’t afford to eat up my time(money) on unrelated reading on a paid site….thank you..
Have some compassion for those that shorted
yesterday, only to wake today, and asking
how could they all be so wrong.
Lara’s main daily count is UP so I don’t see a good reason for shorting .
The main wave count expects more downwards movement to 1,172. (from yesterday)
Gold minuette wave (iv) may have peaked at 1210.83 at 9:47 and gold is now heading down in minuette wave (v) towards likely main hourly target of 1172 over 3 days. That sounds like an opportunity to short gold.
Scalping small hourly waves can be dangerous, sometimes scalper becomes scalpie!
He was only suggesting take the US dollar/Gold relation discussion elsewhere.
This a chat room, leave
Thanks for your link you may want to adjust your perception from unrelated noise to related fact.
The inverse correlation I was mentioning is not imaginary but in fact statistically quantified as real, related, relevant and useful.
Gold and US dollar do have an inverse relation, although not 100% it does vary and can get quite high.
US dollar index (ICE) versus Gold (CMX)
DCM15 versus GCM15
30 day -79%
60 day -75%
90 day -6%
180 day -54%
http://www.mrci.com/special/corr030.htm
Break 1211 so we can get this show on the road.
Indeed!
The main hourly wave count expects maybe 3 more days
of slowing downwards movement to the target more likely at 1,172 and possible but less likely 1,157.
I am seeing a breach, by 3 full hourly candlesticks above the upper green line on the alternate for a “Trend Channel Confirmation” however gold appears to be ignoring that and moving down.
Gold has “Trend Channel Confirmation” on the alternate daily chart. I am seeing 3 full hourly candlesticks above the upper green line on the alternate.
The main hourly still has not been invalidated yet, however does the trend channel confirmation of the alternate override the main hourly chart not being invalidated yet? If so I’ll be bullish, if not I’ll wait. Thanks to paurdi for asking if any confirmation.
I posted this breach for a Trend Channel Confirmation on the Alternate hourly wave count, 4 hours ago but no one responded today anything on Trend Channel Confirmation on Alternate so didn’t buy anything until Lara end of day comment. Then bought GDX before the close.
Better safe than sorry,
Laura provides a clean, clear unbiased view of gold. That’s what I want, that’s why I am here. She has mentioned she seldom reads, views or listens to news and economic reports so as to not be influenced–that is good. Theoretically gold could be compared to millions of products and indices from price of italian sardines to baltic dry index. Yes the dollar can easily be compared to gold so can silver and miners, 10 year treasuries etc. How many different charts could Laura do and when does this begin to bias her work with gold? Does an EW dollar chart front-run or foretell gold? If not why would charting dollar be better than charting silver as comparison to gold?
I suggest Lara spend more time surfing as that will clear her mind and put her in tune with energy of waves, after all EW requires lots of subjective analysis better done by a Jedi than a computer.
The problem is we should be looking at a ew usd
chart because like they will teach you over at kitco
the move in gold was not due to buyer or sellers
of gold, it was buyers or sellers of usd.
I disagree. I think the silver and GDX charts may not be as important as EW US dollar chart. Lara would not be biased and would ignore just as she ignores letting GDX or Silver lead her decisions on gold. The US dollar may have bigger volume than GDX or silver so more accurate in an inverse way. Anyway no use arguing as belief like this is set in stone until one day each person decides for themself to change it.
Does anyone have on their trading platform under studies “compare with”, if so add in $DXY then look at several time frames and let me know what you see. If so then prepare to be shocked into the inverse connection.
I baught jnug yesterday, all EW gold guys had gold going
to somewhare below 1180. They didn’t look at gold in all
the world currencies.
Dell, where do you see gold going from here or maybe the question is where is jnug going from here?
I look at alot of info, I believe if somehow we could get a
EW gold chart minus the huge move in USD, it may be much
more accurate. Not sure how to do that I will it to the EW pros
like Lara.
Sorry answer to your question, one way i see trend is from
Kitco chart @ 30 day, they call it gold in kitco currencies (all
major currencies minus usd) and Gold in usd. You will see trend
is up only for about last month. We will see if that starts to turn down.
Look at USD gold on that chart also. You will get a clear idea which
way gold is trending. Remember this is just one of a few things to
look at.
If you go to kitco sit they do a better job then I
at explaining why gold didn’t move at all, it just
looks like it did.
I believe her yesterday’s call of pos. 1170
could have been avoided.
Maybe, If more of us (not just Richard) ask Lara to please
put EW of USD side by side gold then cross them, she will
consider it.
I don’t see why USD will help . The count is the count . She is not going to change the Gold count just because of USD chart .
If you look at chart I posted below it should
make more clear for you.
Yeah , it is totally irrelevant . Her analysis is the EW count . That’s it . She is not going to change the count for nothing . Her job is to give a totally objective count .
There is no such correlation, like Lara told/showed us.
Remember in January, dollar and gold rose together.
Yesterday they moved oppositely. Today they’re both up.
Besides, in EW theory, correlations don’t matter… and this site promises to teach you EW theory, and it does that well.
To see some correlation, check out gold v. US bond yield
Im not looking at correlation, Im looking at gold
your looking at usd and its been going way up
gold has not been going down.
I’ve been doing EW for 2 years and I was in total denial of US dollar effecting gold until earlier this year when /GC and $DXY on same chart, That converted me within 5 minutes. I know a top gold trader in the world who also swears by knowing what the US dollar is doing when he goes to trade gold.
Yes they can move together, although you must
look at the other world currencies to see what
is really going on, and not blindly only looking
at it in usd.
Thank you. I agree totally US dollar and gold together or side by side would help.
Lara did mention yesterday “I’m not seeing an obvious correlation between USD and Gold. If there is one it’s pretty rough.” I think that was due to a not clear enough comparison like what happened news comes out it is clear as day the inverse effect. Lara also mentioned “I don’t have enough data for USD and I don’t have a wave count for it.” Perhaps a solution could be found for that because it would help us trade gold as Gold versus US dollar are two of biggest traded currencies/commodities in the world and inter-related.
It doesn’t mean she changes the EW gold count. It means we may have more confident/probabilities in our trades as right now we are trading gold partially blind as not knowing whether the US dollar is about to help or hurt our trade. EW gold & us dollar side by side would improve our trading. Try it a couple of days and then decide it couldn’t hurt and might wake up a lot of people to how they effect each other.
If you add a compare study of $DXY to your /GC chart and check several time frames I will GUARANTEE you will see it is relevant. Hey I was in denial until I did that, then no touring back as saw the immediate effect all trading day long. Those who have seen will believe those who haven’t may not.
Thanks Richard, is nice to have some here
that can see this.
TOS has /GC and added compare to $DXY and I see the inverse effect the whole day every day on all time frames.
TOS will not lie to me about that. Check for yourselves.
That is a real comparison. The vague statements of gold and the US dollar both went up such and such day or week are not accurate “a picture tells a thousand words” accuracy. To each their own. I’m ok with whatever Lara decides.
The price movement is still indecisive as none of the counts has been invalidated. I reckon the safest play is to wait (yes, patience is a virtue in trading; it prevents anguish). I would be looking at the magnitude of the pullback and then the rebound up. If it takes out 1211.10, then the bullish scenario is definite. If not, the third wave of minuette 5 will then be playing out. The trade will hence be clearly marked.
TKL
With price above 1211 alt hour count confirmed?????
Gold price is not only above green channel line but above blue line.
Any comments
Hi papudi.
There is actually not much to choose between the main count and the alternate hourly count. Both predict a longer term bullish outlook, rising to 1320/1429. The difference lies in the near term scenario. Main gets invalidated at 1211.10 as this was where minuette 1 ended. This refers to minor 2 only. and implies that minor 2 was already over as in my various posts today. Alternate hourly can rise higher before pulling back. Both targets are pretty close by.
I give preference to price. Trendlines come second. Trendlines are sometimes breached and yet the count carries on. It is only when there is a marked breach of the trendlines that the trend changes.
usd strength has accelerated everyday this week at exactly 2 pmJamie is Technical Strategist at DailyFX, author of Sentiment in the Forex Market and founder of http://www.sbtradedesk.com . Risk Disclaimer: http://bit.ly/6xPcjR
He’s pretty sharp. But today being friday, volume dies after 2 pm so I wont give weight to what happens after. I know serious traders whose charts will cut off at 1:30 (comex closing time) because otherwise you can/do get false flags.
Did you join the JS trading desk? Like it??
If gold goes above 1,211.10 would that act as a ‘Short Term’ invalidation of main hourly meaning all lower movement no longer required or necessary and discarded as gold has already signaled the minor wave 2 would be complete and already heading up in minor wave 3? So go BULLISH gold.
The short reply is yes. Minor 2 would have completed at 1193.06. No truncation, all in proper order.
I am 75% positioned long. I did hedge overnight so I missed out on some of the gain in premarket. I am with Mark, I think things are looking very bullish right now.
This is frustrating beyond belief . I ain’t watching these hourly counts anymore . The daily counts have been very helpful but the hourly has just caused me no end of trouble .
If gold closes above $1205-$1207, Minor 2 as a running flat becomes a real possibility. I’m pretty sure the main count will get invalidated today as it got within $1 already.
I think in a running flat the C wave should get fairly close to the start of B and we are no where near . Plus it looks like C is a dzz according to all of Lara’s charts . I fail to see how today is the start of a 3 but I have to concede that it probably is . I see no much alternative except that we are now hugging up against the broken daily trendline and that might provide resistance .
Looks like I have the weekly timing right but I am just not able to hold through all these daily swings . Very frustrated .
Should I be buying DUST now? Are we using main hourly?
I have just added £50k of DUST.
I think we have to see if price rises above 1211.10. If so, minute 2 is over as I explained in my post some way below. If not, then minuette 4 could be an expanded flat, and a deep minuette 5 ensues.
I’m just not seeing the favorable risk/reward proposition of getting into DUST right now. Perhaps when GDX retests swing resistance at 19.80 but even then we have a great ascending triangle setup for a breakout. The structure just looks so bullish. With this said, I cant see adding new longs here either….I wouldn’t do that until the current surge settles into a flag consolidation. Here’s an update of my GDX structure chart posted yesterday afternoon.
A bit off topic as I’m using energy as an example, but the chart attached shows what I consider a good risk/reward setup for going long which I did today at $18.20. Energy Bear ETF – ERY. This is the same thinking I apply in all my trades (gold included) both on resistance and support.
U r good… and bring some balance here…
Instead of always EW-this, EW-that (I know it’s an EW forum and we’re here to learn it, which is a good thing, I’ll be clear)
I appreciate the feedback. My goal for being here is to use convergence of EW with my style of technical analysis to improve the probabilities in my trades. I like the fact that I don’t really understand EW since it looks at the data completely differently than I do. Sometimes I will agree with the setups and sometimes I wont and I will take on trading risk accordingly.
When trading lots of money it is valuable to get a professional second opinion like you do with EW.
Yes, it is indeed wonderful when the stars align. Alas, even then there are no certainties in this uncertain market, right?
Main Hourly count INVALIDATED on FXCM Premium ………
In pmbull, the high is at 1210.83, still below 1211.10 invalidation point.
NOT breached PM bull is extremely accurate and high so far 1210.83 @ 9:47 so NOT breached
Where does the 1211.10 invalidation point come from?
Lara’s chart for the main hourly count.
It does not invalidate the main count overall, just the the minor 2 wave only. After a pullback, the main count will rise to 1320/1429.
12110.10 invalidation is on main hourly chart
Different feeds can/do have different numbers, so I suppose an analyst should compare numbers from the same feed at the pertinent points to determine whether there’s an invalidation or new hi/low, etc. I’m not really an EW’er so I don’t worry over whether or not something invalidated by a tiny amount. I believe trading is an art, not just rules and indicators.
That said, I like good Sentiment Indicators, and I think 1202 is important # today because that determines whether it’s a trend or weekly outside reversal (<1202). Weekly trumps daily or hourly or an hourly EW invalidation IMO in terms of the trend – which – as you know, is your friend, to be traded with, not against.
Silver was Splendid… but I'm moving on to other things than PM for now…. metals haven't had good setups, except silver which I often suck at so nice to bag a silver win. I do better with FX.
Good luck 🙂
That is indeed true. Different feeds do have different price points.
I find it easier on the nerves to focus more of my resources in wave 3’s. They are so much easier to trade as they follow the trend very well. Waves 2 and 4 are the most notorious. They can be so slow and choppy (which is a drain on the emotions, and of course the wallet). I prefer the alternate violent version of those waves. They give a quick decisive action.
The blue is gold in all main currencies -usd, red is gold in
usd. 30 day chart. As of yesterday’s close, to me it looks
like move up was next. Richard asked Lara yesterday
to look at the move outside the USD. She said going down
because She’s only looking at gold in USD.
Stands to reason that the main wave count changes and it proves incorrect.
I have made money going against the wave count in recent times.
Happy Trading!
I expect some resistance at 1210 but again don’t see the bearish case yet. I will sell at major resistance like I always do and continue buying at major support. I’m looking for retest of swing highs.
1209/14 R2
oversold yet?
Thats alot of up movement on little technicals before an opening isn’t it.
Federal Reserve Bank of Richmond President Jeffrey Lackerreiterated Friday that he sees a strong case for the Fed to begin raising short-term interest rates this summer.
“I expect that, unless incoming economic reports diverge substantially from projections, the case for raising rates will remain strong at the June meeting,” Mr. Lacker said in remarks prepared for delivery in Sarasota, Fla.
Don’t forget, gold has been in an uptrend since 3/18 and now we have an upside breach of the hourly corrective channel. I’m just not as much in a hurry to get real bearish as I know many of you are. It’s all about probabilities and knowing where your upside and downside exits are. http://bit.ly/1z1xoph
Thanks for the chart. That’s what my request was below.
But chart annotation hid the current action.
Can u post it without annotations?
Gold price posture is very deceptive at this stage and appears to be halting around 50dma; a pop through here ought to find resistance at 1207-08 and further out at 100dma (1210-11) with 1216-17 on the outside…. Hard to say if Gold price will get back below 1197/96 in a hurry with 1193/92 holding… Hope to see a drop!
The economic calendar is quiet in European trading hours, leaving traders wait for the day’s helping of official Fed commentary to offer direction cues. Richmond Fed President Jeffrey Lacker – a member of the rate-setting FOMC committee – is due to cross the wires.speech on the economic outlook in Sarasota, Fla., at 8:45 a.m. Eastern Time
He is rated “low” impact on the economic calendar. The US bond market should have more influence, as gold usually moves opposite to the 10-year Tbond yield. We’ll see.
Good Morning TGIF! GOLD TECHNICAL ANALYSIS – Prices are edging lower after putting in a bearish Three Inside Down candlestick pattern. A daily close below the 1178.38-85.23 area (23.6% Fibonacci expansion, March 31 low) exposes the 38.2% level at 1161.16. Alternatively, a move back above the 1200.07-7.58 zone (14.6% Fib, trend line) aims for the April 6 highat 1224.15.
Daily Chart – Created Using FXCM Marketscope
http://www.dailyfx.com/forex/technical/article/cross-market_technical_update/2015/04/10/Gold-at-Risk-of-Deeper-Losses-SPX-500-Aiming-at-February-Top.html
Keep in mind the three inside down candlestick pattern is not very reliable. Google it and see for yourself. See my post directly below as to what I’m thinking even though I’m still uncertain.
Morning Chapstick I’m posting some alternative thought to provide some food for thought. I don’t agree or disagree just trying to put it out there. This is a (Think Tank) and I’m learning every day here.
How far of a pull back could we get here from 1205.6?
For the main hourly count, we likely need another new high to complete a 5 wave up which will complete Minuette wave 4, then we go down to Lara’s target. The new high over the next couple of hours must stay below 1211.10.
Thx. So you think the main hourly as still more likely than the ‘alt’ despite the strength of the spike and it breaking through the hourly channel?
Yes, as long as we stay below 1211.10. I think the spike is just wave c of Minuette 4.
In my experience c waves of corrective waves are typically sharp and quickly reversed. This is not being quickly reversed and looks to be drifting higher after breaking out of best fit channel. I’m still uncertain but what if Minor 2 was a running flat?
IF we are going up from here , I think there is no way Lara will say this is a running flat . She would definitely be saying that minute ii was a 3 ( if you look at her charts closely you can see the 3 clearly ) .
3 = dzz to be exact .
Or ii on the Daily ALT count which also works very well as we prepare for a Gold smack down
A bullish candle pattern has emerged in gold.
Per Steve Nison’s book : Frying pan in 4 hour and 3 hour.
Once this period is complete in next 25 minute it will confirm the bullish pattern.
I can not post the intraday gold chart
Never heard of “frying pan” and I cannot find it in the book of chart patterns nor candlestick patterns. What is this?
Steve Nison’s book page 118 exhibit 6.57- “A series of consecutive black candles or small bodies side way followed with large green candle and a gap up with green candle.
For confirmation need a gap up green candle above the trading range.
On alt daily count Lara has shown two channels- maroon and blue. Gold is trading above the blue TL.
Also alt main hour count is validated and holding.
Time to go long in PM sector.
It may be too early to go long as this may still be a continuing 4th wave correction. Confirmation for long would be above 1211.10.
Actually, according to her video and Alt Hourly chart, she says confirmation of her Alt Hourly is after it breaches the green downward channel. That channel is now breached for 3 consecutive hourly candles. Plus silver is leading the charge higher just like it led them lower. Although I’d like to see gold break over the upper pitchfork line I showed below.
Unfortunately I switched this morning from long to short 🙁
Any ideas how far the pullback will be so I could switch to long again?
Gold must break above the upper pitchfork TL ~1207.58 (14.6%) , which if it can will expose/aim gold to the Apr.6 high of 1224.15
Gold held right at my trendline @ 1193, drawn up from the March 17 low line on my chart I posted yesterday… And now old looks to have broken above Lara’s Alt Hourly channel, confirming that Alt.
Glad I hedged gold at 1193 yesterday, and added Silver @ 16.17 as that’s up 2%
Gold price appears to be in a mouse trap more or less scraping the bottom trading between 1198-93 having a narrow trade range and an inside day. Usually an impulsive range breakout ought to occur…. Gold price is Bullish and bottomy…. A break below 1192 for possible 118x-117x would be a real treat! It is tiring to see gold price make no headway either way….
You’re right. There’s a TL there holding gold up by a pixel.
Gold, Siliver prices likely to trade negative: Sushil According to Sushil Finance, gold and silver prices are expected likely to trade negative on the back of the US interest rate outlook. – Apr 10, 2015, 11.17 AM IST | Source: Moneycontrol.com
http://www.moneycontrol.com/news/brokerage-recos-commodities/gold-siliver-prices-likely-to-trade-negative-sushil_1354000.html
Thanks to the many who contributed their advice, forecasts, charts, etc today. Much appreciated in a real team effort.
Mark – I’ve provided the 4th wave correction which has formed a (a,b,c,d,e) bearish pattern and the 5th wave will commence now to take it to 1183 levels which will end the wave 3 within wave 5
I suggest you wind your long shots and move on to build short positions. Of course, it is your call to decide it
I appreciate your suggestion but I’m going to stick with my “long shots” and trading plan outlined below. We just aren’t viewing the charts from the same perspectives.
I realize I’m in the huge minority here but I see more bullishness than most, at least if you believe the miners lead the metal. I would be honestly quite surprised if tomorrow is not an up day for the miners (regardless of what gold does) which is relevant as I know many here use the gold charts to trade GDX, NUGT, DUST etc… I saw buying pressure in the GDX and certainly barely any selling volume today as the GDX left us with a gap down, spinning top hollow-red candle. More times than not, hollow-red candles are followed by up days. The question is whether the up day will be a shallow minuette wave (iv) contained in the channel Lara outlined or if prices surge ahead through channel resistance. I will trade accordingly.
Also look at the silver miners. Silver was down over 2% today yet CDE closed up 0.6% and HL closed flat, both with nice reversal candles.
Tomorrow’s action will decide a lot for me. The GDX is at the 62% retrace of the last swing up move. Any movement lower tomorrow at all and I will be out of my long positions. If the likely up move is very shallow tomorrow, I will probably also sell long positions with small gains and probably put on some short positions as Lara’s analysis calls for a fairly deep 5th wave that I’d like to profit from. In all I think there is chance for a really strong move higher tomorrow that no one here has mentioned at all. I don’t think it has more than 50% probability but I don’t think it should be totally off the radar.
Here’s my version of the GDX chart assuming gold does move to 1,172 area from here.
I’ve been less sanguine about gold, per my charts thursday,
but I bought Silver lots @ 16.17 per my post yesterday.
So you weren’t alone in being bullish on something else.
As you’re into ETFs, maybe look up AGQ sometime (silver)
I guess many of us are into the miners because the payout is higher currently. I have been trading silver ETFs on and off in the past. Then, ETFs fared better as the miners were in the doldrums and were hardly moving. I have been quite successful trading silver ETFs, especially USLV and DSLV. The gains were good but the volumes were rather low, resulting in higher spreads. Also, I cannot buy a lot because it is very difficult to sell. So, this creates havoc with stop losses. Oftentimes too, buying takes forever. One of the most important considerations in trading ETFs is volume. Day trading often involves split-second decisions (for optimum gains), so high volumes is a must.
IMO, ETF trading isn’t as good because:
1) You miss good trades, setups, breakouts, sell points, because EFT is closed to market 80% of the time!!!
Like now. My way, which is how virtually all pro PM traders trade, I bought Silver just after NY closed and I can sell now for big profit… or sell part of it and let the rest run for “free”. No can-do with etf.
2) ETF is much more costly cuz of fund expenses that steal from fund every day
3) ETF is not precise. With gold/silver trading CFD futures, I specify exact price eg. 1193.58 gold or 16.17 silver… Not some meaningless ETF price like 35.44 that nobody can relate to the metal price.
4) You can get any margin you want, from no margin up to 100X margin.
5) CFD’s have better liquidity than ETF. The only ETF with real good liquidity is GLD, and even GLD liquidity has dropped in half since some years ago.
But one positive about ETF is that a few of them are backed 100% physical metal (CEF, PHYS, PSLV, etc) instead of derivatives that have counter-party risk if something blows up, like when the CHF peg broke in January.
Those are good ETF’s if you want security.
You hit the nail on the head concerning ETFs (same as stocks except for futures) as markets are closed for a long duration each day. Also, I have to calculate correlation ranges for ETFs every day so as to make more sense out of the figures.
The gold & silver markets (COMEX) are also closed most of the time. So, you would be trading futures, right?
I might want to try my hand at CFDs. Any reliable online trading platforms that you can recommend?
I could suggest the platform/site that provides the data for our daily gold analysis here. See her FAQ section. I am there too.
I didn’t buy shorts yesterday as my analysis showed that the fourth wave decline had not completed yet. I was afraid of a possible expanded flat in the fourth wave which would have propelled prices higher. I’ll wait till tonight when the fourth wave ought to have completed, then take a small position in the fifth wave, keeping my powder dry for the large Minor 3 up, which should begin next week.
Sounds like a plan, best of luck.
Gold price rallied to 1210.83 as of now.This is either an expanded flat in minuette 4, or that minute 2 has ended at 1193.06 earlier on, and this is the first wave up in minute 3. The invalidation point 1211.10 decides.
Nice call Mark
Syed – Not sure if I got your message well. Are you saying 1224 levels after reaching 1183/1184? or the other way around?
Hi. I think for the last few days my sentiment has been that the top of an up move for gold price has already been seen for a while when gold price got to 1224 and started to decline and then later made a top at 1212 and again yesterday topped at 1203… It is a 50% retracement level from 1224-1142 that I am looking for as a possible downside target (1184/83) notwithstanding the study and analysis by Lara today suggesting 1180/78/72…. This is not to suggest to look for Gold price to get back up to 1224…. At the end of the day it will all depend on where the downside for Gold price concludes; there may be alternation, who knows!
Sentiments: My WOW moment which I was hoping to see yesterday but did not occur – a break below 1192…. Expecting pullback / downturn / short term decline next few bars today and have a target 50% retracement 1224/1142 at around 1184/83 which would wont be easy to take gold price down below 20dma at 1188/87!
Hi Lara – Thank you for the wave count confirmation. I see more probability of the 1st hourly wave count working out. I had shorted around 1195 level earlier knowing that it should minimum take it to 1183 to 1185 levels
Thx Lara! The big lesson for me, everyone here, and maybe yourself is a Minor degree wave probably should last more than 3 days. I did not catch that until today. Still favor the bullish scenario.