
Upwards movement for a fifth wave to a short term target at 1,199 was expected. Price moved higher, but has reached well above the target.
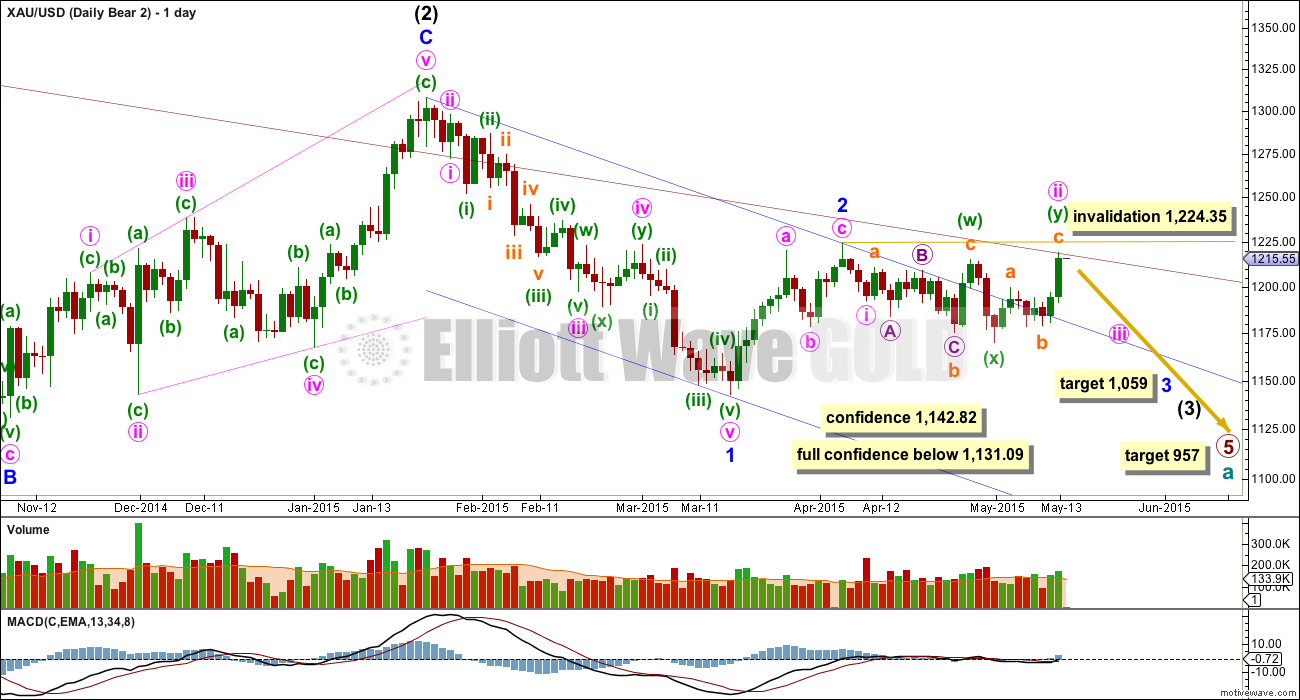
Summary: I will choose to publish one bull and one bear wave count today for serious consideration. These are the best of several possibilities I can see. The bull wave count expects a leading diagonal is unfolding upwards and the third wave must move above 1,224.35. The bear wave count expects a second wave correction is ending and also must move higher. Both wave counts see a five wave impulse upwards incomplete and in the short term a fourth wave correction within that impulse should take one to five days to unfold sideways. The short term invalidation point is at 1,200.03; the fourth wave may not move into first wave price territory.
Click on charts to enlarge.
To see weekly charts for bull and bear wave counts go here.
Bull Wave Count
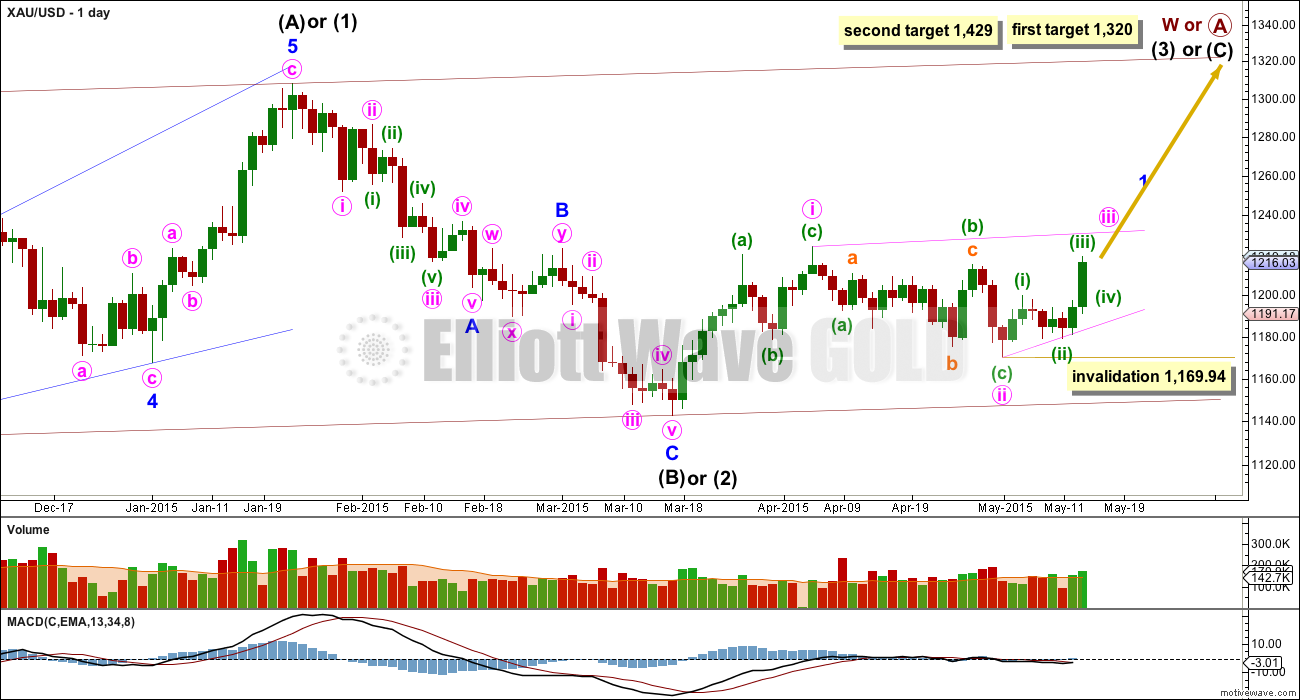
The bull wave count sees primary wave 5 and so cycle wave a a complete five wave impulse on the weekly chart.
Pros:
1. The size of the upwards move labelled here intermediate wave (A) looks right for a new bull trend at the weekly chart level.
2. The downwards wave labelled intermediate wave (B) looks best as a three.
3. The small breach of the channel about cycle wave a on the weekly chart would be the first indication that cycle wave a is over and cycle wave b has begun.
Cons:
1. Within intermediate wave (3) of primary wave 5 (now off to the left of this chart), to see this as a five wave impulse requires either gross disproportion and lack of alternation between minor waves 2 and 4 or a very rare running flat which does not subdivide well.
2. Intermediate wave (5) of primary wave 5 (now off to the left of the chart) has a count of seven which means either minor wave 3 or 5 looks like a three on the daily chart.
3. Expanding leading diagonals are are not very common (the contracting variety is more common).
4. The possible leading diagonal for minor wave 1 and particularly minute wave ii within it look too large.
Volume again shows an increase for Wednesday’s up day, to 170.7K. It is still not higher than the prior strongest volume within this sideways movement of 230.3K for 9th April, or 187.8K for 30th April. For volume to more clearly support the bull wave count it needs to be greater than 230.3 for an up day.
Within cycle wave b primary wave A may be either a three or a five wave structure. So far within cycle wave b there is a 5-3 and an incomplete 5 up. This may be intermediate waves (A)-(B)-(C) for a zigzag for primary wave A, or may also be intermediate waves (1)-(2)-(3) for an impulse for primary wave A.
Intermediate wave (A) subdivides only as a five. I cannot see a solution where this movement subdivides as a three and meets all Elliott wave rules (with the sole exception of a very rare triple zigzag which does not look right). This means that intermediate wave (B) may not move beyond the start of intermediate wave (A) below 1,131.09. That is why 1,131.09 is final confirmation for the bear wave count at the daily and weekly chart level.
Intermediate wave (B) is a complete zigzag. Because intermediate wave (A) was a leading diagonal it is likely that intermediate wave (C) will subdivide as an impulse to exhibit structural alternation. If this intermediate wave up is intermediate wave (3) it may only subdivide as an impulse.
At 1,320 intermediate wave (C) would reach equality in length with intermediate wave (A), and would probably end at the upper edge of the maroon channel. At 1,429 intermediate wave (C) or (3) would reach 1.618 the length of intermediate wave (A) or (1). If this target is met it would most likely be by a third wave and intermediate wave (C) would most likely be subdividing as a five wave impulse.
It is possible that the intermediate degree movement up for the bull wave count is beginning with a leading diagonal in a first wave position for minor wave 1.
A leading diagonal must have second and fourth waves which subdivide as zigzags. The first, third and fifth waves are most commonly zigzags but sometimes they may be impulses.
Within diagonals the most common depth of the second and fourth waves is between 0.66 and 0.81. Minute wave ii is 0.67 of minute wave i.
Minuette wave (b) may not move beyond the start of minuette wave (a) below 1,169.94.
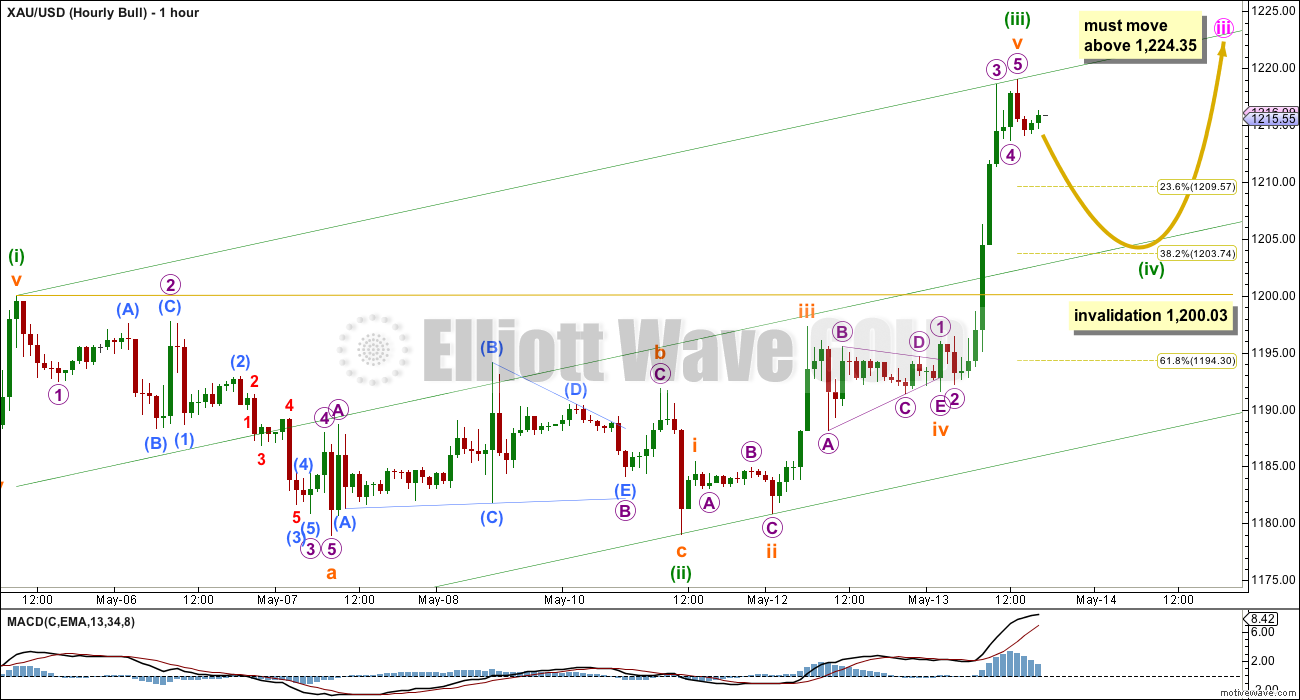
Minute wave iii is most likely subdividing now as an impulse. Minute wave iii must move beyond the end of minute wave i above 1,224.35.
So far within minute wave iii there is a 5-3-5 up. Because this has not moved above minute wave i at 1,224.35, this cannot be a completed zigzag for minute wave iii.
There is no Fibonacci ratio between minuette waves (i) and (iii). Minuette wave (iii) is longer and shows stronger momentum than minuette wave (i), but it is shorter than 1.618 the length of minuette wave (i).
When minuette wave (iv) is complete then a target for the final fifth wave up to complete minute wave iii can be calculated.
Minuette wave (ii) lasted four days on the daily chart. It was a deep 0.70 zigzag correction. Given the guideline of alternation minuette wave (iv) may be expected to be more shallow, ending at either the 0.236 or 0.382 Fibonacci ratios at either 1,209.57 or 1,203.74.
Minuettte wave (iv) is most likely to be a flat, combination or triangle. These structures may include a new high above its start at 1,219.01 as in an expanded flat, running triangle or the X wave of a combination. There is no short term upper invalidation point for this correction.
Minuette wave (iv) may end about the mid line of this parallel channel, or less likely about the lower edge (if it is very time consuming).
Draw the channel using Elliott’s technique: draw the first trend line from the ends of minuette waves (i) to (iii), then place a parallel copy on the end of minuette wave (ii).
Minuette wave (iv) may not move into minuette wave (i) price territory below 1,200.03.
Bear Wave Count
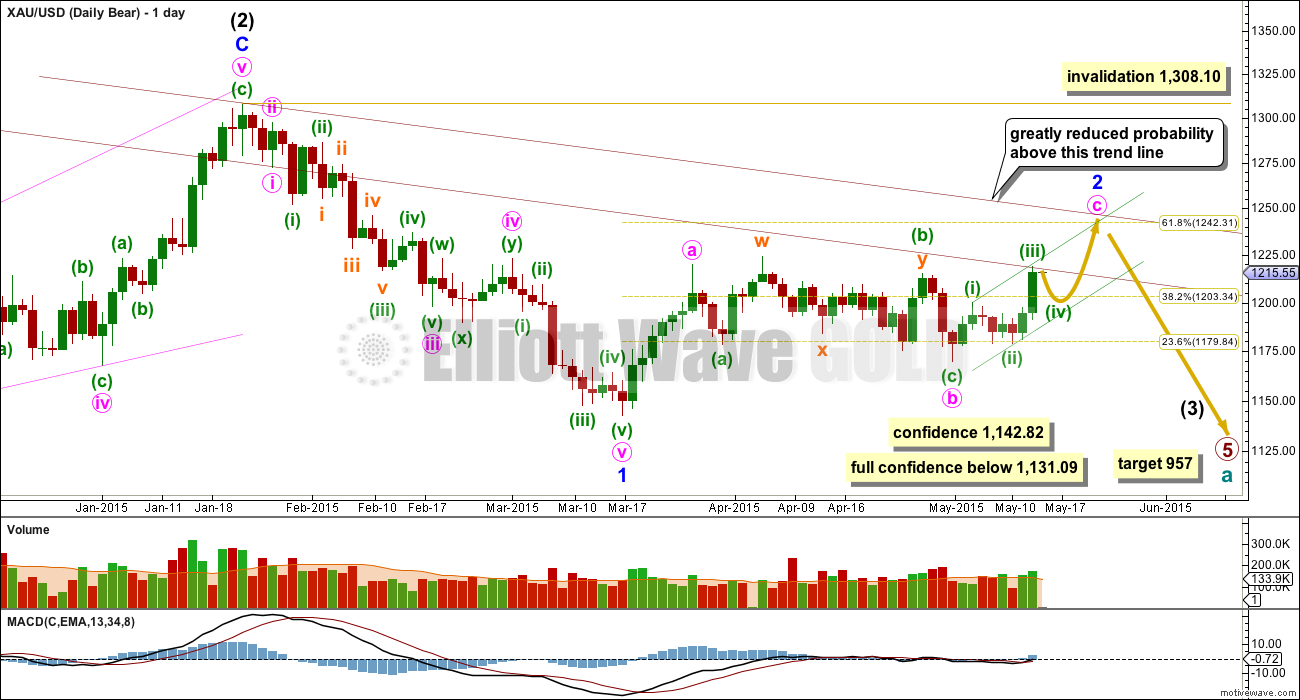
Strong upwards movement for Wednesday could be a continuation of minute wave ii within minor wave 3, but I am judging this idea to have a better overall look. I will publish the other idea as an addendum to this analysis.
This wave count follows the bear weekly count which sees primary wave 5 within cycle wave a as incomplete. At 957 primary wave 5 would reach equality in length with primary wave 1.
Pros:
1. Intermediate wave (1) (to the left of this chart) subdivides perfectly as a five wave impulse with good Fibonacci ratios in price and time. There is perfect alternation and proportion between minor waves 2 and 4.
2. Intermediate wave (2) is a very common expanded flat correction. This sees minor wave C an ending expanding diagonal which is more common than a leading expanding diagonal.
3. Minor wave B within the expanded flat subdivides perfectly as a zigzag.
Cons:
1. Intermediate wave (2) looks too big on the weekly chart.
2. Intermediate wave (2) has breached the channel from the weekly chart which contains cycle wave a.
3. Minor wave 2 is much longer in duration than a minor degree correction within an intermediate impulse normally is for Gold. Normally a minor degree second wave within a third wave should last only about 20 days maximum. This one is in its 41st day and it is incomplete.
4. Within minor wave 1 down there is gross disproportion between minute waves iv and ii: minute wave iv is more than 13 times the duration of minute wave i, giving this downwards wave a three wave look.
This bear wave count now needs minute wave c upwards to complete as a five wave impulse. The short term outlook is exactly the same as the bull wave count, and the subdivisions on the hourly chart are exactly the same.
At 1,247 minute wave c would reach equality in length with minute wave a. Minor wave 2 would be very close to the 0.618 Fibonacci ratio at 1,242.
Minor wave 2 may not move beyond the start of minor wave 1 above 1,308.10. However, this wave count would be substantially reduced in probability well before that price point is passed. A breach of the upper maroon trend line, a parallel copy of the upper edge of the channel copied over from the weekly chart, would see the probability of this wave count reduced so much it may no longer be published before price finally invalidates it.

The hourly chart for both wave counts today is identical. They both expect sideways movement for a consolidation for one to five days, to be followed by a fifth wave up.
Addendum
I will publish these daily charts only today at this stage. I will continue to consider all possibilities until price finally tells us which wave count is correct. Through a process of elimination the bull and bear wave counts detailed above are the best two possibilities. The wave counts below are published today to illustrate other possibilities, but the low probability of each means they should not be given too much weight or time in consideration.
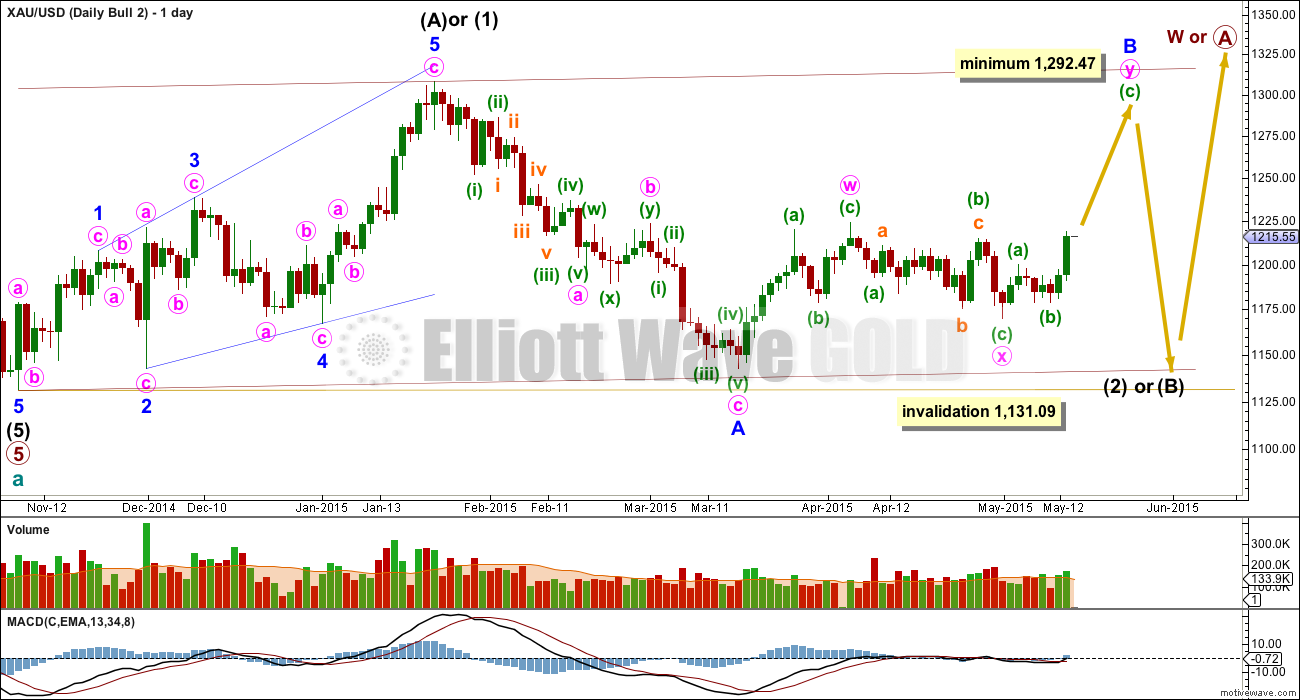
If intermediate wave (B) or (2) is continuing it may be a flat correction. This requires minor wave B to correct to 90% of minor wave A at 1,292.47. The direction for this idea does not diverge from the main bull wave count, so it does not offer much to the analysis at this stage. I will keep following this idea and will again publish it if it shows merit.
Intermediate wave (B) or (2) may not move beyond the start of intermediate wave (A) or (1) below 1,131.09. This possibility clearly illustrates why 1,131.09 is an important final confirmation point for any bear wave count.
This follows yesterday’s bear wave count. Minute wave ii could be continuing as a double combination: flat – X – zigzag. Minute wave ii has strongly breached the base channel about minor waves 1 and 2, and it is much longer in duration than a minute degree correction should be. It is longer in duration than minor wave 2 one degree higher. This wave count does not have the right look at all. It should no longer be seriously considered. I will keep charting it and will only use it if it shows itself to be true with a huge drop in the next 48 hours.
This analysis is published about 06:01 p.m. EST.
Next analysis is just published.
We’re going higher before reversing to the downside (GDX, GLD and SLV)
Thank you Lara for your hard work on EW in this difficult-to-analyze time
You’re welcome. I’ve learned a lot in these past few weeks. For range bound markets i’m going to be adding some traditional TA to assist. Now that I’ve passed level II CMT I’m learning so much more and gaining confidence, my aim is next time Gold moves into a sideways trend to use other TA methods to assist members.
Using ADX, a 20 day SMA and Stochastic (as a choice of an oscillator) and taking the approach outlined in Dahlquist and Kirkpatrick, at the daily chart level ADX indicates the market is still range bound, it’s not trending. ADX is low and flat, at 14.12. Below 15 and flat = no clear trend. So an oscillator may be used to indicate support and resistance within the range.
That’s not really very helpful on the daily chart level. But it is a small indication that the trend is not yet clearly up.
We have a three white soldiers candlestick pattern. The third candlestick is smaller = advance block. After a period of consolidation this pattern is bullish, but with the third candlestick smaller it can have a short term bearish hue.
So again, another piece of evidence, but not enough for full clarity.
Looks like DUST has put in its highest volume day ever today with a very bullish candle which forms a double bottom bouncing off the Jan 2015 low. The previous high volume day was yesterday. This coupled with significant downtrend resistance on the GDX & HUI and many individual PM charts and the very bullish USD chart all are consistent with conditions favorable toppy conditions in the PM sector.
JDST still looks really good too.
GDX weekly needs to close above the red line before anyone can say the trend is bullish.
Lara gold got pumped up high for two days from weak US economic data and dollar, miners lost their appeal like today didn’t happen.
Has gold near term hit the top of it’s trading range of last few months or will it break though upper resistance this week? One specialist says when gold up and miners close down then gold has topped, others say numerous factors including Asia could pump gold up to 1,260.
Can EW see this this tornado of activity and opinions to a clear path ahead?
I’m working on it Richard. I have to be completely honest here, this sideways chop has really dented my confidence with Gold. I’m getting the S&P right at the moment, and I’m confident there, so I need to take that and know that it’s not Elliott wave that is the problem (as in it doesn’t work), it’s the situation where so many alternate wave counts are possible which is the problem.
Periods of time with lack of clarity as to trend are not exclusive to Elliott wave. All TA methods suffer from time to time with this problem. If there was one method which always worked 100% we’d all be billionaires.
Anyway… the bull wave count now can see minute wave iii over as a zigzag. That will be my first hourly wave count for the bull, because the third wave is more likely to be a zigzag so it has a higher probability. The bull wave count will have two hourly charts; the first expecting minute wave iv to move lower, it MUST show on the daily chart, may last five or eight days, and may not move below 1,173.13.
The second bull hourly chart will allow for some sideways movement for minuette wave (iv) of an impulse before a final fifth wave up to complete minute wave iii impulse.
The bear wave count will be the same as the second idea for the bull. A fourth wave correction still needs to show up on the daily chart for this five up to look like a five, not a three. So sideways movement for a few days (three or five?) then another upwards wave for a fifth wave.
For the bear count the upper trend line to provide final support is about 1,240 ATM. If that trend line is broken then only bull counts will remain.
Volume for the last three days is higher, supporting a bull count. But its still not higher than the highest day during that sideways range, and so volume is not providing a clear indication of this breakout.
A new high above 1,224.35 does favour a bull wave count.
2:08 pm although gold is at 1223.36 still up $9 above Wednesday’s close
It is clear the momentum of today’s rally is long gone and investors are taking their profits from the miners as GDX dropped from today’s high of 21.25 down to 20.79 actually only 1 cent above Wednesday’s close and DUST climbed from today’s low of 11.10 back up to 11.85 only 5 cents below Wednesday’s close. With mining ETFs and their 3x ETFs momentum is a huge factor that must be recognized for it’s importance. Right now for miners and their 3 x ETFs it’s like today didn’t happen even if gold and GLD are still up.
back to chart HUI
Are you suggesting a bearish trade?
Did you stay bearish this week?
Back to chart HUI
A reversal at 5th point in a 5 point triangle.
Oh well, what a day! Gold price showing reluctance to drop below 200dma (1220), really need to see a break below 1218, 1216 for possible 1211-10 and perhaps no more than pivot/100dma (1209-08)… Sigh!
Take heart. It will drop. USD is staging at least a mini-rally in the past four hours. The effect on gold should be felt soon.
Gives me a sense that Gold price probably has one more small leg up basing off 1220 for a break above 1224-27 for possibly 1229-30-32-36…. With price above the band, wont expect it stay there too long though… Hourly RSI and 14-Stochastic has enough in it to see Gold price rise through…. Duh, I am really stumped lol…. 🙂
The US dollar index $DXY had an intraday low of 93.20 at 6:56 am then gold and the $DXY both moved up and Gold peaked at 9:59 then trended down and the $DXY has trended up slowly since 9:59 am.
These big news US events strong on gold can keep gold stable for hours almost until near the end of market hours when traders wrap up possibly before 3 pm.
Thanks Richard: At this stage its hard to tell if Gold price is coming or going lol… Gold price seems to be tagging along up with rising Euro and Silver. With the Bond yields falling has probably also propelled Gold price up…. The longs should really look to take money off the table with price above the upper band….Will just have to wait for a drop to get a leg in. Gold price took off on Wednesday basing off 1188 and that’s where I would like to see Gold price down too! lol…. 🙂 Go well. Good luck. Will now just wait for an update from Lara.
I have a feeling that gold has already peaked at 1227.29 at 9:59 am when it went up $4 in 1 minute at 9:59. I count 5 waves to the peak.
Then gold came back up to 1227.28 just 1 cent below peak. Perhaps it may work it’s way down now.
Any opinions?
My current thinking, not confirmed yet, is that minuette 4 ended at 1212.42. For minuette 5, I have been able to count only 3 waves to 1227.28. The current drop is the fourth wave. There will be a fifth wave to complete minuette 5 and hence Minute 3. This will be followed by a drop below 1224.35 as I mentioned to papudi.
I was thinking of peak at 1227.29 at 9:59 am as more of an opportunity to make a nimble trade of buying DUST as since an end of such an impulsive peak (even $4 last peak minute) would have gold dropping a short time intraday. DUST did go up from 11.16 AT 9:59 to 11.64 (4.3%) within an hour and still at 11.49 now.
That is the type of intraday moves I’m looking for instead of holding with high risk several nights as gold stressfully goes opposite directions intraday and nightly.
My view is that I would prefer to wait out and see if it rises further. I will buy for the drop in minute 4. If Lara’s leading diagonal thesis is correct, that drop should retrace between 0.66 to 0.81 of the previous wave. I am envisaging a rise to 1244 which is the next level of strong resistance. The drop would then be in the ballpark of a conservative 0.61*(1244-1169.94) = 45 bucks. DUST would be a good buy then. And that is what I am eyeing.
Tham, I love the sound of that trade.
Count me in. You sure know the lower risk, higher return opportunities to watch for. Thanks.
1244 as per Lara, above 1242.31 trend line would greatly reduce the probability of the bear daily wave count.
Forgot to mention. This is for the bull count, my worse option. (To digress, I prefer the bear because there are potentially more gains in the near term).
The bear count potentially yields a $200 drop from minor 2 to minor 3, and you know that wave three’s are much easier to trade as they are impulses. Fortune has it that both dive from the same platform of around 1244. It should be slightly less than 1244; I use it loosely as that is the nearest strong resistance, and usually price turns around before a head-on clash with strong resistance, just like two magnets of the same polarity does when forced to move closer to each other. Of course $200 is much better than the 45 bucks from the bull.
Yes much bigger % change to the bear count bottom than to a short term top. Everyone dreams of loading up on cheap miners at low risk at a long term bottom.
THAM
Now that wave iii is near target???
How deep corrective iv to be expected?
You mean minute 3, I presume. The movement looks more and more like minute 3 is completing soon.
Minor 1 is a leading diagonal, and so minute 4 must enter wave 1 territory (between 1224.35 and 1131.09. In a pinch, it has to go below 1224.35.
If the leading diagonal that Lara propounded is correct, there is an opportunity to buy some DUST at the top of minute 3.
Mark, what’s your stop on GDX?
When resistance is no longer in control. This is the time to be short the GDX although most don’t understand the favorable risk/reward setup of selling resistance and buying support because emotionally it “feels” like you’re swimming against the current when in fact you know straight away if you’re wrong and take a small loss and make out with huge gains if you’re right.
USD has made perfect 38% retrace of the huge move up and structurally is reversing. All PM shares are butting up against and being rejected by resistance. This is where you short/sell, not go long according my own personal playbook. I don’t daytrade…I’m not going for a scalp or a 2-3 day swing trade.
Mark, that makes a lot of sense.
Thank you for your response here to MTLSD. Your comments set my perspective at rest –
Mark, you stated “USD has made perfect 38% retrace of the huge move up and structurally is reversing.” Curious why you think it will not move lower, say to the .618%, or opposite trend line before complete reverse?
It could certainly move lower but I think we can all agree the $USD uptrend is very strong and shallow retraces often happen in that context. It would certainly be consistent with a powerful uptrend.
Is wave iii already complete here at 1223??? Now deep wave iv correction to follow?
Price movement in minuette 4 has gone above the beginning of the wave. I have the count so far as 1218.97 – 1212.42 – 1219.96. The overshoot is very close to 1.146. If this is a simple expanded flat, the c wave at 1.618 retrace would see 1209.36. This should occur by the end of today, if not tomorrow.
The release of the Wholesale Prices and Jobless Claims reports triggered a small spike in gold prices to 1222.22. So now, the b wave is at 1.50 retrace, and c should correspondingly fall by 2.618 to 1205 thereabouts. The b wave ought to have completed now as the spike traces a spinning top candlestick pattern.
Again, volume on the rise is greater than that for the drop, albeit rather small due to the fact that it is pre-market.
The rise above 1224.35 meant that minuette 4 was a very shallow drop to 1212.42. The alternative is that minuette 3 was not at yesterday’s high at 1218.97 but is still continuing. I’ll wait for the move to unfold more before drawing a conclusion.
Thanks, Keep us posted.
Soon USD will turn from here. It is at support level 93.00ish.
Another long term chart breakout is has happen from a wedge and USD is backtesting the BO.
Gold via GDX has enjoyed upturn since Mar 11th, same time as US$$ began correction(Mar 16th). XAU upturned since Mar 18th.
US$$ heading down tonite and so also gold is heading up. $$ has lots of down room
We’ll see if gold takes a turn and goes down on Thursday. I was thinking so before I saw dollar continuing down
And how convenient, we have basically 5 trading days before next FOMC. Bet anyone $1.00 the US$$ is at bottom of its daily trendline by the news release… That would put gold at a top? Just a thought.
Super indicator guy predicts gold price will drop Thursday. But overall GDX is still following path of higher highs.
How low will the drop be?
Apparently so far he was wrong, although who knows by day end? I am sure glad I sold my DUST yesterday, it got knocked down 6% today, ouch.
Technically, he was correct. Gold did fall today, although by a very tiny amount. Only thing, he did not mention that it will rise thereafter.
You are correct. The important thing is that he is excellent with nimble trades intraday whether 10 minutes or 3 hours. Often he does multiple trades in the mornings, while hanging onto a longer multlday trade.
If a trader can be nimble with a high success rate, they will make a lot of money and he does both. I was offered an opportunity to invest with him for a guaranteed 100% profit within 6 months. He ended up with 100% profit in 3 months. I didn’t trade due to several factors, unfortunately for me.
Somewhat devastated by Gold price move through 1208-15 taking the wind out of the sails for the bearish set-up….. Again today expecting Gold price to rally / good upward move for possible 1225+; I suppose on continuation to the upside the logical place for Gold price to go would be 50% of 1345/1131 at 1238-39….. A downside reversal of sorts is sensed but Gold price appears bottomy at 1195-90; looking to close shorts and initiate longs….
Syed, you are right in the movement so far. I reckon, in a very volatile market, it is better to focus on the bigger picture, and not try to outguess the market.
I want to thank Tham for his intraday comments and guidance.
I want to thank Lara for her end of day comments and guidance.
The only thing better than having Lara would be to have her charts and more guidance intraday. Maybe one day she might move from her ocean front paradise to an ocean front paradise in the EST zone. I would pay extra for that.
Thank you Richard for your kind comments.
I believe that we small fish ought to help one another along and get some gains off the big guys. For many of us, it is a source of income. For them, it is just adding to their stash. Whatever I can contribute I will choose to do so.
Fantastic$$$
I would second your sentiments wholeheartedly for the contribution by TKL which is of great help. Thank you TKL, keep up the good work and all of us inspired!
Thank you Syed. I too love your posts. You give us a good idea of the resistance and support levels so that we can frame our longer term (a few hours) trades. Your posts are greatly appreciated.
I too love Tham’s guidance intraday. He posts honest assessments right when they are needed most– which is most helpful. Always wishing him the best of trades. I hope to one day have better skill so I can add insight as a team player here.
Thanks for your compliments. It is nice to have you as a friend.
You’re welcome. I have learnt when we publicly recognize people’s skills and abilities, they thrive and excel.
I have used it to dramatically turn around many co-workers within 60 days so the team I was on would always end up among the best in the whole company even against 20 teams and our team was happy. Life is an eternal opportunity for appreciation, which is the same vibration as love, peace, joy! We are all one. When we love others we love ourself.
Well said. Positive strokes, done with sincerity, always brings out the best in others. In my work, little acts of appreciation for the efforts put in by my subordinates, coupled with the impression they have that I am always available to give a helping hand, do bring out the best in them.
Thank you Tham for your continued assistance and sharing with the membership! So greatly appreciated by all.
Love your attitude Richard, and yes, your positive comments often buoy me up when the market is difficult. It’s the positivity from members which keeps me going and wanting to be a better analyst. So THANK YOU for your positivity.
Hopefully I get some surf this weekend and reconnect with my soul. It always calms me and helps my work.
Have a great weekend everyone!
Lara
You’re welcome. Your comment moved me to tears of joy. We have endless opportunities to uplift others in simple ways that may have a big effect on them. When we do we are also uplifted ourselves.
Was out and about most of the day but nice to see the movement up. Still 90% long, may leave it that way and not add the last 10%.
Good Luck Everyone.
Super indicator guy advised he will stay with trading JNUG/NUGT on dips, bullish view until Gold RSI hits overbought territory (>70).
I am going to take RSI more seriously again. Was too sloppy accepting a mid-range number. It is more comfortable to trade (a reversal) if markets are solidly above 70 or below 30.
It definitely is important and an essential overbought/oversold indicator for decisions in reversal territory. Super indicator guy has been bullish gold since March lows and said buying JDST was a mistake and he luckily did some quick trades today to get himself out of that lose.
Ridiculous .
I don’t think so. I respect anyone who uses any system or tools to trade. It does not matter what method you use as long as it earns you money (legitimately, provided you do not control or manipulate the market). The late Mao Tse Tung had once said “Black cat or white cat, it doesn’t matter. Any cat that catches mice is a good cat”.
I use RSI and Stochastics inter-day to monitor the trend. EW gives an extremely good road map; no other system I know of can so confidently predict future high probability targets. Candlesticks pinpoint entries and exits. This combination has worked excellently for me, and made me lots of money. I am not going to quarrel with that.
I know – I think what is ridiculous is super indicator guy (i thought he was called deep voice) is foofoo buying JDST here 6 hrs ago, but Richard says 3 hrs later that super indicator guy predicts gold going down tomorrow. Well for sure the one thing i know is you don’t want to buy a bull etf if price is dropping, you want a bear etf — unless you need a major tax write off !
I have a different perspective. This is an extremely volatile market. What is correct at a point in time can suddenly make an about turn. It takes a lot of guts to trade in this situation, especially if you throw in huge sums of money. Now, the ability to recognise an intraday reversal and quickly act on it is the hallmark of a successful trader. There is no point in hanging onto a loser and let losses snowball.
I can see the longer term trend play out. but whimsical changes often throwback at all good plans. You may have noticed I changed my plan two times yesterday. Nimble trades are the ones that matter. When I saw the fifth wave playing out longer than it ought to, I quickly bought in NUGT and sold it off 3 hours later for a tidy profit. The super indicator guy has much more resources, and his stakes are so much higher. It behoves him to be correct. Otherwise, it could be disastrous for him. But does he need to broadcast his every trade to all and sundry?
good point. guess the way it was posted didn’t realize the super guy was being nimble. Came across to me like Richard/his friend was contradicting themselves. But then I’m sure I do it too.
For Richard– No harm meant Richard. Its just you do confuse me sometimes with what
the super indicator guy is doing. And I do appreciate your posts often
– you ask the right questions and your sharing is appreciated. But please, keep the contradictions down to a minimum. Only nimbleness. we are swooning in bull/bear daily.
Congrats on having been bullish today.