
More upwards movement was allowed for as part of a fourth wave correction, but it’s more than expected. The third wave moved higher.
Summary: I have the same two wave counts. The bull wave count now has two hourly options: minute wave iii may be complete as a zigzag and minute wave iv may move lower for several days to a maximum at 1,173.13. Alternatively, minute wave iii may continue higher as an impulse, but a small fourth wave should unfold sideways first for a few days. The bear wave count also expects a small fourth wave to unfold sideways for a few days, and the invalidation point is at 1,200.03.
Click on charts to enlarge.
To see weekly charts for bull and bear wave counts go here.
Bull Wave Count
The bull wave count sees primary wave 5 and so cycle wave a a complete five wave impulse on the weekly chart.
Pros:
1. The size of the upwards move labelled here intermediate wave (A) looks right for a new bull trend at the weekly chart level.
2. The downwards wave labelled intermediate wave (B) looks best as a three.
3. The small breach of the channel about cycle wave a on the weekly chart would be the first indication that cycle wave a is over and cycle wave b has begun.
Cons:
1. Within intermediate wave (3) of primary wave 5 (now off to the left of this chart), to see this as a five wave impulse requires either gross disproportion and lack of alternation between minor waves 2 and 4 or a very rare running flat which does not subdivide well.
2. Intermediate wave (5) of primary wave 5 (now off to the left of the chart) has a count of seven which means either minor wave 3 or 5 looks like a three on the daily chart.
3. Expanding leading diagonals are are not very common (the contracting variety is more common).
4. The possible leading diagonal for minor wave 1 and particularly minute wave ii within it look too large.
For the last three days, volume shows an increase. This supports the bull count a little, but the increase is not higher than prior down days within the sideways chop. For volume to clearly support the bull wave count it needs to show an increase beyond 187.34 (30th April) and preferably beyond 230.3 (9th April). Only then would volume more clearly indicate a bullish breakout is more likely than a bearish breakout.
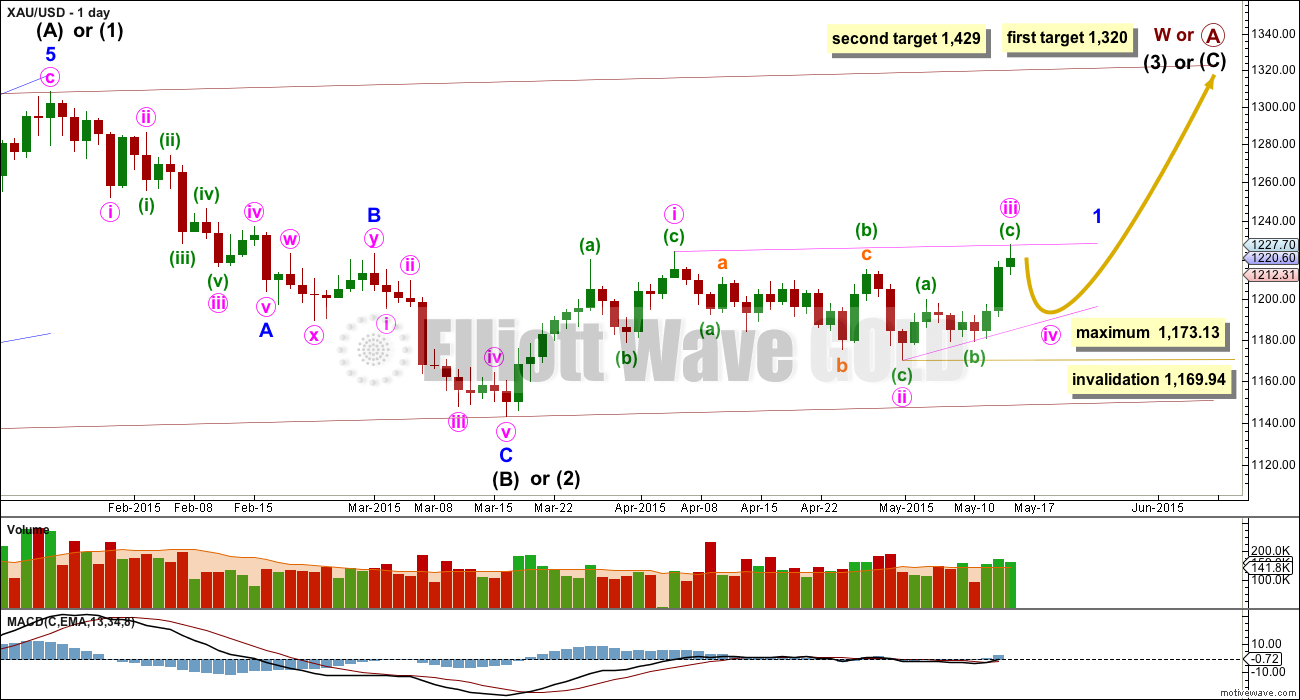
Within cycle wave b primary wave A may be either a three or a five wave structure. So far within cycle wave b there is a 5-3 and an incomplete 5 up. This may be intermediate waves (A)-(B)-(C) for a zigzag for primary wave A, or may also be intermediate waves (1)-(2)-(3) for an impulse for primary wave A.
Intermediate wave (A) subdivides only as a five. I cannot see a solution where this movement subdivides as a three and meets all Elliott wave rules (with the sole exception of a very rare triple zigzag which does not look right). This means that intermediate wave (B) may not move beyond the start of intermediate wave (A) below 1,131.09. That is why 1,131.09 is final confirmation for the bear wave count at the daily and weekly chart level.
Intermediate wave (B) is a complete zigzag. Because intermediate wave (A) was a leading diagonal it is likely that intermediate wave (C) will subdivide as an impulse to exhibit structural alternation. If this intermediate wave up is intermediate wave (3) it may only subdivide as an impulse.
At 1,320 intermediate wave (C) would reach equality in length with intermediate wave (A), and would probably end at the upper edge of the maroon channel. At 1,429 intermediate wave (C) or (3) would reach 1.618 the length of intermediate wave (A) or (1). If this target is met it would most likely be by a third wave and intermediate wave (C) would most likely be subdividing as a five wave impulse.
It is possible that the intermediate degree movement up for the bull wave count is beginning with a leading diagonal in a first wave position for minor wave 1.
A leading diagonal must have second and fourth waves which subdivide as zigzags. The first, third and fifth waves are most commonly zigzags but sometimes they may be impulses.
Within diagonals the most common depth of the second and fourth waves is between 0.66 and 0.81. Minute wave ii is 0.67 of minute wave i.
Because minute wave iii is more likely to be a zigzag than an impulse it is possible that it is over now and shorter than minute wave i. This means minute wave iv should move lower as a zigzag, to last maybe five or eight days, and not be longer than equality with minute wave ii at 1,173.13. Minute wave iv must overlap back into minute wave i price territory (which it has already) and may not move beyond the end of minute wave ii below 1,169.94.
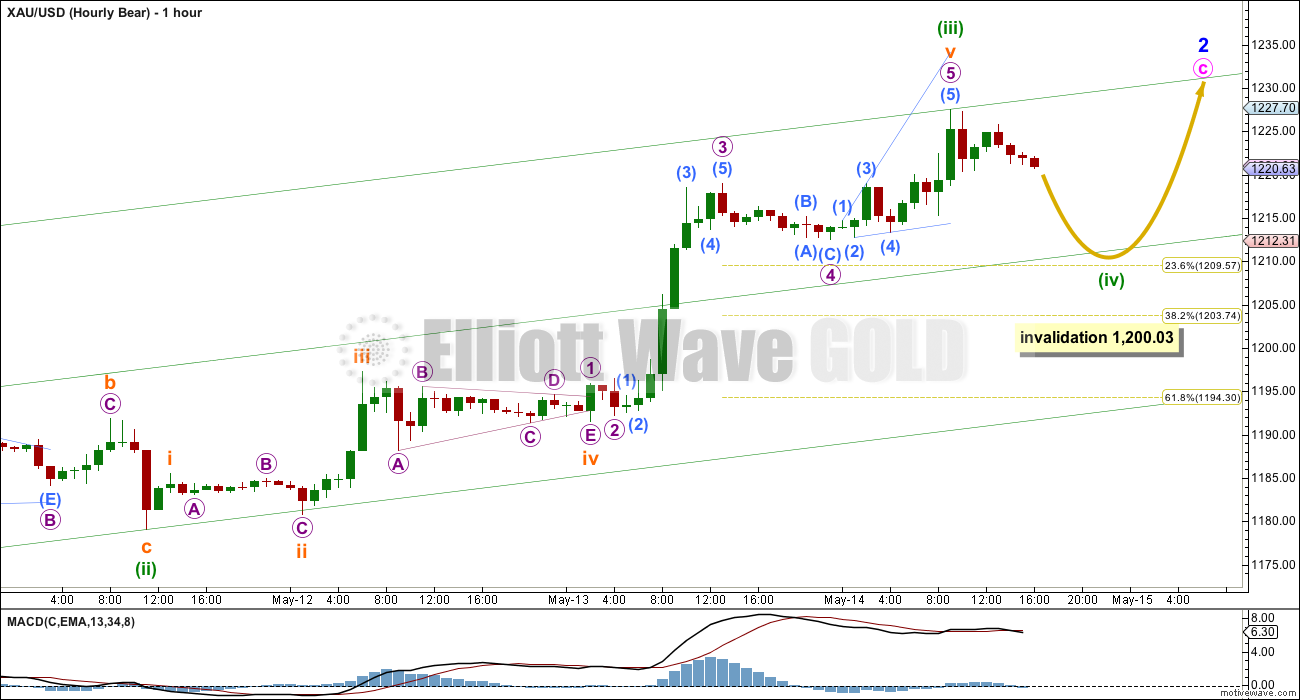
Main Bull Hourly Wave Count
Within a leading diagonal, the first, third and fifth waves are most commonly zigzags, but they may also be impulses. Both structural possibilities must be considered, with the zigzag possibility more likely.
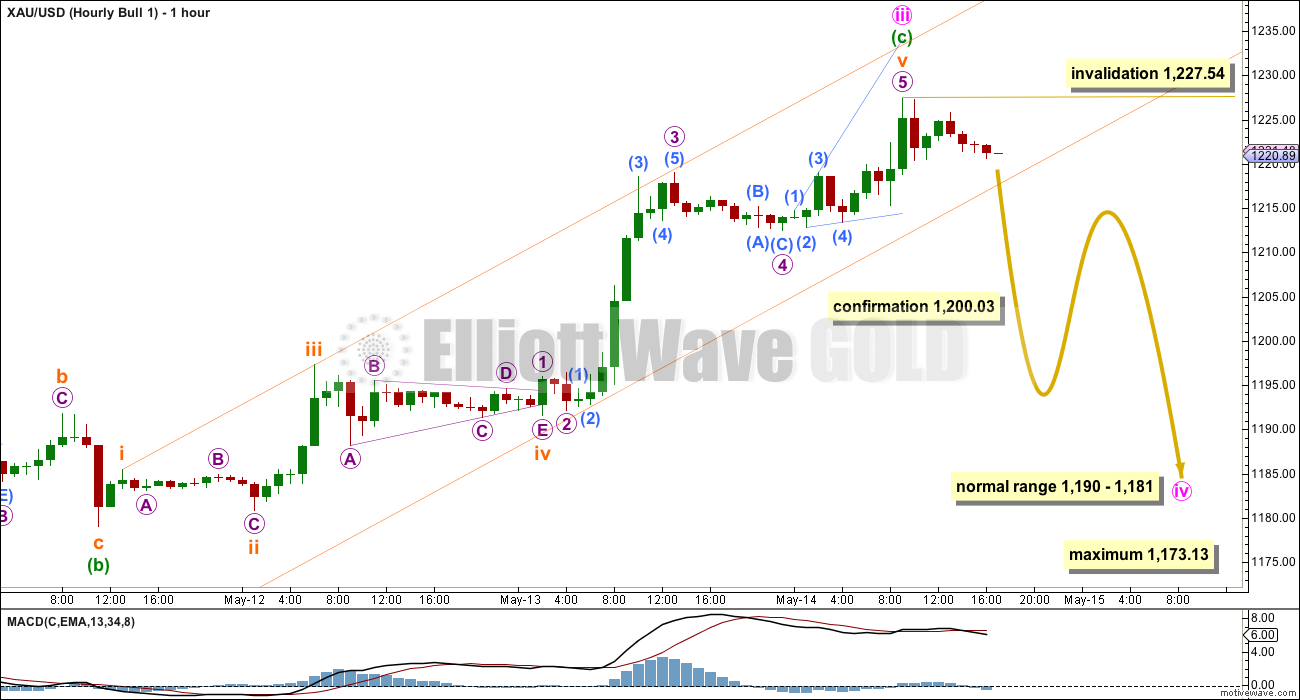
The impulse upwards for minuette wave (c) moved higher, and is now just 0.18 short of 1.618 the length of minuette wave (a). Because there is such a close Fibonacci ratio I am reasonably confident that this impulse is over here and a small consolidation should unfold sideways for a few days.
For this bull wave count minute wave iv should show up very clearly on the daily chart as a three wave zigzag. It may last either a Fibonacci five or eight days. It may not be longer than equality in length with minute wave ii because the diagonal is contracting and the maximum limit is at 1,173.13.
The normal depth for second and fourth wave corrections within diagonals is between 0.66 to 0.81 the prior actionary wave. This gives a range for minute wave iv between 1,190 – 1,181.
Minute wave iv must subdivide as a zigzag, and within it the B wave may not move beyond the start of the A wave above 1,227.54.
A new low below 1,200.03 would invalidate the alternate hourly bull wave count below (and the hourly bear wave count) providing confirmation for this main hourly bull wave count.
Alternate Bull Hourly Wave Count
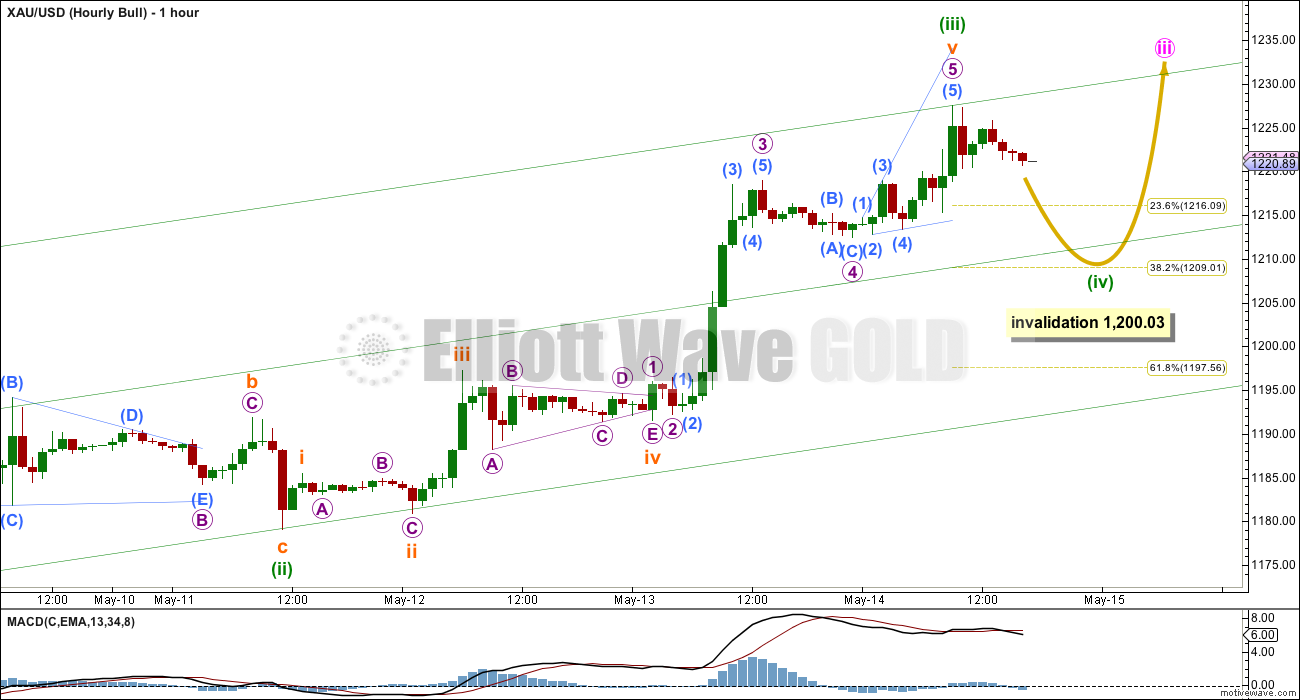
Within a leading diagonal, the first, third and fifth waves may also be impulses. If one of these actionary waves is an impulse it is usually the third wave, so this alternate wave count must be seriously considered.
In the short term a small fourth wave correction should unfold sideways. It should show alternation with the deep 0.70 zigzag of minuette wave (ii). Minuette wave (iv) should be a shallow correction, ending at either the 0.236 or 0.382 Fibonacci ratios. It is most likely to be a flat, combination or triangle. These structures may include a new high beyond its start above 1,227.54 as in an expanded flat, running triangle or an X wave within a combination. A new high above 1,227.54 would invalidate the main hourly wave count and confirm this alternate.
Minuette wave (ii) lasted four days. Minuette wave (iv) may last at least three days, may be as long as five or eight days duration, and may not move into minuette wave (i) price territory below 1,200.03.
Although a zigzag is the more likely structure for minute wave iii (main hourly wave count), it would give this diagonal a clearer look if minute wave iii did continue higher. The upper i-iii trend line would have a clear slope.
Bear Wave Count
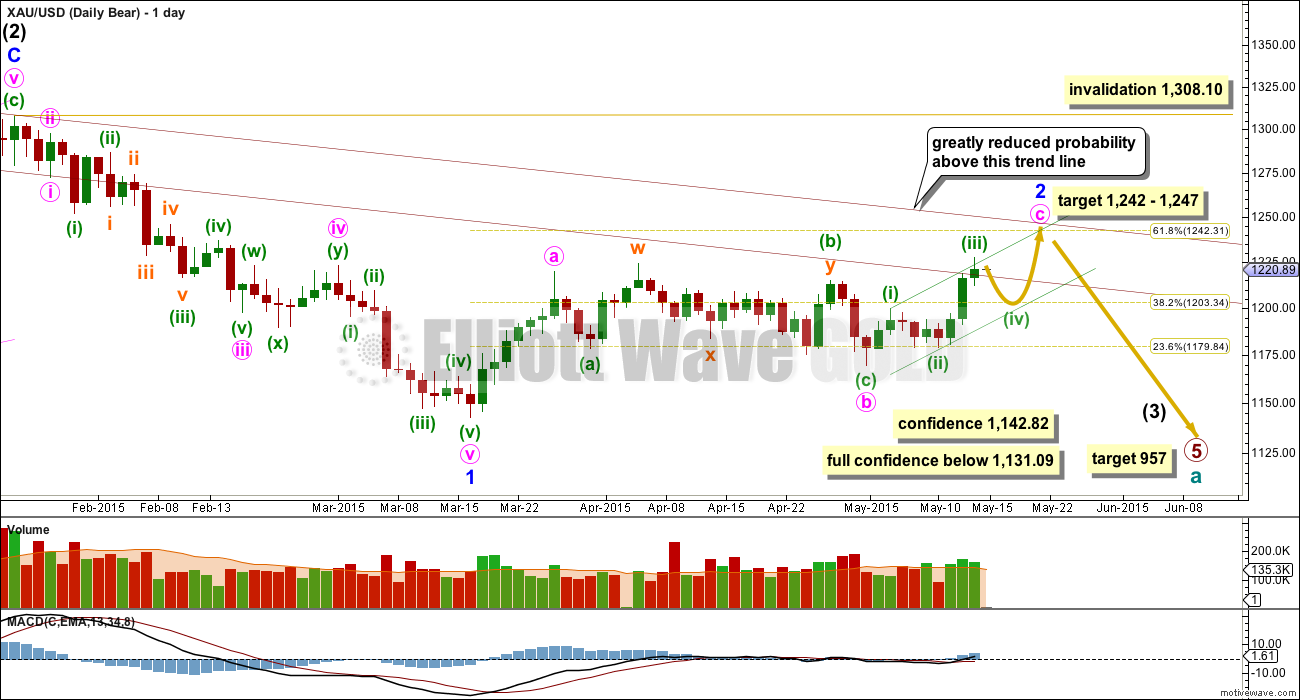
This wave count follows the bear weekly count which sees primary wave 5 within cycle wave a as incomplete. At 957 primary wave 5 would reach equality in length with primary wave 1.
Pros:
1. Intermediate wave (1) (to the left of this chart) subdivides perfectly as a five wave impulse with good Fibonacci ratios in price and time. There is perfect alternation and proportion between minor waves 2 and 4.
2. Intermediate wave (2) is a very common expanded flat correction. This sees minor wave C an ending expanding diagonal which is more common than a leading expanding diagonal.
3. Minor wave B within the expanded flat subdivides perfectly as a zigzag.
Cons:
1. Intermediate wave (2) looks too big on the weekly chart.
2. Intermediate wave (2) has breached the channel from the weekly chart which contains cycle wave a.
3. Minor wave 2 is much longer in duration than a minor degree correction within an intermediate impulse normally is for Gold. Normally a minor degree second wave within a third wave should last only about 20 days maximum. This one is in its 41st day and it is incomplete.
4. Within minor wave 1 down there is gross disproportion between minute waves iv and ii: minute wave iv is more than 13 times the duration of minute wave i, giving this downwards wave a three wave look.
This bear wave count now needs minute wave c upwards to complete as a five wave impulse. The short term outlook is exactly the same as the bull alternate hourly wave count, and the subdivisions on the hourly chart are exactly the same.
At 1,247 minute wave c would reach equality in length with minute wave a. Minor wave 2 would be very close to the 0.618 Fibonacci ratio at 1,242.
Minor wave 2 may not move beyond the start of minor wave 1 above 1,308.10. However, this wave count would be substantially reduced in probability well before that price point is passed. A breach of the upper maroon trend line, a parallel copy of the upper edge of the channel copied over from the weekly chart, would see the probability of this wave count reduced so much it may no longer be published before price finally invalidates it.
The hourly chart for the bear count is the same as the alternate hourly chart today for the bull count. They both expect sideways movement for a consolidation for one to five days, to be followed by a fifth wave up.
Technical Analysis
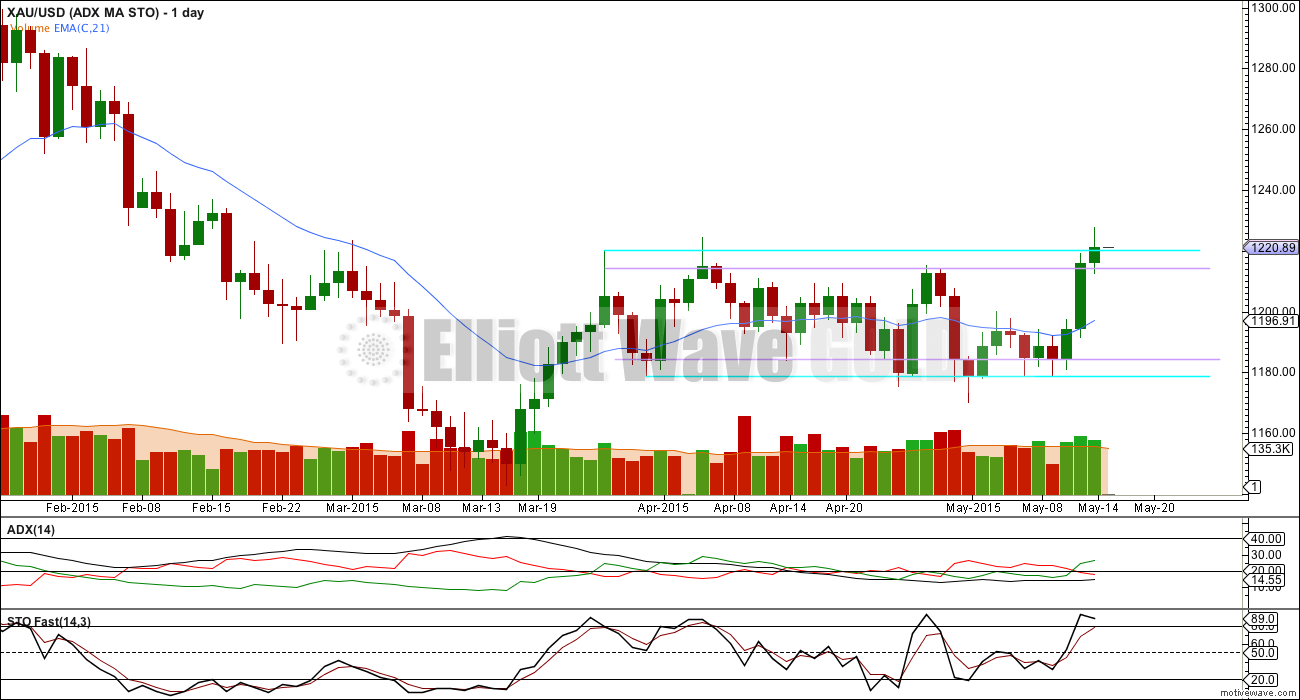
Markets do one of two things: they are either trading (sideways) or trending. Therefore, different technical analysis approaches are required for these two different scenarios.
Since 27th March Gold has been trending. This chart outlines one possible TA approach to a trending market. It follows the idea outlined in Kirkpatrick and Dhalquist, “Technical Analysis”, second edition, page 443.
On the 27th March ADX was declining and dropped below 30. This indicated a trading market, and that an oscillator should be used to indicate support and resistance. I have chosen fast Stochastics with default settings. Also, I have added upper and lower trend lines to the price chart, from the first high and low of this range with upper and lower bands of 5% of market value.
While ADX is below 20 and declining or flat, the approach would be to wait until two conditions to be met:
1. Price needs to be within the upper or lower 5% bands of the sideways range.
2. Stochastics needs to be over 80 or below 20
When these two conditions are met it should indicate either a high or a low within the range.
If this approach is continued to the situation today ADX is flat and below 20. This indicates still low volatility, very short swings, and no trend. Although price has overshot the upper trend line it has not breached with a close of 3% or more of market value. For the market to be clearly trending up ADX must be rising at least above 15. The addition of trend lines to the sideways range gives another rule: a close of 3% or more of market value above or below the outer trend lines (aqua blue) indicates a breakout in that direction and the development of a new trend.
The situation today using this approach expects a downwards move from here.
This approach should be discarded and a trend following system used when ADX is rising and above 15. That may be the first indication of a new trend. At that stage a moving average and a trend following system should be employed.
Before employing any system as the one outlined above, it is essential to test it on a data range which includes up, down and sideways price movements. As always, good money management and risk management is essential, and will make the difference between profit and loss.
For this trending period in Gold since 27th March the method outlined above would have worked well so far. This is because the trending period is sideways and is not skewed up or down. If it had been skewed up or down the addition of the trend lines may have turned an otherwise profitable approach into a loss.
At this stage for Gold the trend is clearly sideways so the trend lines may be used in this instance to assist in identifying a breakout.
This analysis is published about 06:30 p.m. EST.
On the five minute chart I can see a completed corrective wave count up, this would fit for a B wave, but very importantly a channel about this movement is breached by only 1 five minute candlestick below it (when it’s drawn very conservatively). There’s just not enough downwards movement at the moment to confirm that the upwards wave of the last 9 hours is over. It looks pretty good…. but not enough confirmation at this stage. It most certainly could continue higher, and may even make a new high above 1,227.54 before turning down for a C wave.
GDX 7-day trendline broke on the intraday charts. I’ve shown below on the 15-min. I would expect at least a corrective retrace to 50% backfilling the gap at 20.25.
For the alternate bull wave count and the bear wave count at the hourly chart level I would see only subminuette wave a almost complete. I would label this move down as micro wave A (reaching just above the 0.236 Fibonacci ratio) complete, micro wave B may be complete (but could certainly move higher) and micro wave C down needs to unfold to move at least slightly below the end of micro wave A at 1,211.11.
I would label it at this lower wave degree than you all are considering, because I would expect minuette wave (iv) to last about 3 or 5 days total. Not just 2. And I would expect to see at least one red candlestick or red doji on the daily chart for it.
That will give this five up the “right look” at the daily chart level.
So overall for all wave counts downwards movement for a C wave on Monday, a red candlestick on Monday, followed by one or three more days of choppy overlapping sideways movement. More likely three… but we shall see.
Gold weekly closing over the 200DMA.
And closing above that long held trend line I have on the weekly chart.
Fabulous!
you mean gold daily above 200MA correct?
Sorry, yes. Closed the WEEK above the DAILY 200ma.
Ok, that’s what I saw as well. And reviewing the charts I could see gold not having trendline resistance until near 1250. I do see other resistance at current levels however but the trendline above is the most obvious.
That’s the line in the sand alright!
Tham K L
Will you hold DUST over weekend?
“Yes. I bought at 11.61 “
I believe gold started a C wave down. It looks fairly straightforward to me. Let’s see if Lara concurs.
Matt, are you believing in Bear daily ? How do you see the next week playing out?
Yes. It will take a few days for gold to get up to the 1240s – might be next week, but more likely a little longer (last week of May). Weds at 2pm EST the FOMC meeting minutes are published, so that could jolt the markets one way or another. Should gold drop back toward today’s low, it seems like a good opportunity for a small play on the long side. I think that gold will drop again because the 4th wave would otherwise be too short in duration. After gold gets to 1240, I would personally get out fast and strongly consider entering longer term short positions.
I guess I don’t see any compelling reason gold must move to 1240 although I don’t trade gold directly and am more interested in the miners. The resistance on the GDX and HUI seem to suggest that the mid 1220s is a really strong resistance area for gold.
Since gold broke the previous high, it has proven that it wants to go higher than the 1220s.
To say this again more clearly, I think that gold will go down to 1210 area (give or take) early next week. Then the climb to 1240s should begin.
I think the triangle in today’s analysis (alt hourly bull) looks best of all. So gold may only go down to the low teens before bouncing sideways and eventually heading higher. I am still convinced of the daily bear though.
When Lara comes online, let’s see if she confirms that the C wave has indeed begun. If it has, it is safe to hold over the weekend as the wave would take at least one day to play out.
I know that now is a good time to buy DUST, however due to it being a Friday 1 hour before weekend close and gold right at the edge of rangebound drop down or else a breakout above the upper limits of the range. I won’t buy DUST as don’t like holding 3 X ETF over the weekend, as increased risks. I am holding no gold investments at this time and will buy on Monday. I am getting mixed signals to go long by some pro traders and short by others, so get on the fence for the weekend. Prosperous trading to everyone.
Composite indicators seem to indicate playing to a three outside up, strengthening to the upside from CMP 1224 basing off 1222 to take out 1226+; hard to say how high this will go, three black crows have been seen around too…. Generally with a high range close, further upside continuation can be expected on the following day….
Here is a trader who has a unique strategy for 3xetf PM.: He has been using this for some times since 2014. and works for him.
Pendulum Strategy:
(approximately a 5 to 9 week trading strategy) EXAMPLE (Accumulate shares of DUST/NUGT when down more than 54.8% (average) from it’s recent top. Ride DUST/NUGT until the opposite ETF is down plus 54.8%% and begin ccumulating the opposite ETF) Rinse and repeat … However ease in as 82% down is an outlier and possible.
Remember, true pendulum reversals more than not begin with an unmistakable drop that leaves little doubt. Let’s just say a 7 on the Richter scale or higher
================
He just yesterday started the other way:
Dust is down 52.50% from the high of it’s last up wave and the
average is 54.40%. DUST came within .40 cents of the top of my target range of 10.70. NUGT has had a 74% move up. Tomorrow is exactly 9 weeks in NUGT’s move up and that’s the high side of the range. (there are outliers however) NUGT went outside the top of it’s daily bollinger band and then came back down. Is this the end of the run? Maybe is all I can
say. Sold my NUGT and am net long DUST for a bit as I sense NUGT will settle back inside of it’s BB range for a few days even if there is another up move.
It looks like gold finished it’s minor drop today at low of 1211.10 at 6:06 am and been climbing since.
High of the day is 1226.27 at 1:34 pm.
There may be a five wave count there now?
Is that it for today? Does gold drop from here or will gold today exceed Thursday’s high of the day of 1227.54 at 10:20 am?
I think the target is higher, around 1240-1250, I’m not very good at pointing out exact targets
Yes there is a higher target above for another day however as per Tham two comments below there is now a C wave down opportunity to buy DUST.
If gold has not topped already, rising above 1227.57 would invalidate the bull count.
Hi. which wave is Gold price in now: Alternate Bull Hourly or Bear Hourly? With 1211-10 holding I would not go chasing Gold price with a Buy at 1222-24 levels not so close to the upper band and not with the daily StochRSI %K tagging 100 with %D in close pursuit…. I would rather look for an opportunity to short this at 1225+….. Quite likely a lot of bulls are going to get caught off-guard lol…. 🙂
Hi Syed. This is how I see the situation so far.
Wave 4 (minute for bull, and minuette for the bull alternate and the bear) is underway. Lara says this must be a zigzag, and so it must subdivide 5-3-5.
For simplicity of discussion in reference to waves, the following discussion will be based on the the bull alternate / bear, hence minuette 4. The discussion applies equally to the bull, only one degree higher.
I can see five waves for subwave A, that is, subminuette A ending at 1211.10.
Subminuette B is unfolding. The first two subwaves are complete. The third subwave must comprise 5 waves. The first three are complete, and the fourth is underway. Once this completes, a fifth subwave is needed. I estimated this should end around 1225-1226.
Subminuette C should not drop below 1200, unless it is very strong. This means the movement favours the alternate bull / bear.
TKL: Thank you very much for clarifying. At this point gold price is the one doing the talking lol, I would just like to try and walk along with it…! Basically the drop today stopped just short of 100dma (1210-09) and price kept bouncing for a while between 100dma and 200dma (1219-20)…. What is needed really is a break below 100dma and then 5dma (1208-07) and subsequently 1200 where on the downside is seen bottomy at 1195-90… Lets see how this plays out!
My best guess is that it will drop in the C wave.
Gold appears to have topped at 1226.27.
If I am right, it should begin its descent now in Wave C.
TKL
Which of Lara’s hour wave is in play currently?
The short reply is all of them. But, as I discussed with Syed, the target for the C wave should obviously be less than 1211.10 (the end of Wave A). Unless the C wave is very strong, it should not go below 1200, which means the alternate bull and bear are more favoured. These two scenarios will not diverge for quite some time.
Tham, as per your two comments above it is now time to buy DUST for the drop down since gold peaked at 1226.27 at 1:34. Thank you.
Yes. I bought at 11.61.
” I estimated this should end around 1225-1226.”
That means retest of yesterday’s top 1227. Is that right?????
Not exactly. I would say just getting close. The high so far is 1224.47, and so the fifth wave must rise higher, unless it is truncated. I think I am correct this time because the ongoing movement after 1224.47 looks like a triangle and not the first wave of C down.
Still waiting for GDX 21.50 it’s been a lot slower than I thought.
That’s been my first profit taking target also.
I was hoping for higher numbers, but now I’m thinking more 21.50-22.00 range. I keep my mind open for a surprise on the upside, but I don’t want to dream about it.
You guys are expecting some serious resistance to be broken in order to hit those targets. In the meantime, GDX may be making an island top on the daily charts and charts like DUST are starting to look accordingly like island bottoms with huge volume. Different opinions is what makes a market! Good luck to all.
Some have already called the resistance broken. Depends on how you draw the line I guess. Lots of options expiring worthless today between $20.75 and $21.25 on GDX today.
GDX thoughts….
I don’t see any downtrend break in the GDX.
HUI looks same.
This one looks nice when you update it.
Is it updated…I just left my notes on there from 4/28. Check the date….it’s today.
NEM is up another $0.50 today.
Richard
I read your comment to my post on TSI momentum indicator late.
It is not complicated. The chart is very busy with comments for instructions.
Many on another forum picked up DUST and JDST yesterday with few cents of the bottom using this indicator.
More later.
Bears got the sell-off/correction they asked for, let’s see how low they are able to take the price.
Lara. The inclusion of some TA in your analysis is a very welcome addition. In these trying times of a trading non-trending market, most of us feel frustrated in that we have to monitor our every trade very closely, and be ever ready to bail out or cash in profits at short notice. In the majority of trades, positions are closed and not left overnight. Most will use very small positions for security. Everone is trying his or her best to weather the storm. So, the assurance of the larger framework provides a sturdy anchor and gives greater confidence, especially in being able to tell whether there is likely to be a change in trend. A big thank you for this value addition.
Brilliant, 2 Thumbs Up, 5 Star Rating for your 6th chart today.
Lara I really enjoyed your explanation of your chart – “Technical Analysis”.
I can tell it’s going to help us and I thank you for that addition.
You’re welcome Richard.
Richard, papudi. My apologies. Lara did manage to count five waves from the low of 1212.42 to 1227.54. You are right in that the movement topped at 1227.54. Richard, hopefully you followed your gut feelings and went ahead to buy DUST.