
Yesterday’s Elliott wave analysis had three hourly wave counts for three different structures for this small fourth wave correction. The triangle was invalidated below 1,211.11 and the combination never produced a B wave which was 90% or more of its A wave. This left only one structure, an expanded flat, with the target to end between 1,206 – 1,204. Price has reached down to 1,205.86.
Summary: It is most likely Gold will move up from here for a final fifth wave. I will have some confidence that the correction is over and the final fifth wave up is underway when price moves above 1,217.28. The target is at 1,236. If it is met in just one day this five wave impulse will total a Fibonacci 13 days or sessions. This is possible, or it may need two days to complete.
Click on charts to enlarge.
To see weekly charts for bull and bear wave counts go here.
Bull Wave Count
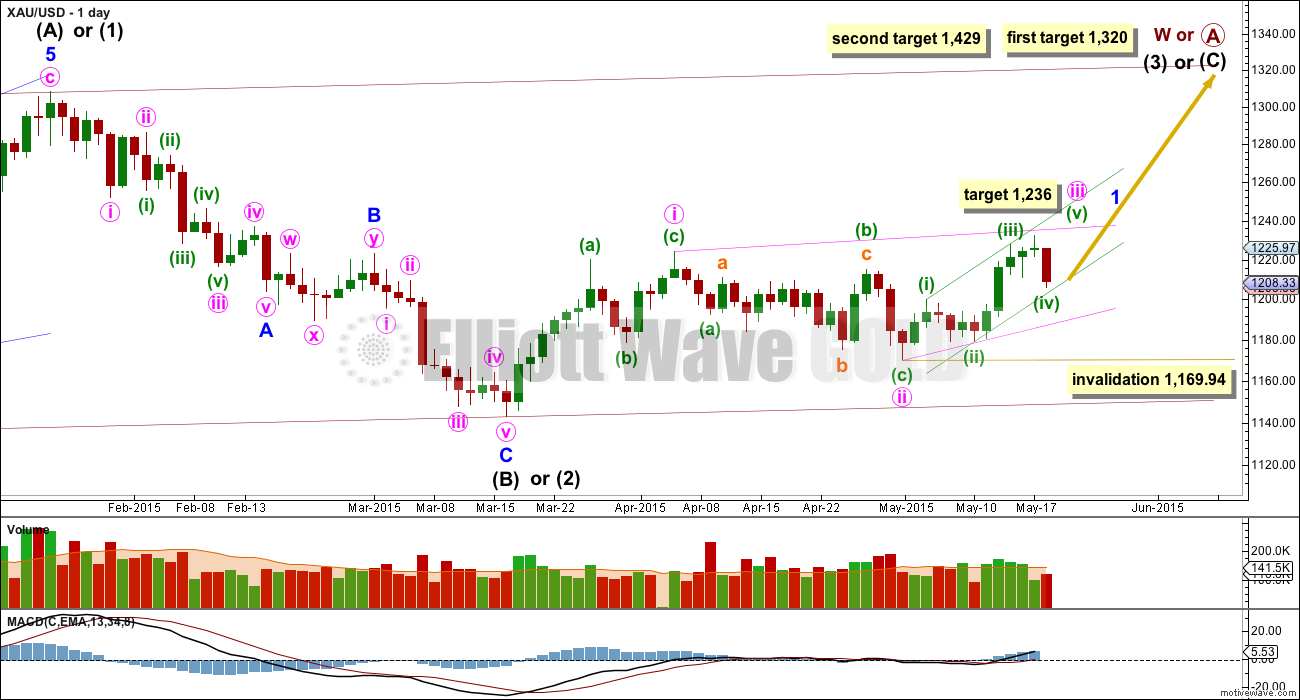
The bull wave count sees primary wave 5 and so cycle wave a a complete five wave impulse on the weekly chart.
Pros:
1. The size of the upwards move labelled here intermediate wave (A) looks right for a new bull trend at the weekly chart level.
2. The downwards wave labelled intermediate wave (B) looks best as a three.
3. The small breach of the channel about cycle wave a on the weekly chart would be the first indication that cycle wave a is over and cycle wave b has begun.
Cons:
1. Within intermediate wave (3) of primary wave 5 (now off to the left of this chart), to see this as a five wave impulse requires either gross disproportion and lack of alternation between minor waves 2 and 4 or a very rare running flat which does not subdivide well.
2. Intermediate wave (5) of primary wave 5 (now off to the left of the chart) has a count of seven which means either minor wave 3 or 5 looks like a three on the daily chart.
3. Expanding leading diagonals are are not very common (the contracting variety is more common).
4. The possible leading diagonal for minor wave 1 and particularly minute wave ii within it look too large.
Last week volume shows an increase. This supports the bull count a little, but the increase is not higher than prior down days within the sideways chop. For volume to clearly support the bull wave count it needs to show an increase beyond 187.34 (30th April) and preferably beyond 230.3 (9th April). Only then would volume more clearly indicate a bullish breakout is more likely than a bearish breakout.
Within cycle wave b, primary wave A may be either a three or a five wave structure. So far within cycle wave b there is a 5-3 and an incomplete 5 up. This may be intermediate waves (A)-(B)-(C) for a zigzag for primary wave A, or may also be intermediate waves (1)-(2)-(3) for an impulse for primary wave A. At 1,320 intermediate wave (C) would reach equality in length with intermediate wave (A) and primary wave A would most likely be a zigzag. At 1,429 intermediate wave (3) would reach 1.618 the length of intermediate wave (1) and primary wave A would most likely be an incomplete impulse.
Intermediate wave (A) subdivides only as a five. I cannot see a solution where this movement subdivides as a three and meets all Elliott wave rules (with the sole exception of a very rare triple zigzag which does not look right). This means that intermediate wave (B) may not move beyond the start of intermediate wave (A) below 1,131.09. That is why 1,131.09 is final confirmation for the bear wave count at the daily and weekly chart level.
Intermediate wave (B) is a complete zigzag. Because intermediate wave (A) was a leading diagonal it is likely that intermediate wave (C) will subdivide as an impulse to exhibit structural alternation. If this intermediate wave up is intermediate wave (3) it may only subdivide as an impulse.
It is possible that the intermediate degree movement up for the bull wave count is beginning with a leading diagonal in a first wave position for minor wave 1.
A leading diagonal must have second and fourth waves which subdivide as zigzags. The first, third and fifth waves are most commonly zigzags but sometimes they may be impulses.
Within diagonals, the most common depth of the second and fourth waves is between 0.66 and 0.81. Minute wave ii is 0.67 of minute wave i.
Minute wave iii is unfolding as an impulse and now only needs the final fifth wave up at minuette wave degree to complete. Minute wave iv to follow must overlap back into minute wave i price territory and may not move beyond the end of minute wave ii below 1,169.94.
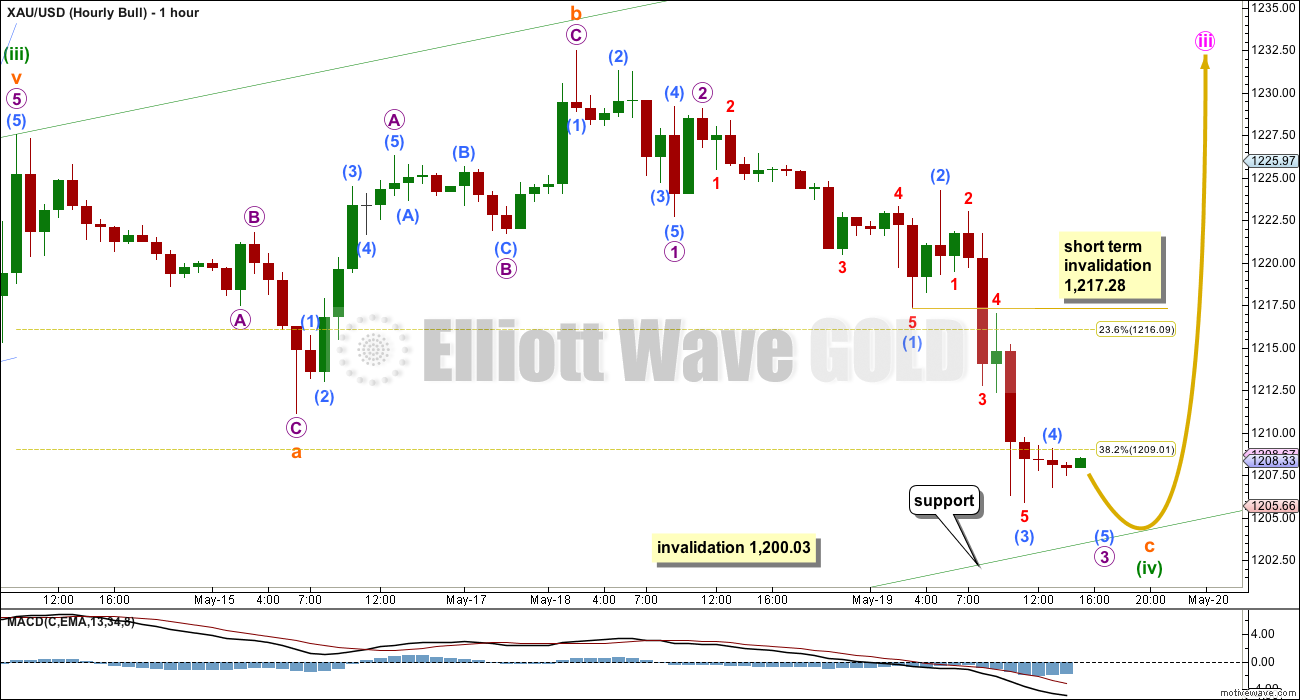
At the hourly chart level, both bull and bear wave counts see an expanded flat either complete now or very close to completion. Here I will publish an incomplete expanded flat while the hourly chart published under the bear wave count sees the structure complete. Both ideas work exactly the same for bull and bear wave counts.
In trying to see subminuette wave c incomplete the structure does not have as neat a fit as seeing it complete. The problem here is within minuscule wave 3 (red) of submicro wave (1): it does not subdivide easily on the hourly chart as an impulse.
Micro wave 2 was over already when last analysis was published. I had expected it to complete a little higher, but that did not happen.
Within micro wave 3, submicro wave (3) is 0.72 short of 1.618 the length of submicro wave (1).
Ratios within submicro wave (1) are: there is no Fibonacci ratio between minuscule waves 3 and 1, and minuscule wave 5 is 0.18 longer than 1.618 the length of minuscule wave 1. For this piece of movement the second idea presented for the hourly bear count has better Fibonacci ratios.
Ratios within submicro wave (3) are: minuscule wave 3 has no Fibonacci ratio to minuscule wave 1, and minuscule wave 5 is 0.91 longer than equality in length with minuscule wave 3.
Micro wave 3 is incomplete for this idea. At 1,203 it would reach 2.618 the length of micro wave 1.
I do not have a target for subminuette wave c for this idea. Subminuette wave c may not exhibit a Fibonacci ratio to subminuette wave a. The lower edge of the green channel copied over from the daily chart may be the best way to see when minuette wave (iv) ends. It should find strong support at the lower green trend line, and should end there.
Minuette wave (iv) may not move into minuette wave (i) price territory below 1,200.03.
What if I’m wrong? What if we see price move below 1,200.03 in the short term? This is the only scenario I can see at this stage which could explain such a move. For the bear wave count this idea will not work at all.
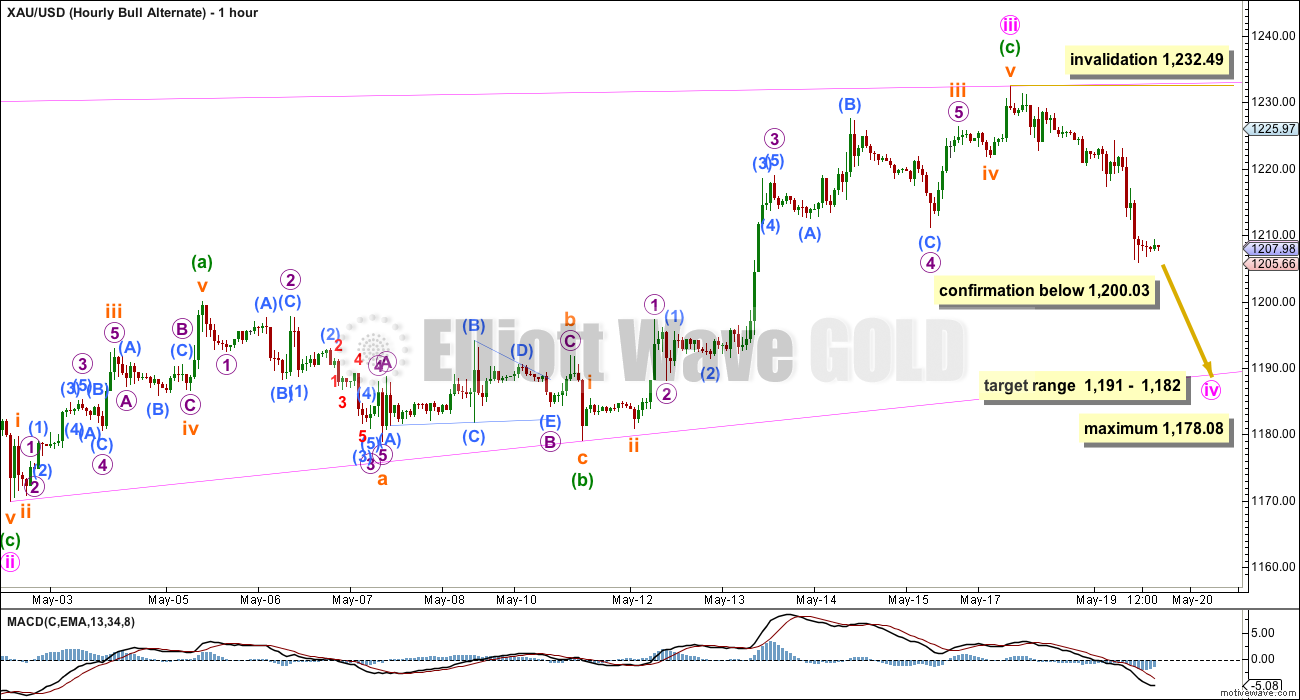
It is possible that minute wave iii of the leading diagonal is complete as a zigzag. It would be shorter than minute wave i and so the diagonal would be contracting. Minute wave iv may not move below 1,178.08, which gives it a maximum length at no longer than equality with minute wave ii. The diagonal trend lines should converge.
The most common depth of a fourth wave within a diagonal is between 0.66 to 0.81 the length of the third wave. This gives a target range at 1,191 – 1,182.
In trying to see minute wave iii as a complete zigzag there are a couple of problems introduced which the main bull count does not have for this movement. It must ignore a reasonably obvious triangle for micro wave 2 within minuette wave (c). A triangle may not be the sole corrective structure within a second wave.
Micro waves 2 and 4 have good alternation, but they are grossly disproportionate. Micro wave 4 is thirteen times the duration of micro wave 2. This reduces the probability of this count, but does not invalidate it.
If we see a new low below 1,200.03 in the short term this is the count I would use. I would expect price to keep moving lower in a zigzag structure for minute wave iv, but not below 1,178.08.
Bear Wave Count
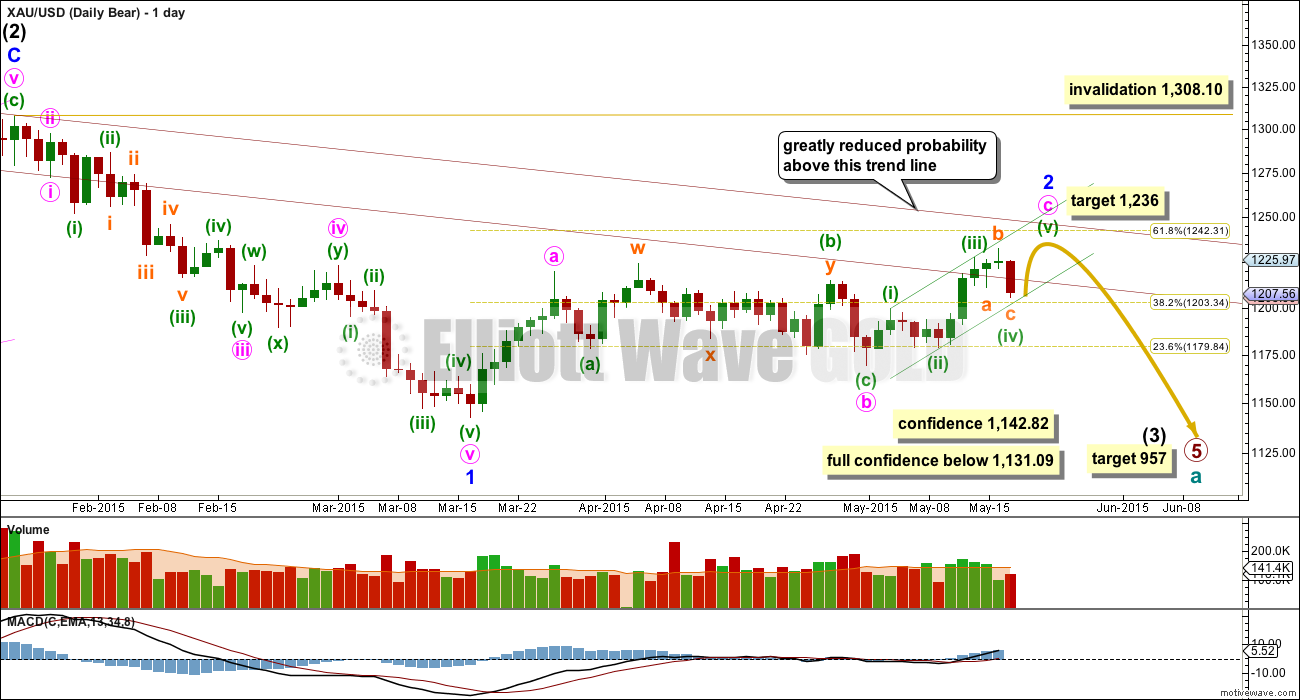
This wave count follows the bear weekly count which sees primary wave 5 within cycle wave a as incomplete. At 957 primary wave 5 would reach equality in length with primary wave 1.
Pros:
1. Intermediate wave (1) (to the left of this chart) subdivides perfectly as a five wave impulse with good Fibonacci ratios in price and time. There is perfect alternation and proportion between minor waves 2 and 4.
2. Intermediate wave (2) is a very common expanded flat correction. This sees minor wave C an ending expanding diagonal which is more common than a leading expanding diagonal.
3. Minor wave B within the expanded flat subdivides perfectly as a zigzag.
Cons:
1. Intermediate wave (2) looks too big on the weekly chart.
2. Intermediate wave (2) has breached the channel from the weekly chart which contains cycle wave a.
3. Minor wave 2 is much longer in duration than a minor degree correction within an intermediate impulse normally is for Gold. Normally a minor degree second wave within a third wave should last only about 20 days maximum. This one is in its 45th day and it is incomplete.
4. Within minor wave 1 down there is gross disproportion between minute waves iv and ii: minute wave iv is more than 13 times the duration of minute wave i, giving this downwards wave a three wave look.
This bear wave count now needs minute wave c upwards to complete as a five wave impulse. The short term outlook for both bull and bear counts is identical.
At 1,236 minuette wave (v) would reach equality in length with minuette wave (i).
Minor wave 2 may not move beyond the start of minor wave 1 above 1,308.10. However, this wave count would be substantially reduced in probability well before that price point is passed. A breach of the upper maroon trend line, a parallel copy of the upper edge of the channel copied over from the weekly chart, would see the probability of this wave count reduced so much it may no longer be published before price finally invalidates it.
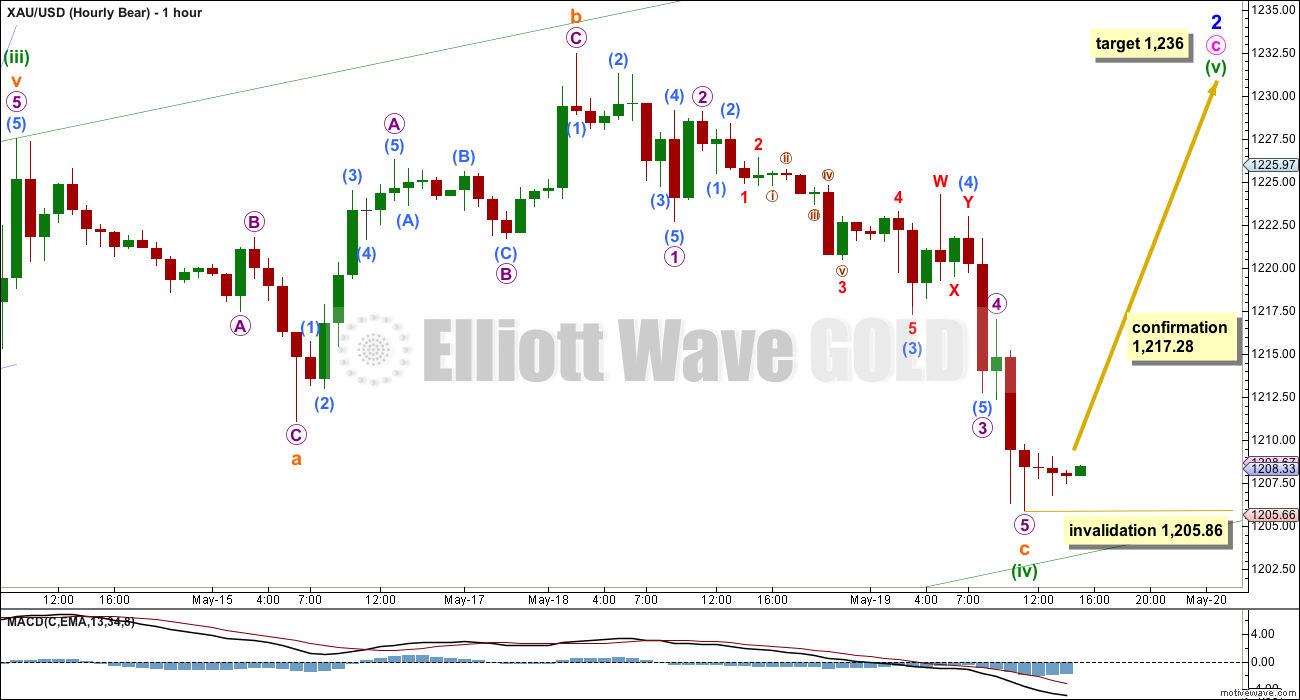
In seeing subminuette wave c as complete all sub waves fit nicely.
Ratios within subminuette wave c are: micro wave 3 is 0.50 longer than 1.618 the length of micro wave 1, and micro wave 5 is 0.97 longer than 0.618 the length of micro wave 3.
Ratios within micro wave 3 are: there is no Fibonacci ratio between submicro waves (3) and (1), and submicro wave (5) is 0.84 short of equality in length with submicro wave (3).
Ratios within submicro wave (3) are: minuscule wave 3 is 0.30 longer than 1.618 the length of minuscule wave 1, and minuscule wave 5 is just 0.11 longer than equality with minuscule wave 3. For this piece of movement this second idea presented here has better Fibonacci ratios.
Within minuette wave (v) no second wave correction may move beyond its start below 1,205.86.
Technical Analysis
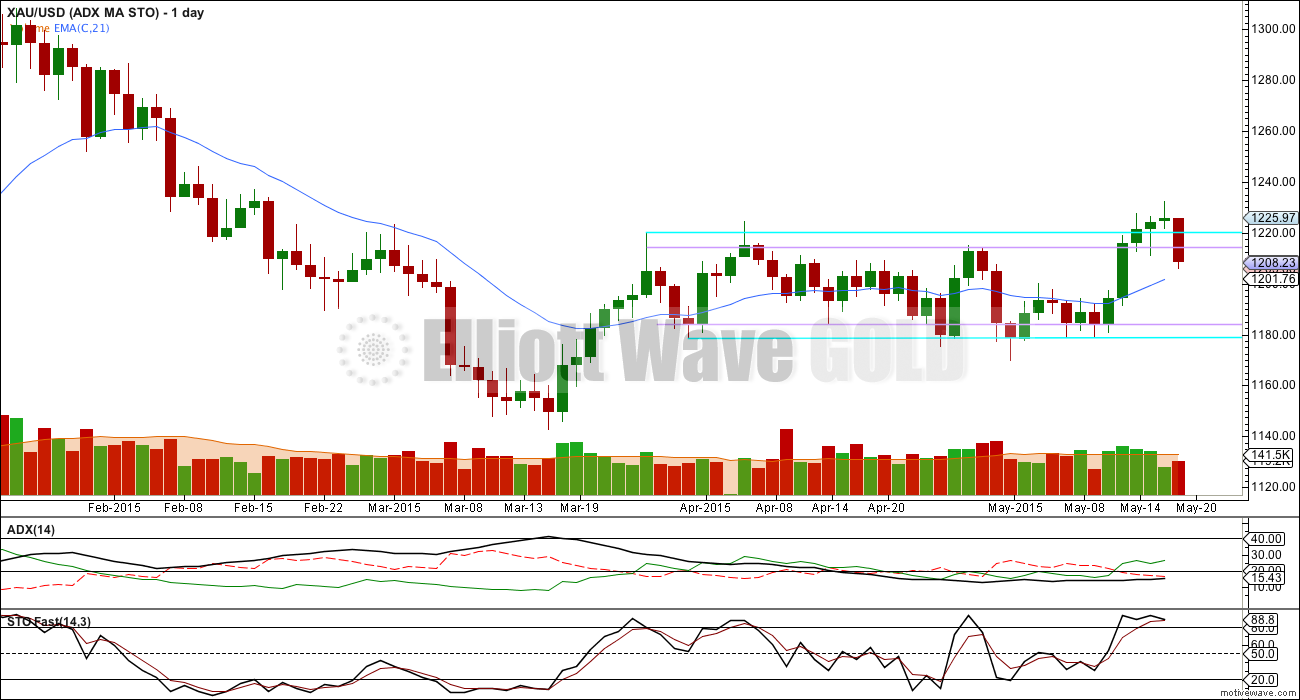
For yesterday’s data (now seen only today) ADX finally reached above 15 and has a slight upward slope. This indicates the beginning of a trend.
Data for ADX and Stochastics for Tuesday’s session is not yet shown on the daily chart (it won’t be until the session is complete). If ADX remains above 15 (unlikely) then an upward trend would be indicated. If ADX moves below 15 no clear trend (yet) would be indicated.
This decline for Tuesday has slightly higher volume (higher than the day before). This may potentially indicate a bottom here.
Stochastics indicates price is overbought, but this may be relieved when Tuesday’s data is available.
The upper trend lines did not provide support. If price is breaking out upwards, this is not just a throwback and a move back into the prior zone of support and resistance. That may be slightly concerning from a regular TA point of view, but the Elliott wave picture allows for it as long as price does not move below 1,200.03.
Currently the +DX line (green line) is above the -DX line (red dashed line). This supports an upward breakout as more likely than downward.
This analysis is published about 04:26 p.m. EST.
Interesting candlestick on the USD today.
Meanwhile, DUST continues with very constructive, bullish action…consolidating its gains yesterday by likely putting in an inside day on relatively low volume as we are 30 minutes from the close. GDX on the other hand is not getting a hard bounce and up volume is only 12M shares right now compared to yesterday’s 50M shares on a hard down day. I just don’t see how yesterday’s move in GDX can be characterized as corrective against a bullish trend.
DUST bullish action????
DUST is lower now than yesterday’s close and today open?
GDX is up over yesterday close and today open!
You have the wrong context completely. Look at the analogous Aug 2014 action and see how bullish flags are constructed. Gains are consolidated on lower volume…you want small pullbacks on lesser volume to consolidate gains ahead of the next move up. I’m not a daytrader so this doesn’t apply if you buy and sell each day….my strategy is one of longer term positioning and capturing the move.
Lara is expecting up movement in main bull, bear count and alternate bull.
I see that as bullish.
And perhaps that will end up working in gold but to me the GDX looks much more likely to be falling apart here.
I see bullish and the bearish falling apart.
I can see a five down complete at the last low of 1,203 quite nicely. For the main bull and the bear count this must be minuette wave (iv) over here.
My concern today is the move up from 1,203 which unfolded over the last several hours will absolutely not subdivide as a five on the five minute chart. I can see it fitting nicely as a double zigzag.
This may be the first wave up of a small leading diagonal to begin minuette wave (v).
But I have found that when I revert to a diagonal (because the first move in the expected direction turns out to be a three not a five) it often turns out to be wrong.
I will publish the hourly bull alternate again, and this time it has more weight. It is quite possible.
For all three hourly wave counts we have a five down complete at 1,203. This is either wave C of an expanded flat, or it is wave A of a zigzag. The subdivisions are the same.
What this most unfortunately means is the upper price point which differentiates the two ideas is now 1,232. But with the target at 1,234 that’s absolutely useless for traders I know.
The main bull and the bear count need fives up. If 1,234 as a target is wrong it may be too low, so I’ll calculate a second target which may be more likely (for the bull count at least).
The alternate bull expects a B wave up within the zigzag of minute wave iv. It can’t move beyond the start of the A wave at 1,232.49.
If we see a new low below 1,203.43 now then the alternate bull count will be strongly preferred. This is important, it means overall the bear wave count reduces in probability quite substantially.
Lara, If it (the low of 1203) completes wave A of zigzag within Minute IV, is that how you could see price moving lower-through wave B? or How is it that the alternate bull’s subdivisions look to move price lower ending at target low?
The alternate (which is now going to be the main bull count) sees a B wave unfolding sideways. The first movement up is a three wave structure for an A wave. This means that minuette wave (b) will be a flat correction (or a double with the first structure as a flat). So now it needs a B wave to move lower, 90% of the A wave, to 1,204.38 minimum. Then it needs a C wave to move higher, to end above the A wave. Overall choppy sideways movement, which is typical B wave behaviour.
The charts and analysis should make this clearer. I have to leave comments now to write that up.
Lara, now that bottom 5 wave is complete. Can gold continue up towards your 1236 target today and this week?
Yes, it can. But see my comment below. I’m very concerned that the first move up from the last low at 1,203 will not subdivide as a five on the five minute chart.
The Janet Yellen speech on Friday is at 1pm EST.
I wonder if gold will move more than $3 between now and then.
lol
I didn’t even have to put down my knitting needle for this non-event.
i’ve been catching up on lost sleep from prior days, all morning. Guess my timing isn’t so off
getting harder and harder to schedule dental work these days. Never know when the market is moving– or not!
I know…If the southeast Iowa May Wk 1 manufacturing index comes in 0.1% weaker than expected, Gold skyrockets $20. But with the last few FOMC/GDP/Payroll reports, Gold acts like they never happened.
never followed the mfg index. good to know. And were reacting to housing stats too
What can she say other than: blah blah blah blah blah?
Which translates to: economy in toilet, no real recovery, no rate hike, our QE will always be bigger than euro QE but we can’t say that.
blah blah blah blah blah? LOL
so is there a song for that?
No. Zombies (fed reserve) can’t sing.
Of course it is blah, blah, blah, but her speech could reverse today’s movement. For example, gold moves up for 2 days. Then she says something, and gold plummets.
I bought my GDX back already after FOMC.
http://www.marketwatch.com/newsviewer
News headlines almost every minute.
I have two screens with this news site so see headlines and can read some others.
Kitco news is slowest and useless for FOMC
Traders be like….(frantically reading the FOMC minutes)
The way I see it, gold needs to get over 1213 to have a good chance at a substantial move up. Otherwise, I think it will see 1190 next as support.
Yep, 1213 was a bugger as expected. Broken support became resistance.
Gold’s banged up against 1213 two times already, 2:00 and 2:29 pm
Third time is a charm?
Lara has her target at 1236
1217.28 is the magic number.
Well I apply pretty simple analysis. Here is the chart I was reflecting on at 1:50pm. It seemed that support was broken at 1213 and it was now becoming resistance. Indeed that is the case. Doesn’t mean it always will be that way but for now it must be respected. I will go out on a limb and guess that 1236 wont be reached today.
Just curious….would an expanding diagonal (wave 4 in progress) work for the daily bear count?
1 hour pm bull chart gold double bounced Tuesday then this morning the double bounce and up. Looks good. Or triple bounce 15th, 19th, 20th.
http://www.pmbull.com/gold-price/
Richard, I took profit at the high of micro 4 just now. Waiting for the completion of micro 5 / minuette 4 before loading up again.
I thought all that was finished and we cold just move up?
I stuck religiously to Lara’s graph. As of yesterday’s close, the graph indicates there will be 2 highs and 2 lows before concluding minuette 4.
May 18th analysis charts showed 2 highs and lows for Tuesday. May 19th analysis chart only shows 1 low Wednesday and then up to high target of 1236. Make sure you are following that which have only 1 low.
I’m using the May 19 chart.
Starting from submicro 3 at 1205.84, yesterday’s low:
First high = 1209.77, submicro 4
First low = 1203.38. submicro 5 / micro 3
Second high = 1212.92, micro 4 (not labelled on graph, but is obvious)
Second low = unknown, currently approaching.
Tham I double check and yes you are correct the chart clearly shows 2 drops to the bottom today. I already sold my GDX at 20.164 at 10:19 am for a small profit thankfully after last nights close call and because you said there was another drop today. If gold bottoms soon I will buy GDX again cheap maybe below $20, otherwise I may just wait for FOMC at 2 pm and buy with the trend.
I am not seeing what you are seeing. Honestly, I get lost at the micro or submicro levels, but don’t you think that what you are suggesting would only apply to an upward movement which remains below the first high? It doesn’t make sense to me that gold would make a new high above 1209.77 and then still make a move to a new low below 1203.38.
Personally, I think that gold is in the clear because it surmounted 1209.77. What I mean is that gold has held the low and should start to climb up….with some corrections of course.
I am interpreting the EW movement the best that I can. The bigger picture is a matter of opinion as analysts depend on indicators, cross-referencing other markets, or using fundamental analysis. Very few use price movement as their basis; I reckon it is not interesting to their readers. Most people like stories, not number crunching. But to me, price is king.
Yes, price is king. I respectfully disagree with your interpretation that gold may make a new low below 1203.38 at this time.
According to Lara and her charts it still needs to.
Look at right bottom of the Hourly Bull chart There are 3 points to bottom at.
(3)
3 circle around it
C (iv)
Those are all bottoms before gold heads up for 1236. gold already dropped to
(3) 1,205.86
then up then down to
3 circle around it at 1203.38 at 2:45 am
then up to micro 4 peak at 1212.92
now needs to drop to C (iv) between 1203.38 and 1200.03.
Then up to 1,236.
I would be shocked if gold got that close to the invalidation point again without punching through. Also, shouldn’t gold be getting support at the green trend line?
Yes support at green line however it already dropped below the line to 1203.38 at 2:45 am and needs to stay above 1200.03.
That may be history at 2 pm FOMC depending which way gold goes.
And I’ve changed it after more work… I can see the five down complete now.
I am very concerned this morning that the upwards move from the low at 1,203 (over the last several hours) will not subdivide as a five on the five minute chart. I can only see this as a double zigzag, a three.
We may be seeing a leading diagonal unfold for subminuette wave i, but every time I have a wave count which reverts to a leading diagonal it turns out to be wrong.
I concur. After seeing the low at 1209.77 (and refusing to move lower), I reasoned that that point is the end of micro 5 and hence minuette 4 (which is a truncation) or else 1203.38 was the low. It didn’t matter for trades. I went long immediately after that, so no real harm done. Richard also did the same.
Tham are you staying long? Gold is now at same price as at 2 pm.
Not much happened from FOMC.
I think it is bullish that Lara is expecting up waves in main bull, bear count and alternate bull. I have my GDX.
Yes.
Good to know.
However today’s FOMC was a let down as I expected more bullish.
Tham K L, what vehicle do you use for short term trades, gold futures, gld, gdx, nugt / dust?
I use NUGT and DUST most of the time so far. The juniors are currently underperforming otherwise they are lucrative also.
Tham k L, do you trade nugt / dust based on gold chart or their own unique charts? Is there a useable reliable time lag between gold and nugt / dust to help time short-term nugt / dust trades? For example possibly nugt /dust usually lag gold moves a few minutes?
I too notice that there is a small time lag in ETFs compared to gold price movement. I think it has to be because they FOLLOW price movement, not second guess it. However, I do not have any statistics to show the duration. It is sufficient to have a time lag because it gives me time to act. Once I see a top/bottom in gold price, I’ll just wait till NUGT/DUST follows suit before entering. Ditto exits. However, the degree of precision is not 100%. You just have to make a judgement call. The alternative is to find a live chart with fast stochastics. That would be very helpful indeed. Unfortunately I have not been able to find one.
Interesting. Thank you.
The biggest factor is at the end of the peaks and bottoms the momentum factor is huge but if gold stalls than momentum will soon shift the ETF the opposite direction even if gold isn’t moving. So get the right combination of indicators and also http://www.pmbull.com 1 minute and other time frames to see any trend lines support and resistance and fast turns in gold.
I am not worried about gold turns. Those I can see easily. Like you said, I use the 1-minute chart with a short-term trendline. Combined with fast stochastics and candlestick reversal patterns, it is easy to tell.
The only peeve I have is I can’t find a similar live chart for NUGT/DUST and the juniors. So I have to best guess those.
TOS – Think or Swim through TD Ameritrade in USA or TD Waterhouse in Canada has free real time live charts of everything and it is free just download the software and use paper trade and get live /GC, $DXY, GDX, DUST, … anything you want and all time frames 1 minute to 1 week. You can add any one of hundreds of indicators/studies. I prefer TTM Squeeze and TTM Wave and DMI Oscillator and momentum and Parabolic SAR and Ichimoku Cloud, and add in compare with $DXY to see which way gold is going. TOS is an awesome award winning pro platform set up all free and real time.
Tham – Live real time free charts for NUGT/DUST and any other symbol in all time frames. See my post below.
That’s wonderful. I’ll give it a try. Thank you so much.
Tham So you are looking for micro 5 to go down to 1205. Is That way I understand?????
According to Lara’s charts, it has to drop below 1203.38 or the fifth wave truncates. I’m open to either scenario.
It could happen in 60 seconds after the FOMC minutes release. Popcorn ready!
…..or in 20 seconds.
Yes between 1203.38 and 1200.03 buy likely not before FOMC.
So after FOMC gold is expected to go down.
That’s what I think, and hard. So far, it has not cleared a nested set of 1-2s yet.
Follow the FOMC period
Gbones sees a big move up for the $USD. Could align well with the bear count.
Thanks for the chart…I’ve had this in the back of my head for several weeks. Today the FOMC minutes which usually provide volatility for gold. I can’t but wonder if the minutes provide the spike towards $1240ish in the next day or two before major reversal?
That’s my thoughts.
I guess it’s just not my style, but I cant imagine being able to finesse the trade you’re describing. I’m sure some of you can and my hats off. I’d rather just sit back and trade the longer term position via GDX-based equities. As long as this setup continues according to my attached chart, I’m into a long term position trade. When the set up is no longer valid, I’m out. For now I can see several more days of consolidation before the next leg down begins in earnest.
Gold direction at FOMC 2 pm is difficult to call.
I prefer not to own anything going into it. Just jump in fast. I have seen gold from FOMC many times go the opposite way many analysts EW and otherwise and including Lara have forecast and got burnt from their bet. If gold is forecast up and the US dollar is strong this week than it’s a coin toss until 2 pm.
Judging from the price movement up to now, I think gold may not hit bottom yet at 2 pm. It is currently in the third wave of submicro 3, somewhere near its middle, not completing yet. There is still submicro 4 and 5 to go. All these in a little over 2 hours!
Thanks, so I just follow FOMC trend.
Fastest News Site at 2 pm, some are just headlines, some are articles.
http://www.marketwatch.com/newsviewer
Me too. Usually, the announcements provide good trading opportunities since a large number of traders sit out before the results. I also watch for large movements one or two minutes before 2 pm because large institutions can position themselves just before the results. They need some lead time because they enter huge orders. And I just ride the whale tail.
2 Pm FOMC is definitely Fast and Furious trading, not for the fearful. It can even change directions 1 -2 -3 times to confuse things so don’t automatically go in 100% the first direction gold moves in. Have all your screens and websites ready before 2pm.
Bob B, nice chart. Would you provide source / location?
Stocktwits under gld.
Thanks.
Exactly! Thanks for showing this to us. This is my view as well. Any little correction in the dollar right now will provide gold enough time to make a quick high. Thereafter, the dollar will rocket up and gold will plummet.
Possible Falling wedge in 1h now
23 point wedge… and falling wedges often breaks upwards
To me that doesn’t look like a falling wedge or really any chart pattern other than general consolidating action. This is what a falling wedge looks like to me, especially when coinciding with a typical fib retrace in a powerful uptrend.
Isn’t it look similar
Yes, FCX looks like a falling wedge but it has some context like divergences with supporting volume and probably bounces off some form of support (ie MA, lateral, or fib support). I could arbitrarily say this attached chart is a rising wedge (which I don’t think it is either). Yes, at the end of the day it’s all interpretative. It was just my opinion.
Lara. Price has moved down below 1205.84, so a fifth wave down is in progress. The version used in the bear count, with a complete fifth, is invalidated.
Lara said the trend line should provide strong support in the Hourly Bull.
“The lower edge of the green channel copied over from the daily chart may be the best way to see when minuette wave (iv) ends. It should find strong support at the lower green trend line, and should end there. Minuette wave (iv) may not move into minuette wave (i) price territory below 1,200.03.”
That is correct. Not only that, minuette 2 began at 1200.03, and downward movement cannot go below it. I estimate the minuette 4 low to be between 1201 and 1203, depending on the amount of rebound in micro 4 to follow.
I’m praying for the US dollar to weaken up now and gold strengthens up from here so that 1200.03 holds 100% solid so we both enjoy some profits today. Goodnight.
Have a sound sleep. You have been working really hard. You really need it.
Are you implying that there is more downside ahead? I thought gold made it and held support.
Yes. I was hesitant until price dipped below the low of yesterday. This is a clear signal that micro 3, and not micro 5, completed. Now we are in micro 4, with the fifth wave to follow.
It appears that micro 5, of minuette wave (iv) ended at the low of the day 1,203.38 at 2:45 am.
I think that was only the end of micro 3. I replied to you above that I think micro 4 just completed at 1212.92. I took a small but respectable profit, and will go in again at the end of micro 5 for the rise to 1236.
Good Morning, Do you have a target for micro 4
Good morning, Ram. I think micro 4 has just completed a little while ago at 1212.92.
Now, let’s wait for the drop in micro 5 which should be a little beyond the low of micro 3 at 1203.38 (to prevent a truncation), and then we can load up for minute 4 which Lara says target 1236. The drop could complete before or during the FOMC minutes release.
Hourly Bear invalidated at 2:06 am with movement below 1205.86 down to 1204.68
hourly bull alternative preferred; pullback / short term decline expecting for 119x before upside move to take out 1220//
I have to say, if gold hits 1236 tomorrow, I will be incredibly impressed with EW and Lara’s skills. It does seem that if gold is going to bounce, this would be the level for it to happen, at perfect fib pullback level keyed off the Jan high. I do however suspect if gold manages to make a new swing high and hit 1236, the GDX will not break resistance to new swing highs as well. The GDX continues to grossly underperform gold (as it has over the past 4 sessions) and even today the GDX is trading at levels it hasn’t seen since gold was in the 1180s on May 11th. I suspect the best the GDX would get on a gold spike to 1236 would be a fill of this morning’s opening gap. The gold charts are certainly not clear to me in terms of bullish or bearish but the GDX/HUI/XAU are decisively bearish in my view.
By the way, Lara, your call yesterday was fantastic. Great work!
Yes Lara, your analysis was very helpful for Tuesday.
Thanks for that and your insightful and helpful comments before Tuesday’s close helped me decide to buy bullish instead of waiting for Wednesday.
You’re welcome. Its nice to finally get this market right, if only for a couple of days, and to have a little more confidence that one of these counts is the right one.
If it moves up from here (and remains above 1,200.03) I’ll be really happy. If it moves down then the bear count is in serious jeopardy. The bull count would still work as per the alternate published.
So far so good…
Lara: to play devil’s advocate, and because I am ultimately most interested in adding to a longer term short position, could minor 2 (bear count) have conceivably been over at the 1232 high? My reasoning here is that the 4th wave up was similar in length to the 2nd on the data feed that I saw. The 2nd wave of 5 up was over in 2 days from what I saw, and not in 4 as you suggest. There’s no point in discussing which is correct, so I would rather just pose this (theoretical) question to you. If the 2nd wave was, in fact, over a lot quicker than what you saw (namely 2 days instead of 4), is there anything else that would prevent this from being a completed 5 up?
If there is even the remotest chance of minor 2 being over already, it would obviously be very important to know because the coming 3rd of a 3rd wave could severely hurt anyone who is long. In fact, gold could even move up to the 1220s (0.618 ratio of today’s drop) before making a harsh change of course. Today’s movement also exhibits some 3rd wave tendencies, doesn’t it? Seems (in theory) like it could be the start of minor 3.
I don’t mean to waste your time with this, but it would make me feel a lot better to have this information. For the record, I would actually very much prefer that gold moves as you say above. Thanks in advance for even pondering this idea.
For what it’s worth, Avi has his eye on this possibility, but he is still leaning toward another move up.
I read his articles from time to time on free websites. However, one thing that he said really confused me recently – and maybe I understood him incorrectly – but he claimed that gold could turn south to below 1000 after going to 1300+ first. That makes no sense at all.
Hi Matt. Was he talking about what’s in Lara’s weekly Bear chart? http://elliottwavegold.com/wp-content/uploads/2015/04/gold15apr15weeklybear.png
Technically speaking, yes. I guess you’re right. However, there is no way that a downward headed market would move up that high first. Even though I am convinced that gold will move much lower, I would change my tune if gold moved decisively above 1250 (an intraday breach would be acceptable).
Just read his May 19 article – he is warning his readers to expect heavy downward movement from 1232.
The article I read from yesterday is warning of downside if certain key levels are broken, which we are still waiting to see if they break or not. I get his nightly service, which is where I saw it. The key level he is watching on GDX is 19.77-19.84 area. Is that what you read?
Article called “Silver And Gold: Finally Got Our Breakout – Time To Turn Down Now?”
If the second wave was over in just 2 days at the low of 1,178.97 (which is possible) now the third wave has a three wave look to it on the daily chart. It still has a nice 1.618 Fibonacci ratio to the first wave.
The problem is in the fourth and fifth waves. Either the fifth wave looks very strongly like a three on the hourly chart, or the fourth wave has a huge truncation (not actually strictly a truncation, but it would only subdivide as a double zigzag, and the second zigzag ends well short of the first, that is most certainly not what a double zigzag should do nor how it should look).
That’s the thing about EW. You can make pretty much anything you like fit… but that does not make it the right wave count. Only paying attention to guidelines and the “right look” will find you the right wave count.
That idea certainly doesn’t have the right look. It does not violate any rules, so it’s technically valid, but it has an exceptionally low probability. So low I would never publish it as a viable idea.