
Downwards movement has increase the probability of the alternate bear Elliott wave count. I still have two Elliott wave counts, one bull and one bear.
Summary: Both wave counts expect a little more downwards movement to most likely complete a five down (I have an alternate hourly chart which sees the five down now complete). Thereafter, both wave counts expect upwards movement: the bear count for a second wave correction which may not move above 1,215.20 and the bull wave count for a third wave up which must move above 1,224.35.
Click on charts to enlarge.
To see weekly charts for bull and bear wave counts go here.
Bull Wave Count
The bull wave count sees primary wave 5 and so cycle wave a a complete five wave impulse on the weekly chart. In order for members to judge for themselves I will list all points for and against for bull and bear wave counts.
Pros:
1. The size of the upwards move labelled here intermediate wave (A) looks right for a new bull trend at the weekly chart level.
2. The downwards wave labelled intermediate wave (B) looks best as a three.
3. The small breach of the channel about cycle wave a on the weekly chart would be the first indication that cycle wave a is over and cycle wave b has begun.
Cons:
1. Within intermediate wave (3) of primary wave 5 (now off to the left of this chart), to see this as a five wave impulse requires either gross disproportion and lack of alternation between minor waves 2 and 4 or a very rare running flat which does not subdivide well.
2. Intermediate wave (5) of primary wave 5 (left hand side of the chart) has a count of seven which means either minor wave 3 or 5 looks like a three on the daily chart.
3. Expanding leading diagonals are are not very common.
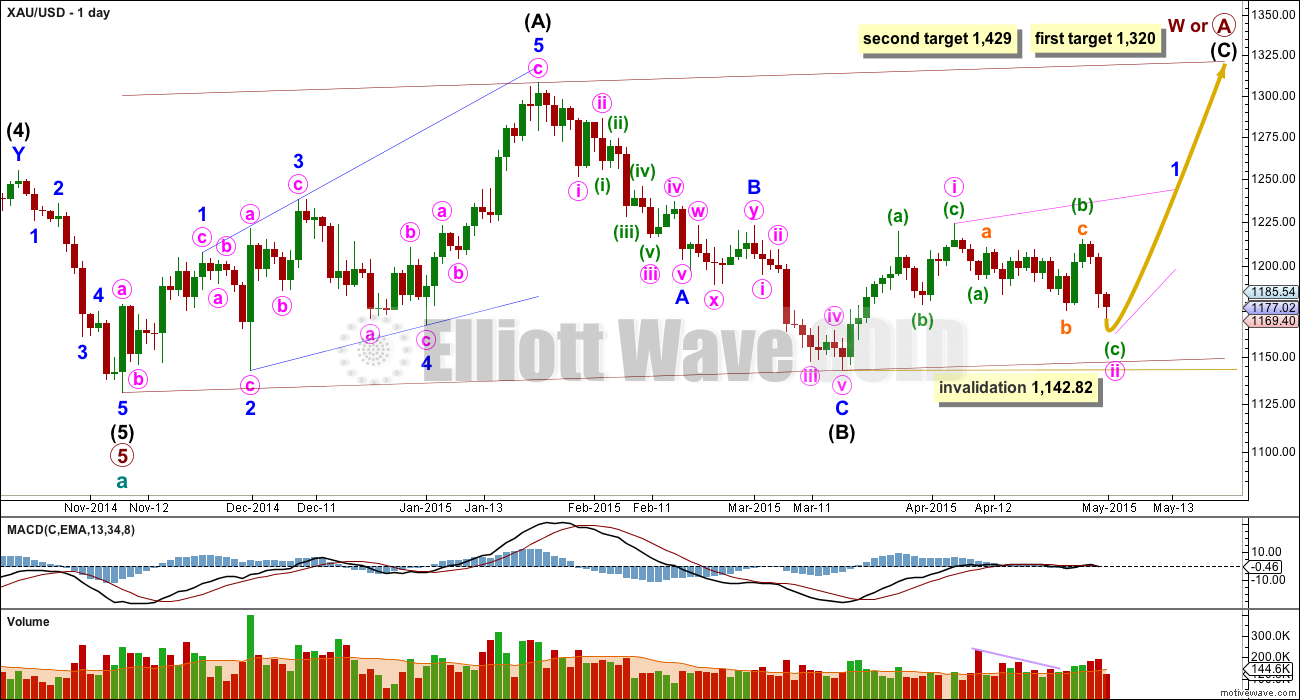
Within cycle wave b primary wave A may be either a three or a five wave structure. So far within cycle wave b there is a 5-3 and an incomplete 5 up. This may be intermediate waves (A)-(B)-(C) for a zigzag for primary wave A, or may also be intermediate waves (1)-(2)-(3) for an impulse for primary wave A.
Intermediate wave (A) subdivides only as a five. I cannot see a solution where this movement subdivides as a three and meets all Elliott wave rules. This means that intermediate wave (B) may not move beyond the start of intermediate wave (A) below 1,131.09. That is why 1,131.09 is final confirmation for the bear wave count at the daily and weekly chart level.
Intermediate wave (B) is a complete zigzag. Because intermediate wave (A) was a leading diagonal it is likely that intermediate wave (C) will subdivide as an impulse to exhibit structural alternation. If this intermediate wave up is intermediate wave (3) it may only subdivide as an impulse.
At 1,320 intermediate wave (C) would reach equality in length with intermediate wave (A), and would probably end at the upper edge of the maroon channel. At 1,429 intermediate wave (C) or (3) would reach 1.618 the length of intermediate wave (A) or (1). If this target is met it would most likely be by a third wave and intermediate wave (C) would most likely be subdividing as a five wave impulse.
It is possible that the intermediate degree movement up for the bull wave count is beginning with a leading diagonal in a first wave position for minor wave 1.
A leading diagonal must have second and fourth waves which subdivide as zigzags. The first, third and fifth waves are most commonly zigzags but sometimes they may be impulses.
Within diagonals the most common depth of the second and fourth waves is between 0.66 and 0.81. Minute wave ii is now 0.66 of minute wave i so this downwards movement has actually made this structure more typical.
Minute wave ii may not move beyond the start of minute wave i below 1,142.82.
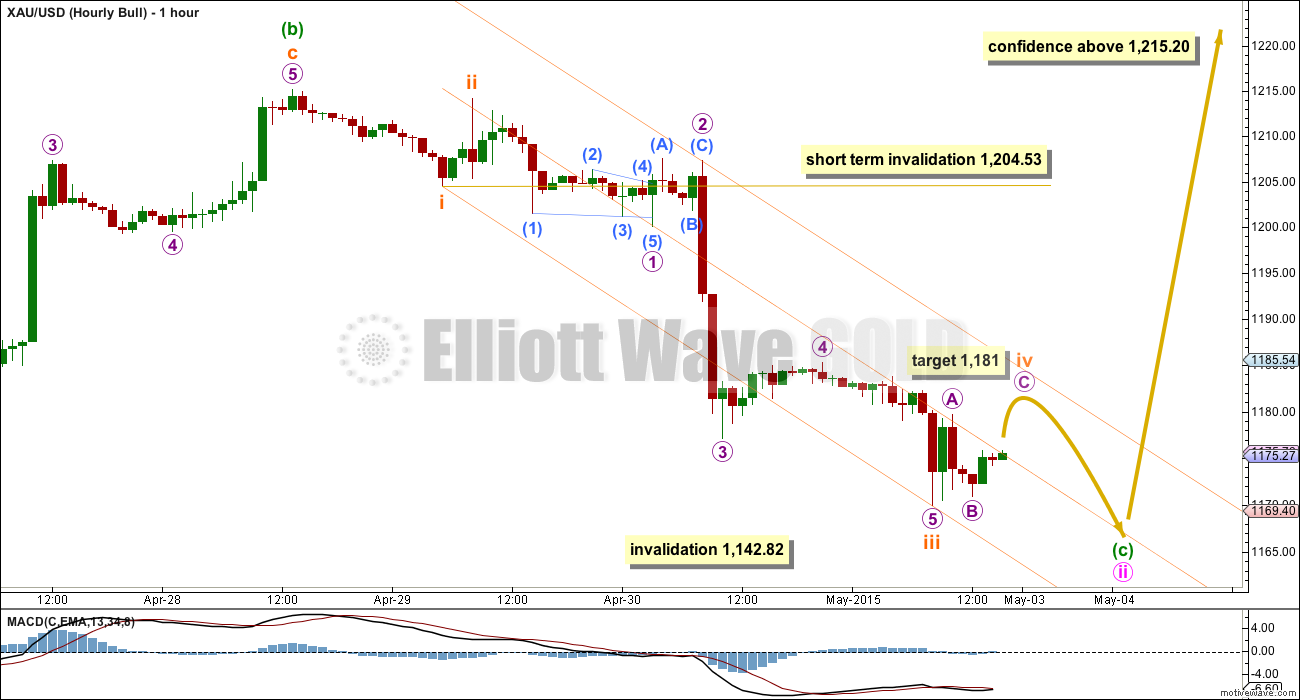
There are two ways to see this downwards movement. It may be an almost complete five wave impulse as shown here or it may already be complete as per the alternate hourly chart for the bear count below.
I will judge it to be more likely incomplete. At 1,181 micro wave C will reach equality in length with micro wave A, and subminuette wave iv will end within the price territory of the fourth wave of one lesser degree.
Subminuette wave iv may find resistance at the upper edge of this best fit channel. The following fifth wave down may be equal in length with subminuette wave i at 10.67.
When minuette wave (c) is complete then the bull wave count requires a third wave up to move above the end of minute wave i at 1,224.35.
Bear Wave Count

This wave count follows the bear weekly count which sees primary wave 5 within cycle wave a as incomplete. At 957 primary wave 5 would reach equality in length with primary wave 1.
Pros:
1. Intermediate wave (1) (to the left of this chart) subdivides perfectly as a five wave impulse with good Fibonacci ratios in price and time. There is perfect alternation and proportion between minor waves 2 and 4.
2. Intermediate wave (2) is a very common expanded flat correction. This sees minor wave C an ending expanding diagonal which is more common than a leading expanding diagonal.
3. Minor wave B within the expanded flat subdivides perfectly as a zigzag.
4. Volume supports the idea that the trend is currently down.
Cons:
1. Intermediate wave (2) looks too big on the weekly chart.
2. Intermediate wave (2) has breached the channel from the weekly chart which contains cycle wave a.
3. Minute wave ii (the last high) breaches a base channel about the first and second wave one degree higher, minor waves 1 and 2. It is deeper and longer lasting than normal for a low degree second wave within a third wave one and two degrees higher.
4. Within minor wave 1 down there is gross disproportion between minute waves iv and ii: minute wave iv is more than 13 times the duration of minute wave i, giving this downwards wave a three wave look.
This wave count now expects to see a strong increase in downwards momentum as a third wave unfolds. At 1,059 minor wave 3 would reach equality in length with minor wave 1, and both would be extended.
Within minor wave 3, if minute wave ii continues further as a double flat or combination then it may not move beyond the start of minute wave i above 1,224.35.
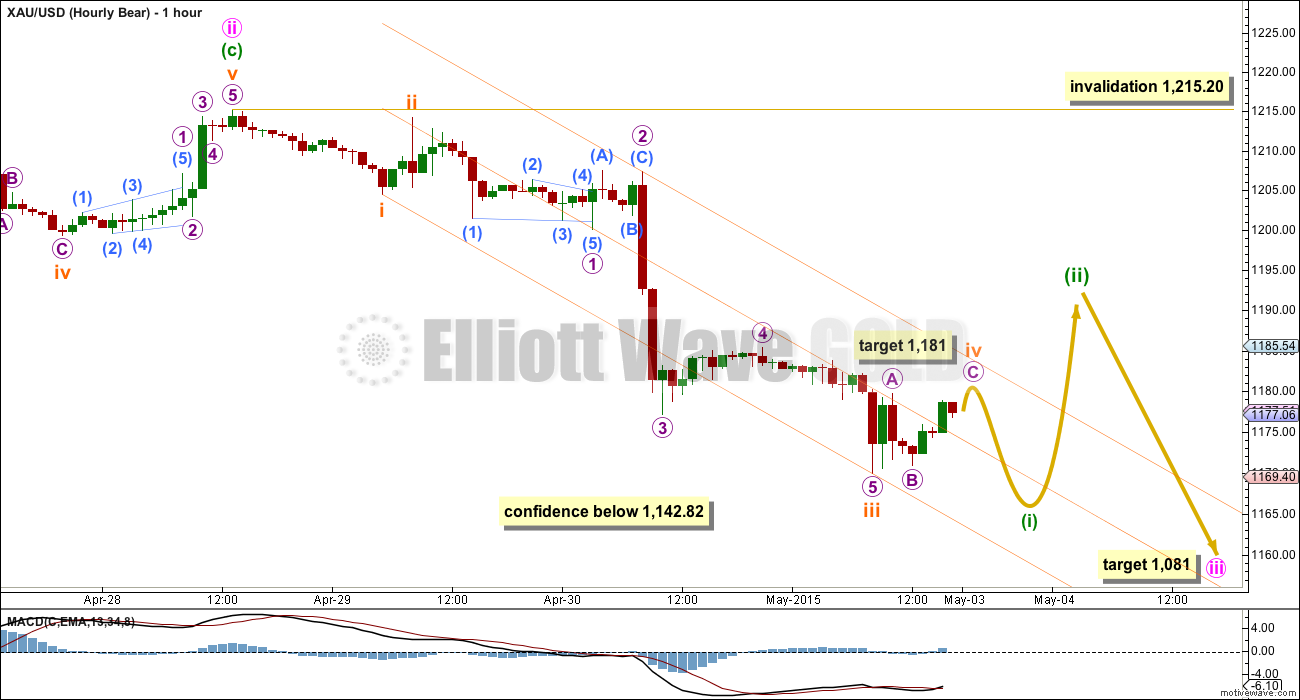
This hourly chart sees the downwards movement in exactly the same way as the bull wave count. The short term expectation is the same.
Subminuette wave iii is just 0.95 short of 4.236 the length of subminuette wave i, coming very close to the target calculated which was at 1,168.
When subminuette wave iv is complete it is possible for this bear wave count that subminuette wave v down may be a strong extended fifth wave typical of commodities. If it does this then it may reach equality with subminuette wave iii at 44.25 in length. If it does this it would take price below 1,142.82 providing further confidence in this bear wave count.
It may also only reach equality with subminuette wave i at 10.67 in length.
When the orange best fit channel is breached by upwards movement then minuette wave (i) would most likely be over. At that stage draw a Fibonacci retracement along the length of minuette wave (i). Minuette wave (ii) may correct up to the 0.382 or 0.618 Fibonacci ratios, with both equally as likely. There may be enough of a strong downwards pull from a third wave to force the upcoming second wave correction to be more shallow than second waves normally are.
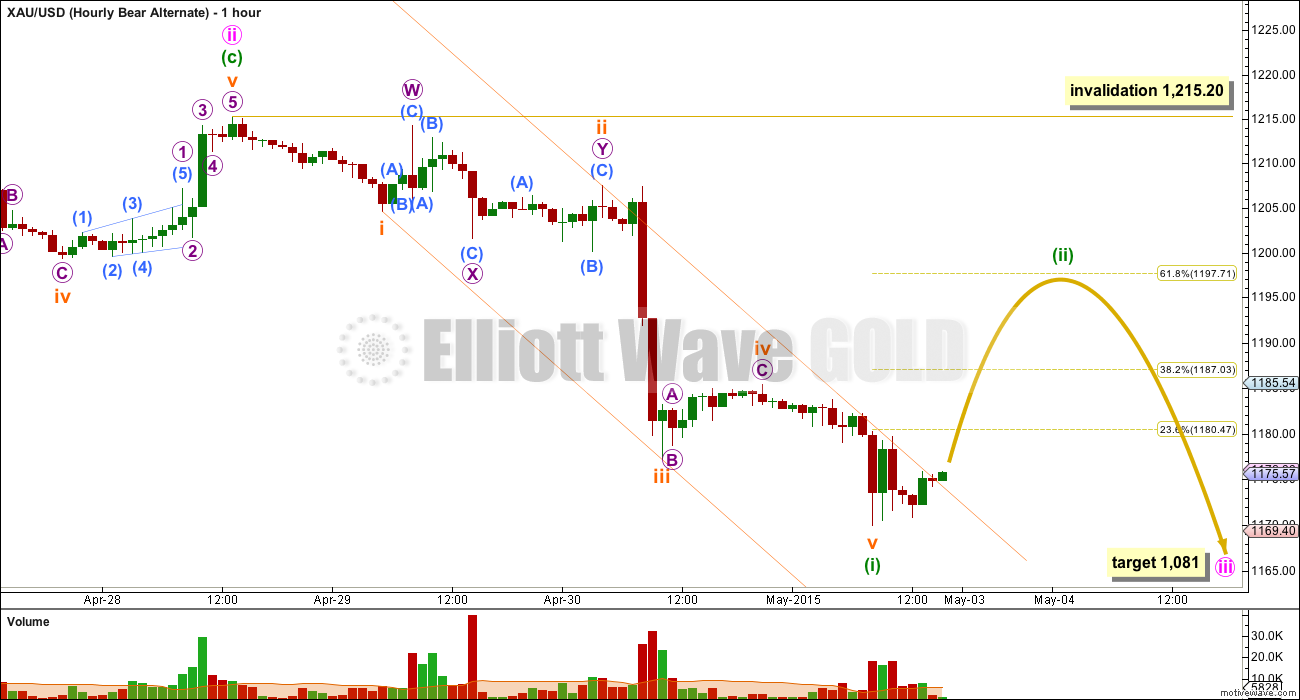
There is another way to see recent downwards movement, as a complete five wave impulse.
Ratios within minuette wave (i) are: subminuette wave iii is 2.45 longer than 2.618 the length of subminuette wave i, and subminuette wave v has no Fibonacci ratio to either of subminuette waves i or iii.
Minuette wave (i) fits nicely within its Elliott channel. This channel is now breached providing first indication that minuette wave (ii) should have begun.
The probability of this alternate idea is lower than the first hourly wave counts due to the slope of subminuette wave ii. This structure subdivides neatly as a double combination, which is a very common structure, but the second structure in the double does not end close to the same level as the first. Micro wave Y at 1,207.51 ends comfortably below the end of micro wave W at 1,214.19, so that subminuette wave ii has a downwards slope with the trend, and not a sideways look which it should have.
Minuette wave (ii) would be equally likely to correct up to the 0.382 Fibonacci ratio at 1,187 or the 0.618 Fiboancci ratio at 1,198. It may not move beyond the start of minute wave (i) above 1,215.20.
This idea also works for the bull wave count at the hourly chart level. There, it would require upwards movement above 1,215.20 from here.
This analysis is published about 05:20 p.m. EST.
Lara
It there a big move either direction that you prefer in a day or by weekend?
Analysis is just published now.
A new low below the last low at 1,169 would indicate a third wave down for both bull and bear wave counts.
The bear count expects a big downwards move. If his happens for Tuesday (or at the latest, Wednesday) with increased volume then the bear count is going to be looking more likely.
The bull count expects a third wave up is just beginning. Low volume for Monday is concerning; it that’s the first day of a third wave it would more likely see an increase in volume. It may redeem itself.
So at this stage the outlook for tomorrow diverges.
By the weekend the bear wave count if it is correct should be moving price strongly lower.
But the weekend the bull wave count if it is correct should be moving price higher, but not so strong. Diagonals are choppy overlapping affairs.
3pm and GDX has only traded 12M shares. Classic low volume gap fill. Look for volume to pick up on the down side.
I was just noticing very low GDX volume.
Gold up $13 and NEM down almost 2%. Why? Because resistance is strong in a downtrend.
It’s the stock NEM that isn’t doing well. Other miners are up. GDX up, GDXJ up 2.08% at 12:54 pm.
My point is that NEM is down because it was already at resistance. It had no gap to deal with like the GDX and GDXJ. I’m trying to make a point that resistance appears to be in control here.
NEM had a 15% advance and got short-term overbought.
I cant disagree but notice how the overbought condition hit when resistance was hit.
$USD turning up….
Mark, here is a long term trend channel break for you to consider.
I don’t really follow the XAU charts much since I trade GDX-based equities. I still think this is where we are and the blue line is my resistance….although I know it’s not everyone’s resistance ;-). Gap backfill today en route lower is how I see it.
I covered the long now building a little short position. Gold hitting resistance and the tape does not look strong enough to overcome it at this particular time.
Updated the COT analysis I like to look at.
I think that Lara’s Hourly Bear Alternate is the closest match so far today.
That would leave a big drop coming.
Although a top trader with a custom super-indicator is forecasting that short term GLD bottom last Friday and gold moving up for weeks this month.
Has target for alt bear hour count met yet?
For other count there a blue sky above and nothing to invalidate till gold crosses 1215.
The .618 target is 1197.71
1197.71 at best
No as invalidation at at 1215.20. Although unlikely.
Would you know 1197 is the neckline extension of HnS as resistance.
If gold closes above that I am out of short and going long.
It’s finding resistance at the upper edge of the blue base channel on the daily chart for the bear wave count. That may be it… if that trend line holds. However, it was breached 4 and 5 days ago so its resistance is weakened.
Nice run in the miners this morning…not sure what I think about the gaps all over the miner ETF charts.
It is still early, but if the gaps hold on the daily chart we will have bullish island reversals on GDX and GDXJ in an uptrend. In that scenario, the islands were the backtests after breakouts from a 6 week trading range.
Always various ways to look at gap fills. When I view things in the big picture, the gap fills look corrective as price hit major resistance and will now move back down. We will see….
Lara, this is the first time I think I’ve seen a proposed ending diagonal count at primary degree for gold. Is this a valid count?
Charts are from this post by Nouf:
http://www.safehaven.com/article/37516/market-report-chopsville
That possible ending diagonal structure breaks a rule for ending diagonals, so that’s not a valid wave count.
The diagonal is neither expanding nor contracting. The third wave at 261 is longer than the first at 252, but the fourth wave at 177 is shorter than the second wave at 211.
Also, the trend lines slightly converge indicating a contracting diagonal.
The third wave is too long.
I’ve wondered over the years if third waves in diagonals do have a tendency to be the longest of the actionary waves, as long as the other wave lengths fit either contracting or expanding and as long as the trend lines are in line with that. However, it does violate the rules for diagonal wave lengths as written in Frost and Prechter and rewriting their rules is not advisable. I learned that one the hard way.
Once gold puts in the bottom:
Rick Rule on KWN broadcast: Built a carefully constructed portfolio which will propel 10 fold.
http://kingworldnews.com/rick-rule-5-3-15/
Some one charts the dates of Martin Armstrong:
https://www.tradingview.com/x/0zVl9Vpb/
Armstrong is brilliant but difficult to understand. What does this mean?
Big event week coming up. Jobs report on Friday could move gold and Greece needs to repay a total of almost a billion euros to the IMF by May 6 and May 12. The market seems to have “baked in” a deal for Greece. A deal could be the trigger for gold to drop quickly. A surprise “no deal” and gold likely rises. Let the fun begin.
A few Saturday morning charts. Gold finally broke it’s consolidation and I feel that we now know that resistance is in control and that support is quite a ways down. If the Bear wave count is correct, I see a target down around $1,160 which isn’t far from Lara’s $1,081.
GDX structure is still very bearish and there is no support until gap fill at bottom of channel at ~$19.
Possible bottom in the $USD.
NUGT low volume really jumped out at me. Fri was one of lowest days since last Oct which is ominous especially when preceded by a gap down as shown on the chart. A waterfall next week wouldn’t surprise me.
Thanks for the charts Mark. The USD finally made some kind of move but still a little tepid, although looks much better than before. I still covered gold shorts and went long early fri. Gold stocks look a little too resilient here. And based on everything else I see I think there’s a decent chance of yet another bounce within the range at the very least. Will see. GLTA
Last time gold stocks held up better than gold in a very similar setup and structure (summer 2014), the GDX progressed into a period where it lost 34% of its value in 2 1/2 months. Gold dropped 12% over the same period. I’m not sure GDX relative strength is the right criteria to be using to support a bullish stance when gold starts plunging like it is now….although I’m seeing other gold analysts publishing articles right now saying the same thing. I’ve found the gold bug pros haven’t been exactly spot on the past few years. See chart showing my rationale. We will see….agreed and we are all just making educated guesses.
Oh let me be clear. I’m only talking about next day or 2. I swing trade extremely short term. I could be back to bear position as early as Monday, or later in the week. Im still not sure which camp I’m in longer term. I’m just thinking gold is not ready to break down in the next day or 2. But I’m less sure about that than I was last week pre fed, and I may feel a little pain on Monday if this is indeed a 4th wave that ends before the U.S. Market opens. I do think the market will wait until the next jobs report at least for the bigger move up or down though
Totally understood. My thoughts are reflective of a much longer trading time horizon.
Wow….the more I look the more ominous this low volume is in the context of the current structure. Last Oct it led to a 29% whack on the GDXJ in 2 weeks.
A VIEW: I am short and holding but I wouldn’t get too carried away for the downside just yet. There is a short term bull lurking around, let’s make no mistake about that! With Gold price currently riding the lower band (hovering around pivot), is not an ideal place to be selling or staying short; a good downward move is possible without SlowK being oversold and can expect some downside on Monday and it remains to be seen if Gold price can break below 1166…. On a weekly outlook basis, momentum and ROC appear to be slowing suggesting an upturn. It would then remain to be seen if Gold price can take out 1215/16….
Hi Syed, I was interested if you have A VIEW today
Thanks for your posts!
Looks like we are back in the shaded area.
I am short but this incessant barrage of charts makes me think I am on the wrong side ! Like I said , I don’t give any weight to them at all .
I am still 75% position long in JNUG, been holding it for maybe close to 3 weeks now, avg. 19.60. I am expecting minimum 1250.
Biotechs and small caps are moving nicely these last few days as well.
You may very well be right .
My logic is based on the counts only at this point .
1) 1215 is huge resistance . I don’t see how we can just slice through it now and Lara’s bull count expects strong move up .
2) The bear count fits best overall at intermediate level and we can’t go higher without making minor 2 too big .
So I decided to go with process of elimination and see if EW is worth anything at all . But I am not feeling good about it , no .
And volume. I’ll publish another weekly chart today. Volume keeps indicating the bear count is correct, at intermediate degree on the weekly chart it looks like a clear strong indicator.
I cant believe you are short here. You were absolutely certain the other day that prices would plow through resistance.
Where did I say that ?
Seriously?
Yes seriously . Find it .
So you now are onboard with my risk/reward premise that we should be selling major resistance on the weekly charts? Apparently I must be the only one who remembers your admonishing me for holding such views and being certain that I was wrong. And I suggested that you “hold that thought”. 🙂 Honestly though, we should all be nimble and never hold onto views if the premise no longer holds true. Good on ya ! Best of luck with your trades.
I am not onboard with anything you say and never will be . Your resistance is not my resistance .
Yes we are. The conformance of price to the forks had been uncanny for months. I didn’t expected price to move back in shaded area. I will be curious how prices continue to behave around those lines.
Great report Lara!!
This post for weekend entertainment along the line of on going side ways whipsaw!!!!
Lara if you disapprove you may delete it.
Enjoy the The whipsaw Song!!
https://www.youtube.com/watch?v=LiE1VgWdcQM
LOL fantastic, thanks Papudi! Always good to see the humour and have a laugh. And some quite relevant statements in that song.
OMG. LOL!! This is great! I happen to love blue grass/country/folk music so it just makes me laugh at myself that I never considered “other” blue grass lovers would be informed about trading. Where on earth did you find this? Such a comical song.
I’m not a fan of country at all actually, but I did still appreciate this song. It’s got the perfect message for us for the last couple of weeks price action. Perfect.
Now if they did a reggae version I’d be stoked….
Hey reggae’s good. Not all country is good. The rhythm, the message, the timing of the message: does it lift your soul? That’s what makes music good. uh oh, i’m off topic! lol 🙂
Song has a great message.
Ed Seykota’s 6 Rules from the Whipsaw Song.
http://www.newtraderu.com/2011/12/11/ed-seykotas-6-rules-from-the-whipsaw-song/