
Upwards movement fits the alternate hourly Elliott wave count best, which works for both bull and bear wave counts at the daily chart level. Volume continues to be a strong indicator of which Elliott wave count is more likely. I have another weekly chart for you today to look at volume.
Summary: The bear wave count expects a second wave correction to end about 1,198 before a strong third wave down begins. The confidence point for the bear count remains at 1,142.82. The bull wave count expects a third wave up has begun. The confidence point for the bull wave count remains at 1,215.20. Volume continues to favour the bear wave count and is a concern for the bull wave count. In the short term a new low below 1,169.94 would indicate a third wave down for both bull and bear wave counts, at least at a low wave degree and maybe more substantial.
Click on charts to enlarge.
To see weekly charts for bull and bear wave counts go here.
Bull Wave Count
The bull wave count sees primary wave 5 and so cycle wave a a complete five wave impulse on the weekly chart. In order for members to judge for themselves I will list all points for and against for bull and bear wave counts.
Pros:
1. The size of the upwards move labelled here intermediate wave (A) looks right for a new bull trend at the weekly chart level.
2. The downwards wave labelled intermediate wave (B) looks best as a three.
3. The small breach of the channel about cycle wave a on the weekly chart would be the first indication that cycle wave a is over and cycle wave b has begun.
Cons:
1. Within intermediate wave (3) of primary wave 5 (now off to the left of this chart), to see this as a five wave impulse requires either gross disproportion and lack of alternation between minor waves 2 and 4 or a very rare running flat which does not subdivide well.
2. Intermediate wave (5) of primary wave 5 (left hand side of the chart) has a count of seven which means either minor wave 3 or 5 looks like a three on the daily chart.
3. Expanding leading diagonals are are not very common.
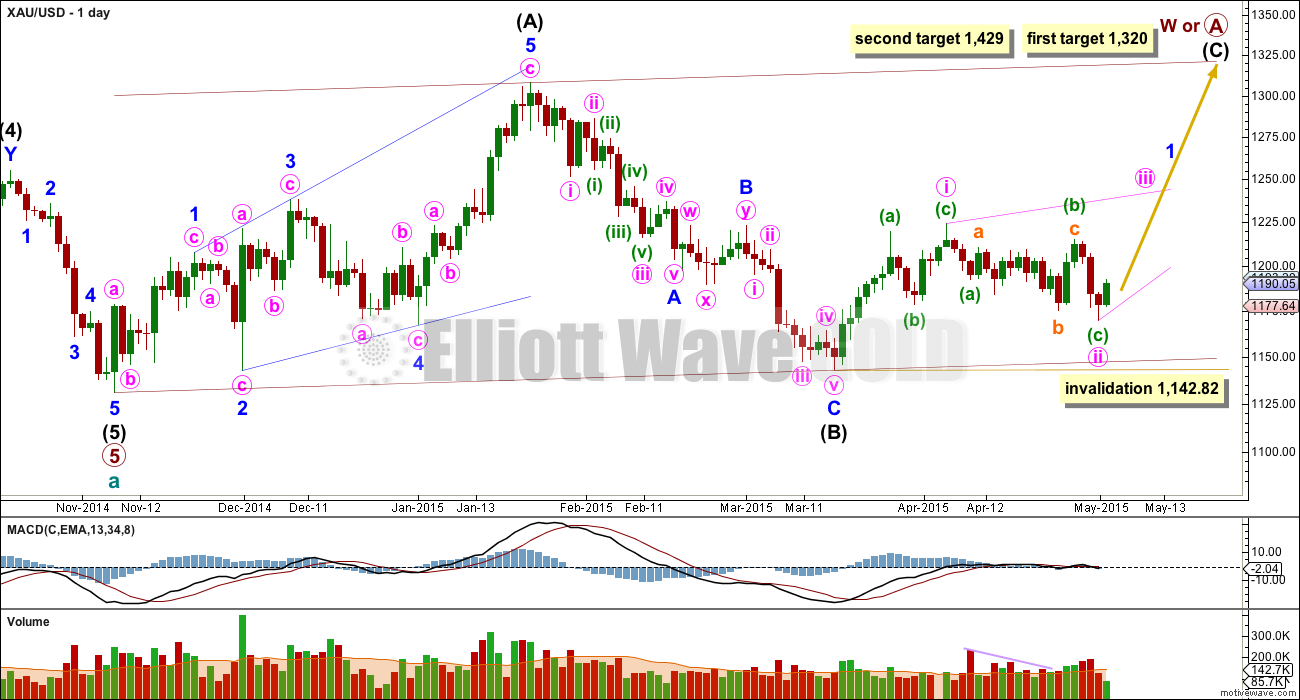
Within cycle wave b primary wave A may be either a three or a five wave structure. So far within cycle wave b there is a 5-3 and an incomplete 5 up. This may be intermediate waves (A)-(B)-(C) for a zigzag for primary wave A, or may also be intermediate waves (1)-(2)-(3) for an impulse for primary wave A.
Intermediate wave (A) subdivides only as a five. I cannot see a solution where this movement subdivides as a three and meets all Elliott wave rules. This means that intermediate wave (B) may not move beyond the start of intermediate wave (A) below 1,131.09. That is why 1,131.09 is final confirmation for the bear wave count at the daily and weekly chart level.
Intermediate wave (B) is a complete zigzag. Because intermediate wave (A) was a leading diagonal it is likely that intermediate wave (C) will subdivide as an impulse to exhibit structural alternation. If this intermediate wave up is intermediate wave (3) it may only subdivide as an impulse.
At 1,320 intermediate wave (C) would reach equality in length with intermediate wave (A), and would probably end at the upper edge of the maroon channel. At 1,429 intermediate wave (C) or (3) would reach 1.618 the length of intermediate wave (A) or (1). If this target is met it would most likely be by a third wave and intermediate wave (C) would most likely be subdividing as a five wave impulse.
It is possible that the intermediate degree movement up for the bull wave count is beginning with a leading diagonal in a first wave position for minor wave 1.
A leading diagonal must have second and fourth waves which subdivide as zigzags. The first, third and fifth waves are most commonly zigzags but sometimes they may be impulses.
Within diagonals the most common depth of the second and fourth waves is between 0.66 and 0.81. Minute wave ii is 0.66 of minute wave i.
Minute wave ii may not move beyond the start of minute wave i below 1,142.82.
Within the diagonal minute wave iii is most likely to subdivide as a zigzag, but it may also be an impulse. The bull wave count must look at both possible structures.
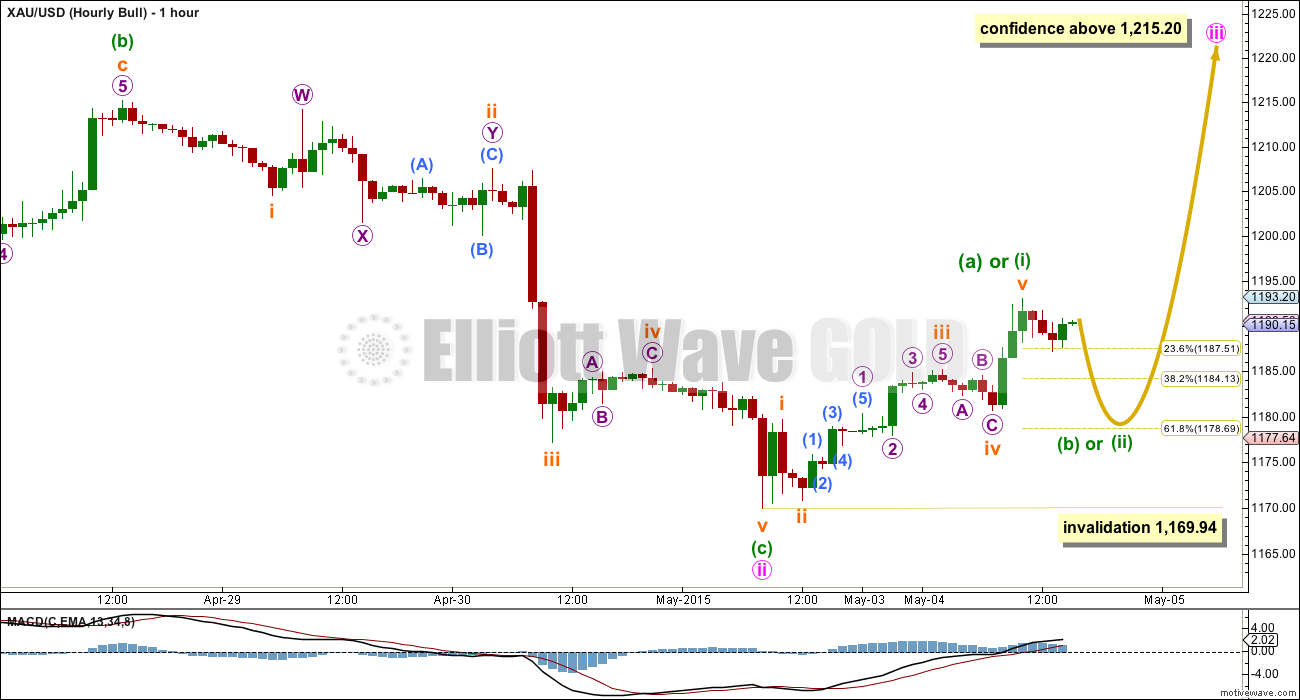
So far there is a complete five up. This may be minuette wave (a) or (i).
Minuette wave (b) or (ii) may not move beyond the start of minuette wave (a) or (i) below 1,169.94. It may end about the 0.618 Fibonacci ratio of the prior upwards five at 1,179.
If price moves below 1,169.94 then it may be minuette wave (c) of minute wave ii continuing lower. The degree of labelling within minuette wave (c) down would be moved down one degree, and a third wave down would be expected to be underway within minuette wave (c).
Bear Wave Count
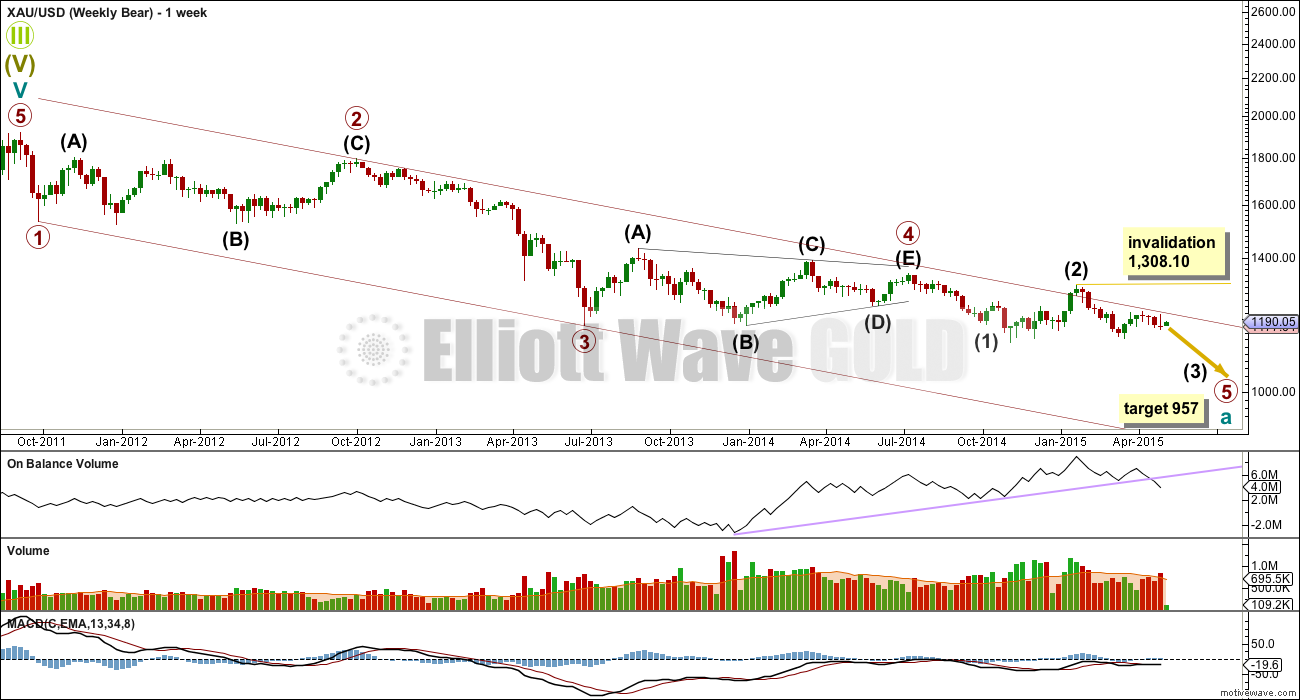
Volume continues to favour the bear wave count, at the daily and importantly at the weekly chart level.
Since the end of intermediate wave (2) at 1,308.10 on the weekly chart it is downwards weeks which show strongest volume. During the last upwards rise (three green weekly candlesticks) volume was lower and declined towards the end of that movement. If that upwards movement was a correction it would be expected to show declining volume towards its conclusion, which fits the bear wave count nicely.
On Balance Volume now has a stronger breach of the trend line which is drawn from December 2013. OBV is indicating the trend at this time is more likely down than up.
This wave count follows the bear weekly count which sees primary wave 5 within cycle wave a as incomplete. At 957 primary wave 5 would reach equality in length with primary wave 1.
Pros:
1. Intermediate wave (1) (to the left of this chart) subdivides perfectly as a five wave impulse with good Fibonacci ratios in price and time. There is perfect alternation and proportion between minor waves 2 and 4.
2. Intermediate wave (2) is a very common expanded flat correction. This sees minor wave C an ending expanding diagonal which is more common than a leading expanding diagonal.
3. Minor wave B within the expanded flat subdivides perfectly as a zigzag.
4. Volume supports the idea that the trend is currently down.
Cons:
1. Intermediate wave (2) looks too big on the weekly chart.
2. Intermediate wave (2) has breached the channel from the weekly chart which contains cycle wave a.
3. Minute wave ii (the last high) breaches a base channel about the first and second wave one degree higher, minor waves 1 and 2. It is deeper and longer lasting than normal for a low degree second wave within a third wave one and two degrees higher.
4. Within minor wave 1 down there is gross disproportion between minute waves iv and ii: minute wave iv is more than 13 times the duration of minute wave i, giving this downwards wave a three wave look.
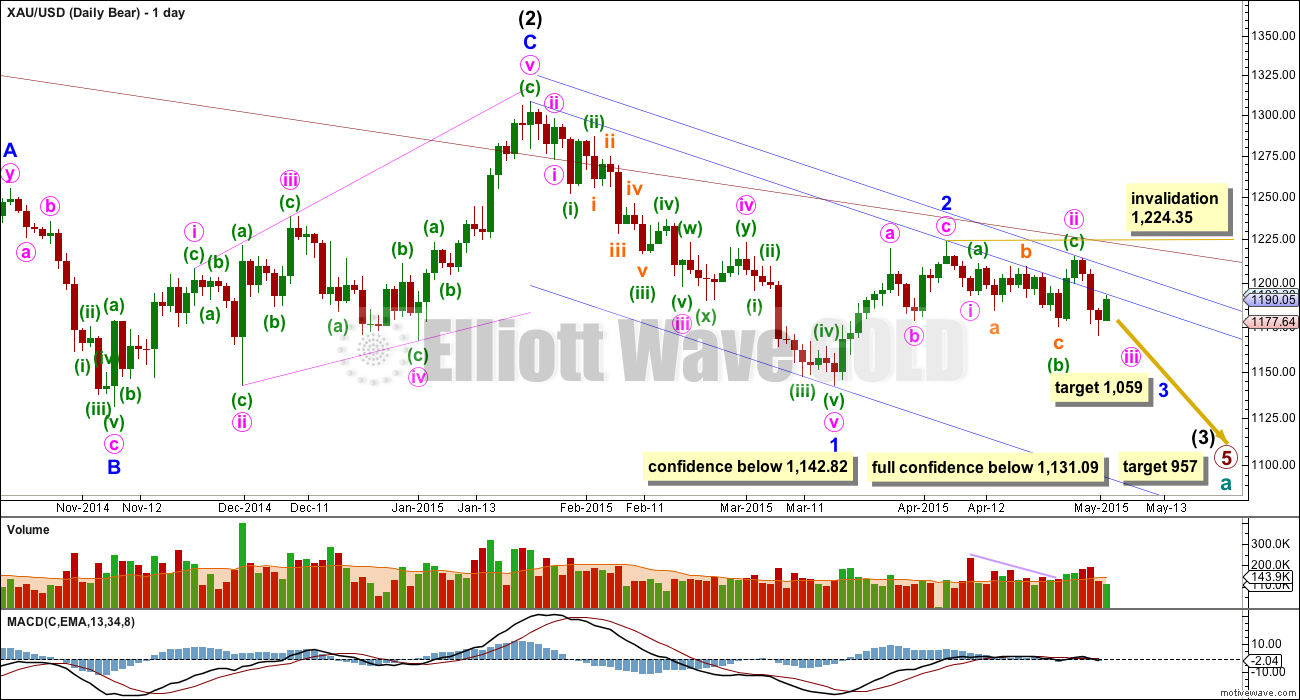
This wave count now expects to see a strong increase in downwards momentum as a third wave unfolds. At 1,059 minor wave 3 would reach equality in length with minor wave 1, and both would be extended.
Within minor wave 3, if minute wave ii continues further as a double flat or combination then it may not move beyond the start of minute wave i above 1,224.35.
Monday’s up day is so far finding resistance about the upper edge of the blue base channel drawn about minor waves 1 and 2. Create a parallel copy and push it up to sit on the high of minute wave ii, then copy these trend lines over to the hourly chart.
Volume for Monday is lower than the prior three down days. If this upwards day is a correction against the main trend then volume would be expected to be lower.
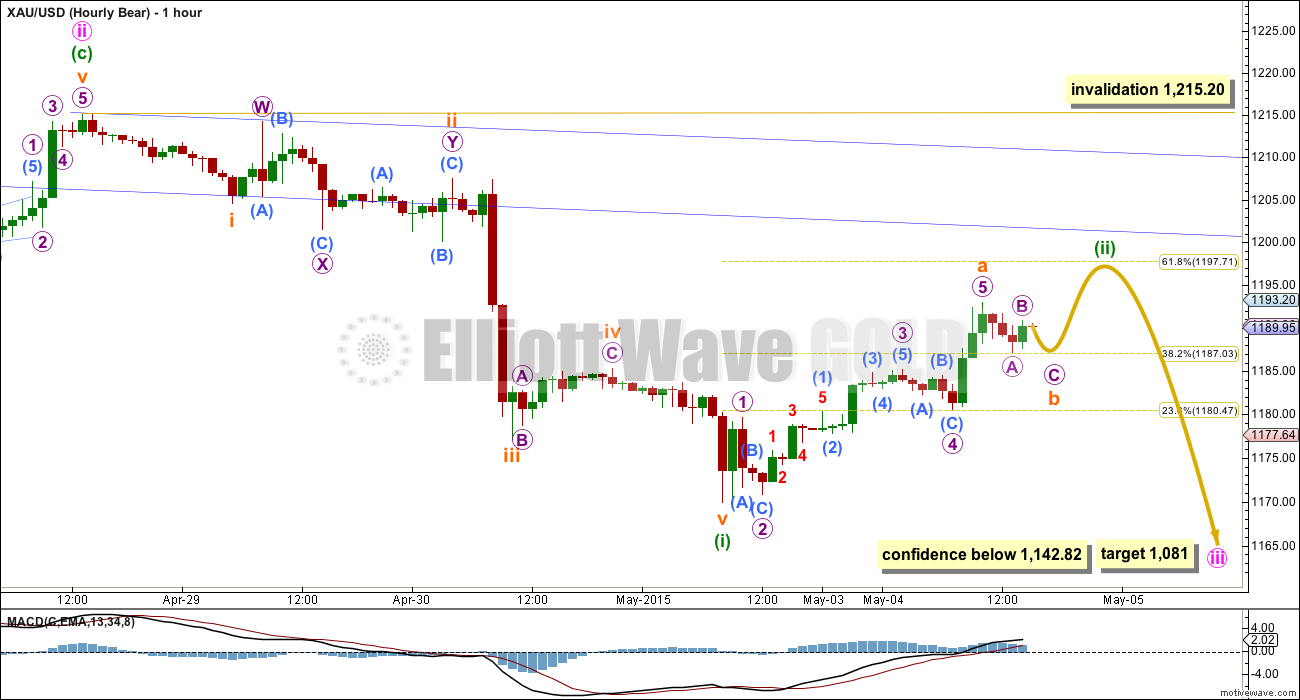
Within minute wave iii minuette wave (i) is complete and now minuette wave (ii) is correcting against it. Minuette wave (ii) has passed the 0.382 Fibonacci ratio and the structure is incomplete. The 0.618 Fibonacci ratio would now be the most likely point for it to end about 1,198.
Minuette wave (ii) looks like it is unfolding as a zigzag. Subminuette wave a subdivides neatly as an impulse. Subminuette wave b may not move beyond the start of submineutte wave a below 1,169.94.
Subminuette wave b would most likely end when it looks like a clear three wave structure. A final five up to complete minuette wave (ii) would then be required.
Minuette wave (ii) may end when it touches the lower blue trend line, but if that line is breached then the next line of resistance would be the parallel copy placed on the high of minute wave ii.
Minuette wave (ii) may not move beyond the start of minuette wave (i) above 1,215.20.
This bear wave count requires a new low below 1,142.82 for a reasonable level of confidence.
This analysis is published about 03:46 p.m. EST.
May 5th analysis is out now!
For the very short term I expect a small fifth wave up to complete the five wave structure which began at 1,185.86 (subminuette wave b now on the bear hourly count, subminuette wave ii now on the bull hourly count).
My short term target would be at 1,201. It is likely this small fifth wave will move at least slightly above the last high at 1,200 as that’s the end of the third wave and a truncation is unlikely.
When this final small fifth wave up is done then the bear count will expect strong downwards movement. The bull count needs price to keep going up above 1,215.20. That’s the short term confirmation / invalidation point to the upside.
Volume again is weak. There’s not much pushing this move up, which does not make sense for a third wave just beginning and so does not support the bull wave count.
Beware, if that bear wave count is correct then the next 24-48 hours could see a very strong move down.
I’m off to write that up now.
Lara–thanks, always appreciate a short summary before market close.
ditto davey
Looking like we may get a bearish engulfing for the day.
Yes we may for the next day, but it wouldn’t be at the end of a clear upwards trend so if that happens it wouldn’t be a bear signal. Bearish engulfing candlestick patterns, while the strongest bear reversal signal possible (for a candlestick pattern) must come at the end of a clear upwards trend. These two days aren’t enough. So the pattern, if it happens, should be ignored.
Sorry Bob, I didn’t see a chart when I first replied. Please ignore my comment!
I’m a newbie but I think we just completed minuette 2 for the bear count and know in first wave of minuette 3. The train has already left the station for the bears.
Before deciding on wave count bull count is still alive. Gold can continue higher here?????
Unless u know the structure of wave ii which differentiate it from a corrective to impulse up??
Was up wave a corrective?
Last night I had two choices for today: either buy DUST when gold peaked today at 1198 as per hourly bear or buy GDX when gold bottomed at 1179 today as per hourly bull. Buying DUST when gold peaked at 1199.89 at 9:56 am was clearly the best bet today
Unfortunately I stayed up way to late finishing my 2014 CDN taxes at the last night possible and slept in way too late to buy DUST. Hopefully many bought DUST or JDST?
Now I’ll wait for Lara’s update, maybe it might come before close again like Monday?
DUST. trying to decide if I’m adding to position or changing stop.
I’m cautious lately as the profits the market gives one day it takes back the next.
Perhaps Lara’s comments before close may clarify your decision. Otherwise being cautious I would take profits before close as we as still in undecided choppy waves with overnight surprises especially with 3X ETFs. Kitco afternoon wrap up almost sounds like gold could turn bullish?, “Technicals suggest the greenback, US dollar has peaked and that crude oil prices have bottomed.” Interesting that on a bullish gold day that DUST & JDST goes up. That is because gold peaked early today and been dropping since then and a long descent in gold beats up the miners.
Lara just responded. Both counts active. Bull can continue higher and bear will limit the advance at 1200.
I do not know how to trade this? Flip a coin or depend on TA reading.
Add to shorts at every opportunity.
It may come down to adp payroll numbers which I believe are announced tomorrow morning. That may really move the market. I’m sticking with my short position but I am really not confident about it. Among other things the USD has been and continues to be very weak
In the very short term I am expecting one more final fifth wave up to 1,201. Then the bear count needs downwards movement and the bull count needs to keep going up above 1,215.20.
Volume again today is low, lower than yesterday. If this is a third wave up then volume is not supporting it.
I’m a newbie but I think we just completed minuette 2 for the bear count and know in first wave of minuette 3. The train has already left the station for the bears.
Gold up. DUST up… I give up on working out this stuff…
Got any idea where we are at with the EW count?
Gold looks like its on a bull run this am. Doesn;t seem to fit the Bull count above, IE no wave B
I believe this is/was the 3rd of the final 5 waves up for the bear count.
Both bull and bear counts calls for gold to correct to 1197 and then down to 1168.
Am I right??
From Lara’s charts above, just the bear count seems to require that.
From what it looks like to me, gold is in a 4th wave now that should go slightly below 1194.65 (a wave), but it cannot go below 1190.33 (top of 1st wave). Then a final 5th wave up would complete this 2nd wave. Considering that the 3rd wave can never be the shortest that would cap upward movement (5th wave) at about 1207. That figure is based on the length of the 3rd wave and adding it to the end of the a wave in this 4th wave correction.
That said, I don’t believe that gold will get all the way to 1207. However, there remains a good chance that gold does go above 1199.85 or whatever you see as the recent high. Since this is the end of upward movement before gold finally collapses, there may be a quick spike to break 1200 to add some final fireworks to say farewell to these price levels.
Matt–thoughtful analysis. Thanks.
You’re welcome. Nice to know that Lara validated the idea.
Well , maybe I don’t understand what you are looking at . Why are you looking for 5 waves if you are bearish ? If it is 5 waves , then we have more to go …
My best guess is we are chopping up around until Friday report .
never mind .
Friday’s report will certainly be a mover and shaker. We’ll have to wait and see where gold is then to figure out what’s next. However, Friday is a long way away in trading hours. There are a lot of other reports, etc. between then and now, and a 3rd wave down won’t necessarily wait until then.
I have exactly the same idea for the very short term structure. The fourth wave should be pretty much done here, if the final fifth wave reaches 0.618 the third and the whole of this five (which I have as subminuette wave c for the bear count) reaches 0.618 the length of the prior subminuette wave a then a target would be about 1,201.
The final fifth wave would be reasonably likely to make at least a slight new high above the end of the third at 1,200 to avoid a truncation.
I learned this stuff from you. 🙂
Matt–how high will minuette (ii) go?
See below. It’s a best guess only.
Gold is in the confluence of resistance zone. There are two HnSs. One primary a big one (blue) and another small one (red) on right side building cause to break the neckline below at 1141.
If gold breaks above the neckline extension above (black line) Lara’s bull wave count will be active or if gold breaks the NL below 1167 bear count is validated.
Then the final break below the last second NL at 1141 will eliminate the bull wave count.
Gold pushed down below 9ema with volume and bounced on light volume but 9ema held as resistance. Closed below 9ema.
I really like that pink horizontal trend line you have there. It shows so clearly this repeated area of resistance.
My working theory is still holding up that resistance is in control and prices aren’t closing within shaded area. Just another data point to consider regarding the path of least resistance….down.