
Yesterday, short term hourly Elliott wave charts expected upwards movement to at least 1,198. Price has reached up to 1,200.03 so far.
Summary: In the short term the bull wave count expects a small fifth wave up to about 1,209 and the bear wave count maybe only to 1,201. Thereafter, the wave counts diverge. The bear wave count expects a very strong downwards move to begin soon and the bull count requires more upwards movement. Volume for Tuesday is lower, which supports the bear wave count and not the bull.
I am very pleased to be able to tell members today that yesterday I sat and passed the level II exam for CMT.
Click on charts to enlarge.
To see weekly charts for bull and bear wave counts go here.
Bull Wave Count
The bull wave count sees primary wave 5 and so cycle wave a a complete five wave impulse on the weekly chart. In order for members to judge for themselves I will list all points for and against for bull and bear wave counts.
Pros:
1. The size of the upwards move labelled here intermediate wave (A) looks right for a new bull trend at the weekly chart level.
2. The downwards wave labelled intermediate wave (B) looks best as a three.
3. The small breach of the channel about cycle wave a on the weekly chart would be the first indication that cycle wave a is over and cycle wave b has begun.
Cons:
1. Within intermediate wave (3) of primary wave 5 (now off to the left of this chart), to see this as a five wave impulse requires either gross disproportion and lack of alternation between minor waves 2 and 4 or a very rare running flat which does not subdivide well.
2. Intermediate wave (5) of primary wave 5 (left hand side of the chart) has a count of seven which means either minor wave 3 or 5 looks like a three on the daily chart.
3. Expanding leading diagonals are are not very common.
4. Volume continues to not support this bull wave count. If a third wave up is beginning volume should show an increase, not a decrease. “When prices are rising volume decreasing is questionable.” (Kirkpactrick and Dahlquist)
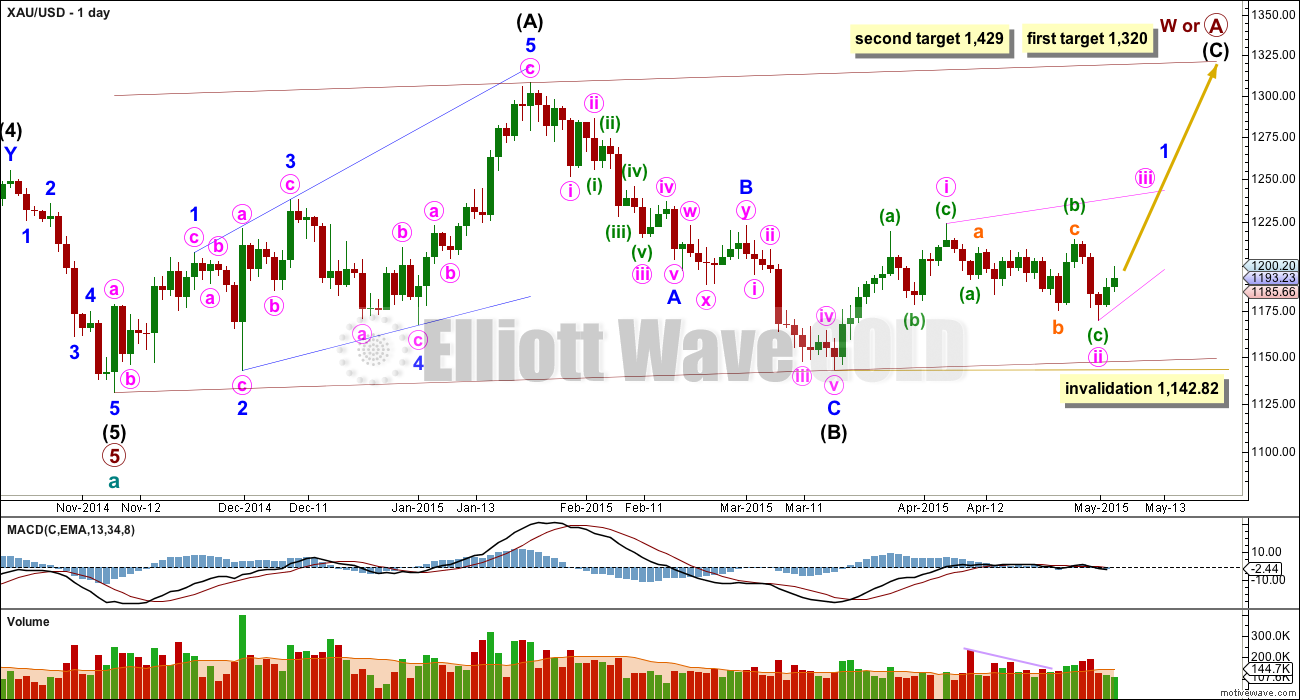
Within cycle wave b primary wave A may be either a three or a five wave structure. So far within cycle wave b there is a 5-3 and an incomplete 5 up. This may be intermediate waves (A)-(B)-(C) for a zigzag for primary wave A, or may also be intermediate waves (1)-(2)-(3) for an impulse for primary wave A.
Intermediate wave (A) subdivides only as a five. I cannot see a solution where this movement subdivides as a three and meets all Elliott wave rules. This means that intermediate wave (B) may not move beyond the start of intermediate wave (A) below 1,131.09. That is why 1,131.09 is final confirmation for the bear wave count at the daily and weekly chart level.
Intermediate wave (B) is a complete zigzag. Because intermediate wave (A) was a leading diagonal it is likely that intermediate wave (C) will subdivide as an impulse to exhibit structural alternation. If this intermediate wave up is intermediate wave (3) it may only subdivide as an impulse.
At 1,320 intermediate wave (C) would reach equality in length with intermediate wave (A), and would probably end at the upper edge of the maroon channel. At 1,429 intermediate wave (C) or (3) would reach 1.618 the length of intermediate wave (A) or (1). If this target is met it would most likely be by a third wave and intermediate wave (C) would most likely be subdividing as a five wave impulse.
It is possible that the intermediate degree movement up for the bull wave count is beginning with a leading diagonal in a first wave position for minor wave 1.
A leading diagonal must have second and fourth waves which subdivide as zigzags. The first, third and fifth waves are most commonly zigzags but sometimes they may be impulses.
Within diagonals the most common depth of the second and fourth waves is between 0.66 and 0.81. Minute wave ii is 0.67 of minute wave i.
Minute wave ii may not move beyond the start of minute wave i below 1,142.82.
Within the diagonal minute wave iii is most likely to subdivide as a zigzag, but it may also be an impulse. The bull wave count must look at both possible structures.
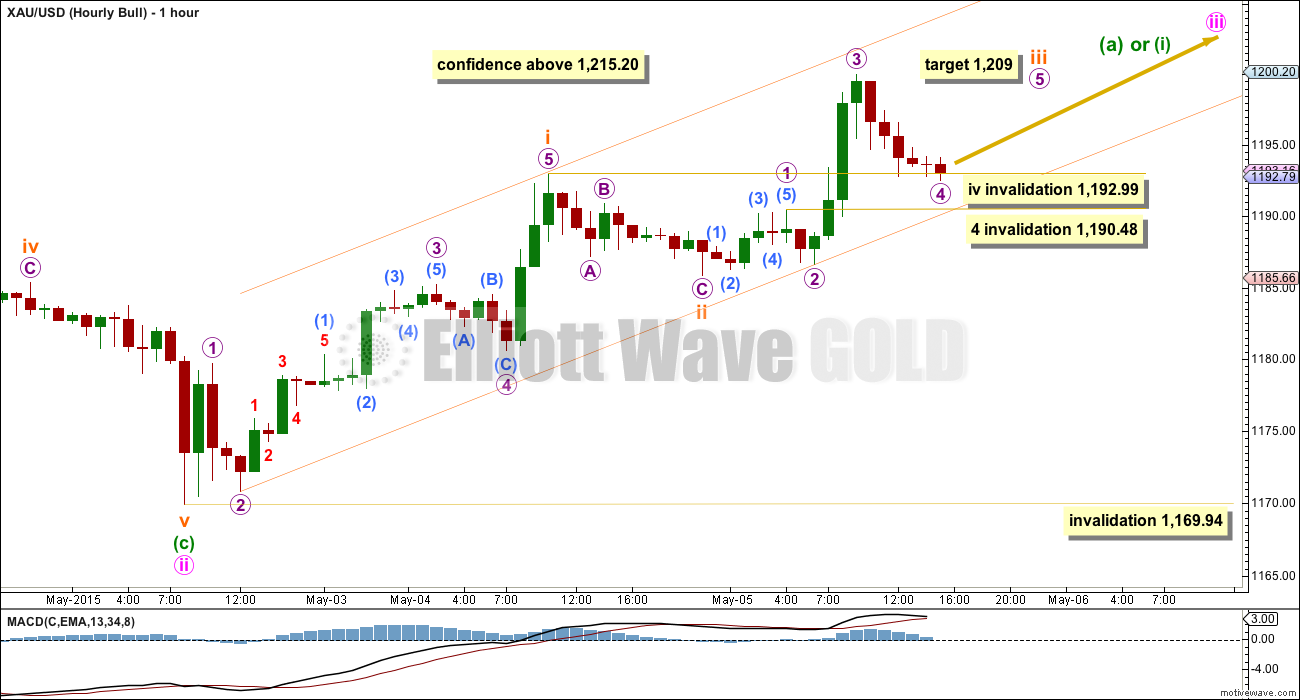
Although a three up can be seen as almost complete this cannot be minute wave iii close to completion, because minute wave iii must move above the end of minute wave i at 1,215.20. Only if the next short wave up moves above that price point would I consider labelling minute wave iii as complete, but for now I am moving the degree of labelling down one degree from yesterday for this upwards movement.
Within minuette wave (a) or (i) a first and second wave for subminuette waves i and ii would now be complete. Subminuette wave iii would reach equality in length with subminuette wave i at 1,209.
Within subminuette wave iii micro waves 1, 2 and 3 are complete. Micro wave 4 may not move into micro wave 1 price territory below 1,190.48.
When micro wave 5 upwards completes the impulse for subminuette wave iii then another fourth wave correction for subminiuette wave iv should unfold downwards. When subminuette wave iii is complete redraw the channel using Elliott’s first technique: draw the first trend line from the high labelled subminuette wave i to wherever subminuette wave iii ends up, then place a parallel copy on the low labelled subminuette wave ii. Subminuette wave iv may find support at that lower trend line.
Subminuette wave iv may not move into subminuette wave i price territory below 1,192.99. This invalidation point only becomes active when subminuette wave iii is complete.
Minuette wave (b) or (ii) may not move beyond the start of minuette wave (a) or (i) below 1,169.94.
If price moves below 1,169.94 then it may be minuette wave (c) of minute wave ii continuing lower. The degree of labelling within minuette wave (c) down would be moved down one degree, and a third wave down would be expected to be underway within minuette wave (c). This possibility would see minuette wave (c) down as too time consuming though. It is possible, but it looks unlikely.
Bear Wave Count
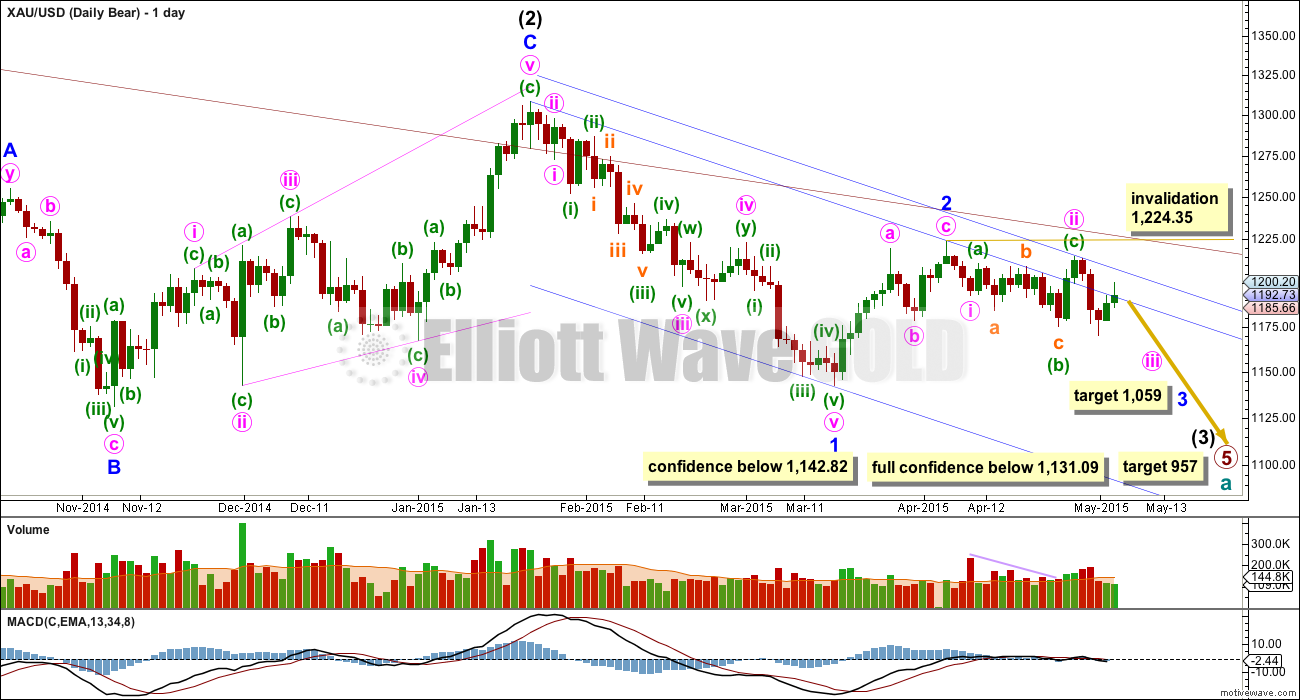
This wave count follows the bear weekly count which sees primary wave 5 within cycle wave a as incomplete. At 957 primary wave 5 would reach equality in length with primary wave 1.
Pros:
1. Intermediate wave (1) (to the left of this chart) subdivides perfectly as a five wave impulse with good Fibonacci ratios in price and time. There is perfect alternation and proportion between minor waves 2 and 4.
2. Intermediate wave (2) is a very common expanded flat correction. This sees minor wave C an ending expanding diagonal which is more common than a leading expanding diagonal.
3. Minor wave B within the expanded flat subdivides perfectly as a zigzag.
4. Volume supports the idea that the trend is currently down.
Cons:
1. Intermediate wave (2) looks too big on the weekly chart.
2. Intermediate wave (2) has breached the channel from the weekly chart which contains cycle wave a.
3. Minute wave ii (the last high) breaches a base channel about the first and second wave one degree higher, minor waves 1 and 2. It is deeper and longer lasting than normal for a low degree second wave within a third wave one and two degrees higher.
4. Within minor wave 1 down there is gross disproportion between minute waves iv and ii: minute wave iv is more than 13 times the duration of minute wave i, giving this downwards wave a three wave look.
This wave count now expects to see a strong increase in downwards momentum as a third wave unfolds. At 1,059 minor wave 3 would reach equality in length with minor wave 1, and both would be extended.
Within minor wave 3, if minute wave ii continues further as a double flat or combination then it may not move beyond the start of minute wave i above 1,224.35.
Monday’s up day is so far finding resistance about the upper edge of the blue base channel drawn about minor waves 1 and 2. Create a parallel copy and push it up to sit on the high of minute wave ii, then copy these trend lines over to the hourly chart.
Volume for Tuesday is slightly lower than the prior upwards day, which supports the idea that this upwards movement is a correction against the trend.
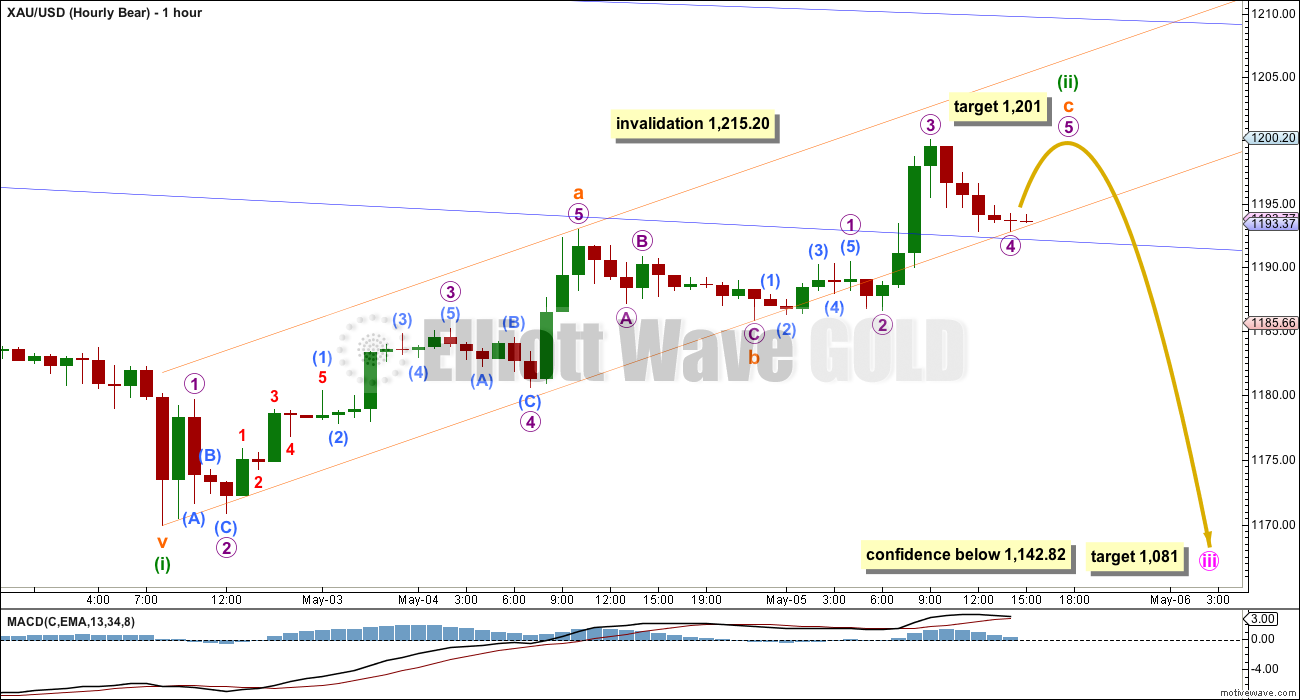
Minuette wave (ii) is incomplete, and needs one small final fifth wave up at micro degree for the 5-3-5 zigzag structure to be complete.
At 1,204 micro wave 5 would end just slightly above the end of micro wave 3 at 1,200 avoiding a truncation. At 1,201 micro wave 5 would reach 0.618 the length of micro wave 3 and at 1,200 subminuette wave c would reach 0.618 the length of subminuette wave a.
If price moves above the target at 1,201 then look for the next area of resistance to be the upper blue trend line here copied over from the daily chart.
Minuette wave (ii) may not move beyond the start of minuette wave (i) above 1,215.20.
When minuette wave (ii) is complete then this bear wave count expects a third of a third of a third of a third wave down… that’s a third wave at four degrees. The next downwards movement for this wave count is expected to show a strong increase in momentum. If it shows an increase in volume that would further support the bear wave count at the daily chart level.
This bear wave count requires a new low below 1,142.82 for a reasonable level of confidence.
At 1,081 minute wave iii would reach 4.236 the length of minute wave i. I am using this Fibonacci ratio in this instance because minute wave i was so short, and it fits nicely with the target one degree higher for minor wave 3 at 1,059.
For the bear hourly wave count draw the channel using Elliott’s technique for a correction: draw the first trend line from the start of subminuette wave a to the end of subminuette wave b, then place a parallel copy on the end of subminuette wave a. When this channel is clearly breached by downwards movement (not sideways) then it may be the earliest indication that minuette wave (ii) is over and minuette wave (iii) down may have begun.
This analysis is published about 04:15 p.m. EST.
It looks like we may see a small inside day for Wednesday. The target for the third wave down for the bear count at 1,081 remains the same. It’s at least 7 days away, if minute wave iii totals a Fibonacci 13 days. Short term invalidation point for bear count now at 1,200.03, with the invalidation point for any continuation of minuette wave (ii) remaining at 1,215.20.
The bull count may have seen a three down complete and so should be expecting a third wave up. The target is at 1,237. Short term invalidation point for the bull count must remain at 1,169.94 because it’s about 50:50 whether minuette wave (b) or (ii) is over as a three, that could be just the first three of a double or flat correction.
Bull and bear counts still diverge today.
Volume for Wednesday is higher than the prior two up days. Volume consistently continues to favour the bear wave count.
I’m off to write that up now. Good luck everybody! And again, thank you very much for your support and kind words.
It’s not so much their “approval” I seek, as the learning that the CMT programme gives me.
Being a CMT would provide members and others with more confidence that I know what I’m doing, and that I must and will behave ethically as I’m bound by the MTA ethics guidelines.
I think that social proof is pretty important for menu people.
In the long run completing the CMT is worth the effort. Besides having the CMT stamp of approval for all to see. It will probably help you in your own personal trading.
Lara, good call on the drop today.
Does gold still have the lower target of 1,181? Has it just been delayed or has the 4 1/2 hour slight uptrend since 10:50 am EST morphed into something else?
Gold price activity today appears to be heading for an inside day (indecision) to Tuesdays relatively narrow trade range H 1199.3 / L 1184.9. Should Wednesday trade end with an inside day then will most likely open up the possibility of an impulse move with thrust on either side of Wednesday range (at least for now Gold price is below 20dma giving it bearish bias)…. Upside risk is seen as 1197-98 with 1212 on the outside; Gold price needs to show a break below 1189 with 1177-76 seen as limiting…. Perhaps a stop and reverse on either side of Wednesdays trade range would be one way to deal with it~!
A quick GDX hourly chart update. Once that support was broken, it seems to have quickly morphed into resistance.
JNUG holding support in its bearish wedge but sell volume is picking up. Any lower close tomorrow should break the wedge but my guess is a bounce tomorrow to keep everyone wondering going into Fri.
GG continues to fall apart and often leads the GDX. Very close to challenging neckline of the daily.
Avi Gilburt – Silver & Gold: Not Giving Up Short-Term Bullish Case Just Yet – Tuesday, 5 May 2015
http://news.goldseek.com/GoldSeek/1430856000.php
If things fall apart over the next several sessions, and we see necklines breaking and bear flag busting, I’m sure Avi will claim he got his members out of their long positions Tuesday at the opening pop and got them quickly nestled into short positions. He always seems to have plausible deniability and perfect execution 😉
Everyone is entitled to their own opinion of Avi Gilburt. I know he isn’t perfect and that Lara is better than him.
However I followed Avi Gulburt for 18 months and learnt a lot and made profits from his calls.
He presented a once a week gold and silver EW forecast and we know that with the volatility of gold that even a daily forecast may not be often enough.
His website offers live access to numerous EW experts as once a week EW forecast clearly isn’t enough. So trash away if anyone wants to, I disagree with any negative comments about Avi, however I agree to disagree as our individual perceptions make up our reality.
All I know of him is from the articles he writes for all the precious metals trading websites. He is undeniably a prolific marketer and you’re right, if someone does well with his service that’s great. I have no idea how good his service is but it sounds like it worked for you..I have just noticed that in follow up articles he always seems to have turned on a dime correctly or made a remarkable market call when the market moves against the theme of his prior article. Perhaps it’s all true and I shouldn’t be so skeptical.
That was quite an assessment of something you have never experienced.
He has a chat room with live trading calls that include his e-wave analysts, his members and himself. An article that is a week old likely doesn’t reflect what is happening live in the chat room.
I was hoping I qualified my opinion correctly but apparently not. I’ve only read his articles and am reflecting on those. Like I said, I may be way off and shouldn’t be so skeptical. I think it’s his ultra-heavy marketing that rubs me the wrong way and I know that has no impact on the quality of his service. Based on what you guys are saying, it sounds excellent and I’m glad it works for you guys.
I used his weekly article to augment Lara’s and when in doubt I always preferred Lara’s. His weekly article didn’t provide enough information to trade with but it was helpful. I did join his website for a free 14 day trial and was overwhelmed as I only wanted gold and silver and it covered EW for everything. I was newer with EW than and just overloaded even with the gold and silver information, which was somewhat difficult to track down. Still some swear by it. I know a very profitable world class gold trader who holds Avi’s site in high regard.
Is this an A-B-C move down to 1181?
I think there was a 5 wave down from high at 1197.76 at 8:20 am down to 1188.63 at 10:50 am. Perhaps the 5 wave down is incomplete or gold is now doing a B wave up.
I’m trying to buy into DUST as I missed the invalidation and Lara’s 2 new charts until an hour after the open and gold had already dropped and DUST was already up.
Is there still any decent retrace point to buy into DUST before 1181 gold?
I was looking at DUST too – cause I bought and then sold too soon yesterday. Looks now like DUST ready to come back down(stochs overbought and rsi turning down on 1/2 hr)
I’m remembering retracement (on XAU) doesn’t have to go to .618%, can be only .382. waiting like a poised cat over a gopher hole
The tricky part is if GDX falls below 19.70, you may not get a chance to buy DUST again at current levels. I agree though….I would not be buying at this level either as it’s at wedge resistance. It would be safer to buy in higher after the confirmed breakout. I’ve been fully loaded on DUST for a while and I’m not trying to get too cute bouncing in and out of the position.
yesterday should have been an add to position instead of close,,for me. My brain’s been a bit overloaded lately. 🙁
My best guess is that we have a nested pair of 1-2s. The count is now 1-2 then 1-2-3-4 of 3. We are now in the midst of the fourth wave of lesser degree. This makes sense as the third wave of larger degree saw the largest drop. The completion of the five waves of larger degree would approach 1181. An alternative view is an A-B-C correction and we are now at the fourth wave of C.
The safest trade is still to wait for the rebound after 1181. (The gungho can make a small trade on NUGT for this rebound). If price rises above 1200.20 then the bear count needs to be revised. Otherwise, the bear lives on. If that is the case, I will fully load onto DUST as it will then be a strong third wave down.
Thanks for your response on this. It confirms what I was planning.
Tham, thanks for such an insightful answer and strategy. Safest with clarity preparing for strong third wave down. I’ll wait for Lara and rebound thanks.
appreciate your asking the qeustion about 1181. Thams response too.
Watch the miners to gold ratio. Below is a GDXJ:GLD in 2 hour.
I’ve been watching it on the weekly chart also.
The bottom line is broken.
It may back test and then begins down????
I have been watching the 10-year yield against this move in gold and miners. $TNX looks like it might be nearing overbought.
DUST is about to break or test the upper line of downward wedge in 2 hour..
Yep, here’s how my daily DUST chart looks. We’ll see how it looks at the close.
Once DUST breaks above gold shall move down to 1181 target.
DUST/NUGT: You get a whip I get a saw, honi – lol
Among the many ‘talkers’, you are honest and straight talking. no boasting and readily admit weaknesses which is actually your strength. May you and beloved being bless with abundance of love, health and wealth. Congratulations!
p.s do you really need cmt approval anyway?
GDX – Still no conclusive breakdown but resistance is still in control.
HUI did break down today with next support ~170. An interesting H&S could be setting up with a fall to neckline.
Still a little early but GDX bearish flag may have just broken down on the hourly.
looks like b or ii ended at the 38% retrace level
Start of Bull wave iii?
i guess not.
Captain Ewave expects a rally in gold. Not saying I agree.
http://www.gold-eagle.com/article/gold-ready-100-rally
Hi RAM: Just saw your message. My view – follow Lara’s analysis! But yeah, I am keeping it short with upside risk 1198-1200 with 1212 and 1215 on the outside. Generally Gold price is bearish and has mostly stayed below 100dma (1209-10) not being able to sustain above there…. For today’s trade, a break below 1185/84 (basically break below 50% retrace of 1224/1142) and then 1175 is required…. With the lower band at 1178, I’d watch the downside and consider taking money off the table there although Gold price may go deeper depending on which wave count is in play…. There is a lot of uncertainty surrounding which direction Gold price is headed; I favour the bearish scenario and would look to consider switching to the long side should 1215 be taken out with conviction; don’t see that happening in a hurry though but anything is possible!…. 🙂
Thanks Syed, Always good to hear your point of view
The trend channels on both hourly wave counts have been breached and the very short term invalidation points on the bull hourly wave count have been breached.
I’ll attach two updated hourly wave counts. For both the channels are drawn using Elliott’s techniques.
Both counts expect some downwards movement from here. The bull count for it to end most likely at 1,181 and the bear count for a strong third wave to begin now.
For the bear hourly chart subminuette wave c is close to 0.618 the length of subminuette wave a.
Thank you to researchstockmarket for your idea on how to see this upwards movement as a five. There is a nice Fibonacci ratio of 0.618 between subminuette waves v and iii for the bull hourly chart.
Good luck everyone. And thank you very much for your support.
Lara, thanks for the “extra” update. It’s really appreciated when the invalidation points get hit.
Congratulations Lara !
Congratulations Lara on your achievement
Congratulations Lara!
Congratulations Lara!!!
🙂 🙂 🙂 🙂 🙂 🙂 🙂 🙂
You’ve gone from a highly skilled E.W. analyst, to opening
your own analysis business on the web, and now your CERTIFIED!! Level II I hear. Smart woman. As this market business grows you know the core is excellent guidence.
I’m so happy I picked a winner in you. I’m happy for you. Celebrate the good. Continue to give to others.
I’m not certified yet, I still need to pass level III.
I’ve never failed an exam yet, and I don’t intend for that record to be broken 🙂
Lara, my heartiest congratulationsto you for having passed the exam at the first try. You thoroughly deserved it. I have found that you are the most comprehensive, meticulous and cautious analyst in the world, and an honest one at that, ready to admit mistakes and move on from there. Your energy, dedication and enthusiasm for the pursuit of precision and timely analysis knows no peers. All of us who try our hand at analysis knows how difficult it is very to get the wave count right especially on the fly. It is a remarkable achievement.
Tham, very well said.
Thank you so much. I am humbled.
Hi Lara – I would like to share my wave count with you on a 30 min. time frame and take your opinion about it. Looks like the current move will take it close to 1201 to 1205 levels
Couple of points that I see are
1. 3rd wave is 223.6% of wave 1
2. wave 4 followed the alternation rule. Took comparatively more time to form when compared to wave 2
3. the final 5th wave looks to be in progress
Please let me know your thoughts about the same
It looks pretty good, meets all EW rules.
The alternation rule is that 4 and 2 should exhibit alternation in depth and structure, which may mean they differ in duration too (because some structures are more time consuming) but not necessarily.
It’s the proportion of 2 and 4 which give an impulse the “right look” at a higher time frame. If 2 and 4 are grossly disproportionate then an impulse will look like a three when it is a five at a higher time frame.
Congratulations Lara! As far as I’m concerned, you are already a PhD in Elliott Wave Analysis.
GLD near the top of the Sell on Strength list today.
Congratulations Lara on your achievement!!!
You are no doubt a great analyst and master of Elliott wave principles. You have grat fututre ahead of you in this field. You are the only one I know who supports clients and cares about providing timely accurate analysis.
Wish you good luck for achieving your higher goal in this field.
Love to be part of this team!!!
Congratulations Lara :-).
Thank you very much everyone. It’s a tough exam, 4 hours with 70% required for a pass. So I was really happy to pass first try yesterday. A great relief!
As my confidence grows as I learn and read more I’ll keep introducing a little more regular TA here and there.
Congratulations on passing the level II CMT exam!
Congratulations Lara!
Yes, Lara, congrats on passing the level II CMT! Your efforts to become an even stronger analyst are appreciated. I have confidence that you are going to help many members reach their financial goals…with a little help from a trending market which you will identify no doubt!
Bob B – I really like the sound of that. Best goal I heard in a while.
Congratulations Lara!
Sincere congratulations, Lara!
great job on your exam!
Congrats!
Congratulations Lara!
Lara a great congratulations on your passing yesterday, level II exam for CMT. That is a significant career milestone. One that can help both you and your clients. I’m very proud of you for your efforts, dedication and perseverance.