
A small inside day for Wednesday importantly shows higher volume. Volume consistently continues to support the bear Elliott wave count.
Summary: The bull and bear wave counts diverge. The bull count expects a third or C wave up to 1,237. The bear count expects a third wave down (very strong) to 1,081.
Click on charts to enlarge.
To see weekly charts for bull and bear wave counts go here.
Bull Wave Count
The bull wave count sees primary wave 5 and so cycle wave a a complete five wave impulse on the weekly chart. In order for members to judge for themselves I will list all points for and against for bull and bear wave counts.
Pros:
1. The size of the upwards move labelled here intermediate wave (A) looks right for a new bull trend at the weekly chart level.
2. The downwards wave labelled intermediate wave (B) looks best as a three.
3. The small breach of the channel about cycle wave a on the weekly chart would be the first indication that cycle wave a is over and cycle wave b has begun.
Cons:
1. Within intermediate wave (3) of primary wave 5 (now off to the left of this chart), to see this as a five wave impulse requires either gross disproportion and lack of alternation between minor waves 2 and 4 or a very rare running flat which does not subdivide well.
2. Intermediate wave (5) of primary wave 5 (now off to the left of the chart) has a count of seven which means either minor wave 3 or 5 looks like a three on the daily chart.
3. Expanding leading diagonals are are not very common (the contracting variety is more common).
4. Volume continues to not support this bull wave count. If a third wave up is beginning volume should show an increase, not a decrease. “When prices are rising volume decreasing is questionable.” (Kirkpactrick and Dahlquist)
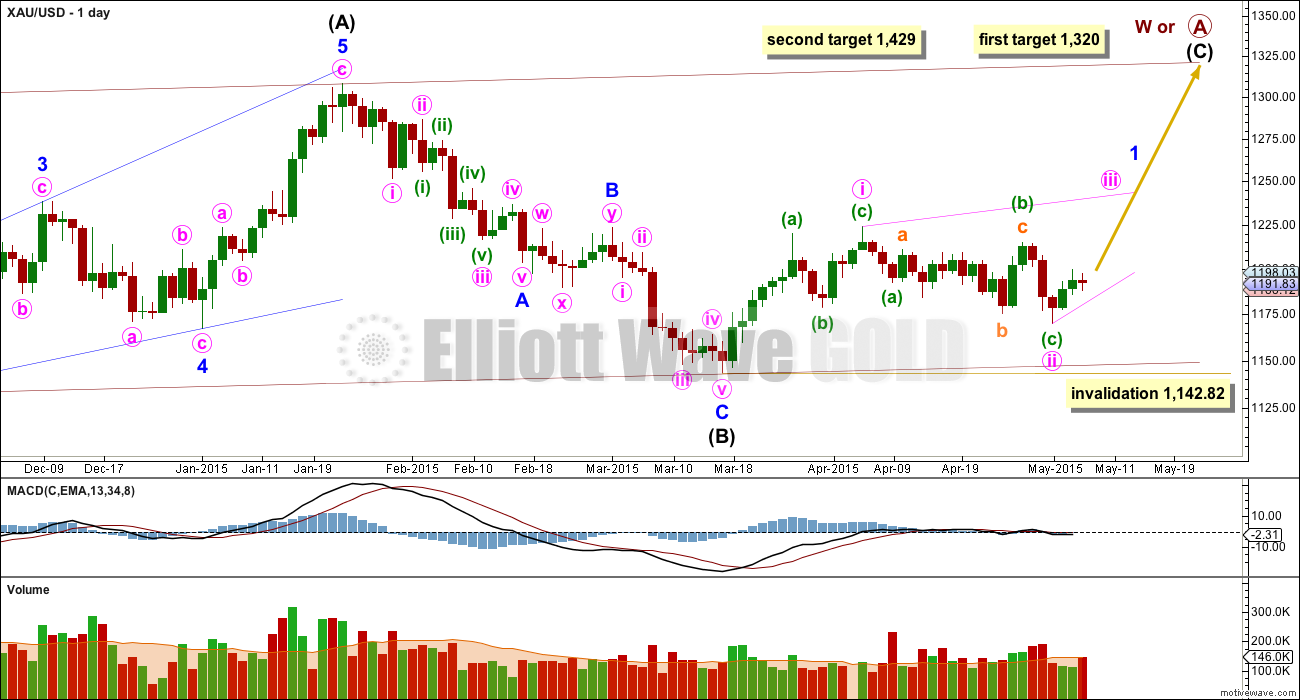
Within cycle wave b primary wave A may be either a three or a five wave structure. So far within cycle wave b there is a 5-3 and an incomplete 5 up. This may be intermediate waves (A)-(B)-(C) for a zigzag for primary wave A, or may also be intermediate waves (1)-(2)-(3) for an impulse for primary wave A.
Intermediate wave (A) subdivides only as a five. I cannot see a solution where this movement subdivides as a three and meets all Elliott wave rules. This means that intermediate wave (B) may not move beyond the start of intermediate wave (A) below 1,131.09. That is why 1,131.09 is final confirmation for the bear wave count at the daily and weekly chart level.
Intermediate wave (B) is a complete zigzag. Because intermediate wave (A) was a leading diagonal it is likely that intermediate wave (C) will subdivide as an impulse to exhibit structural alternation. If this intermediate wave up is intermediate wave (3) it may only subdivide as an impulse.
At 1,320 intermediate wave (C) would reach equality in length with intermediate wave (A), and would probably end at the upper edge of the maroon channel. At 1,429 intermediate wave (C) or (3) would reach 1.618 the length of intermediate wave (A) or (1). If this target is met it would most likely be by a third wave and intermediate wave (C) would most likely be subdividing as a five wave impulse.
It is possible that the intermediate degree movement up for the bull wave count is beginning with a leading diagonal in a first wave position for minor wave 1.
A leading diagonal must have second and fourth waves which subdivide as zigzags. The first, third and fifth waves are most commonly zigzags but sometimes they may be impulses.
Within diagonals the most common depth of the second and fourth waves is between 0.66 and 0.81. Minute wave ii is 0.67 of minute wave i.
Minute wave ii may not move beyond the start of minute wave i below 1,142.82.
Within the diagonal minute wave iii is most likely to subdivide as a zigzag, but it may also be an impulse. The bull wave count must look at both possible structures.
Minute wave iii must move beyond the end of minute wave i above 1,224.35.
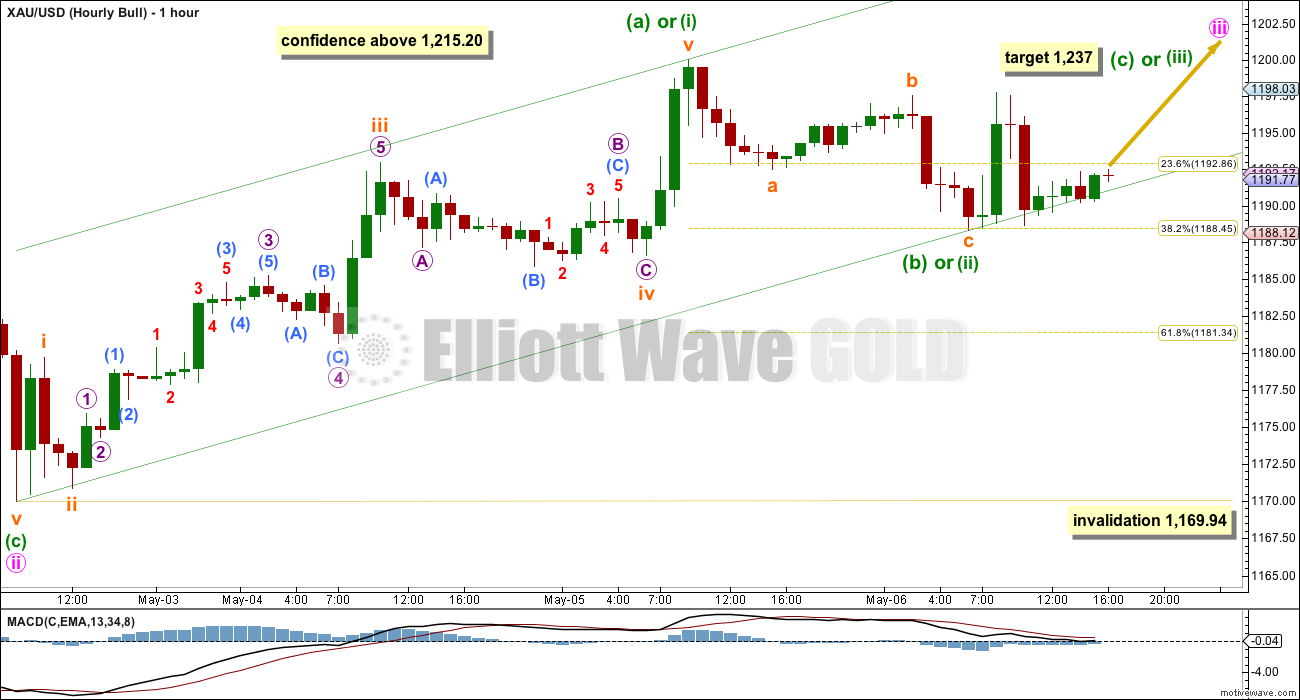
The key difference between bull and bear wave counts at the hourly chart level today is the upwards wave labelled here minuette wave (a) or (i). The bull count must see this as a five, the bear count sees it as a three.
Ratios within minuette wave (a) or (i) are: there is no Fibonacci ratio between subminuette waves iii and i, and subminuette wave v is just 0.25 short of 0.618 the length of subminuette wave iii.
Ratios within subminuette wave iii are: there is no Fibonacci ratio between micro waves 3 and 1, an micro wave 5 is 0.78 short of 2.618 the length of micro wave 1.
If this movement is seen as a five up it suffers from two problems of disproportion. Subminuette wave iv is 9.5 times the duration of subminuette wave ii giving this move a three wave look, not a five. Within subminuette wave iii also micro wave 4 is 5 times the duration of micro wave 2 giving this movement too a three wave look.
The guideline of alternation suggests alternation between structure and depth of corrections. If one correction is a more time consuming type of structure it will necessarily be longer lasting, but the proportion between corrections should not be grossly dissimilar. Alternation does not suggest a big difference in time taken. It is the proportion between the second and fourth wave corrections within an impulse which give the impulse the “right look”. A five should look like a five, and a three should look like a three.
Minuette wave (b) or (ii) may be a complete three. Equally as likely the degree of labelling within minuette wave (b) or (ii) could be moved down one degree; this three may only be subminuette wave a or w of a double zigzag, double combination or a longer lasting flat correction. For this reason the invalidation point for the bull count must remain at 1,169.94. Minuette wave (b) or (ii) may not move beyond the start of minuette wave (a) or (i).
At 1,237 minuette wave (c) or (iii) would reach 1.618 the length of minuette wave (a) or (i). This target would take minute wave iii above the end of minute wave i and so meet that core Elliott wave rule.
Bear Wave Count
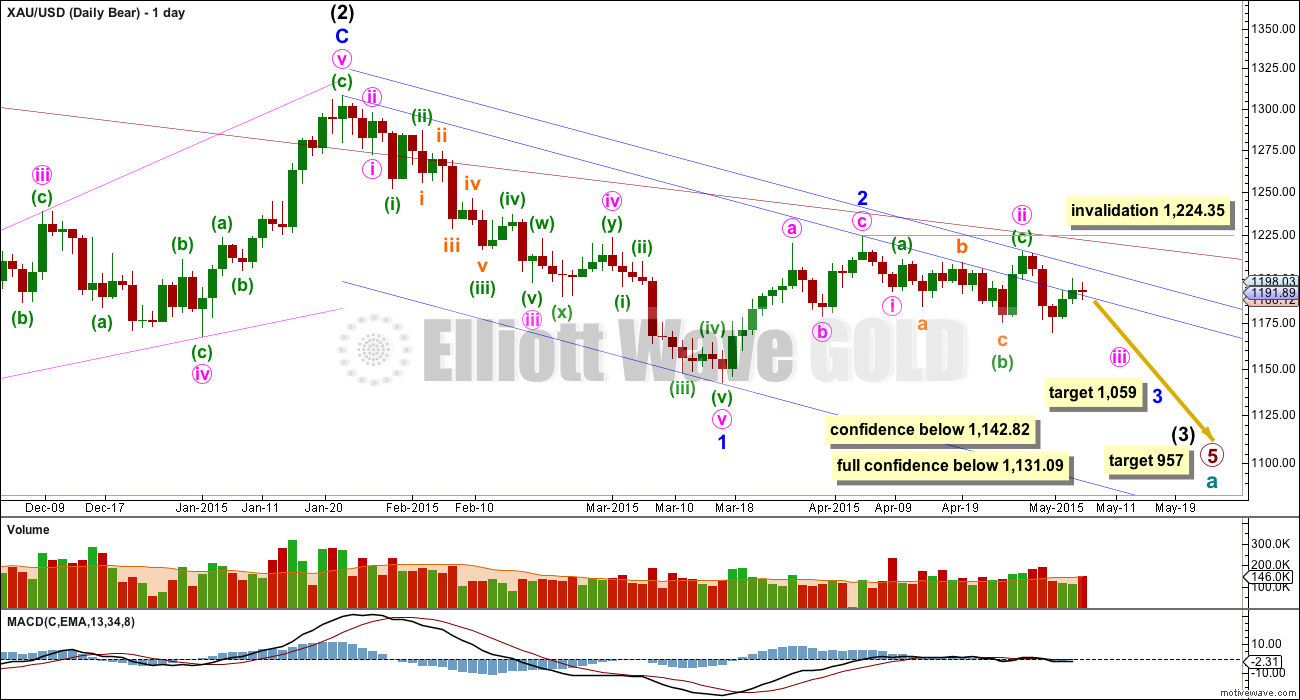
This wave count follows the bear weekly count which sees primary wave 5 within cycle wave a as incomplete. At 957 primary wave 5 would reach equality in length with primary wave 1.
Pros:
1. Intermediate wave (1) (to the left of this chart) subdivides perfectly as a five wave impulse with good Fibonacci ratios in price and time. There is perfect alternation and proportion between minor waves 2 and 4.
2. Intermediate wave (2) is a very common expanded flat correction. This sees minor wave C an ending expanding diagonal which is more common than a leading expanding diagonal.
3. Minor wave B within the expanded flat subdivides perfectly as a zigzag.
4. Volume consistently supports the idea that the trend is currently down.
Cons:
1. Intermediate wave (2) looks too big on the weekly chart.
2. Intermediate wave (2) has breached the channel from the weekly chart which contains cycle wave a.
3. Minute wave ii (the last high) breaches a base channel about the first and second wave one degree higher, minor waves 1 and 2. It is deeper and longer lasting than normal for a low degree second wave within a third wave one and two degrees higher.
4. Within minor wave 1 down there is gross disproportion between minute waves iv and ii: minute wave iv is more than 13 times the duration of minute wave i, giving this downwards wave a three wave look.
This wave count now expects to see a strong increase in downwards momentum as a third wave unfolds. At 1,059 minor wave 3 would reach equality in length with minor wave 1, and both would be extended.
Within minor wave 3, if minute wave ii continues further as a double flat or combination then it may not move beyond the start of minute wave i above 1,224.35.
Draw a blue base channel about minor waves 1 and 2. Create a parallel copy and push it up to sit on the high of minute wave ii, then copy these trend lines over to the hourly chart. Look for upwards movement to find resistance at the upper blue trend line.
Although Wednesday’s session is within a narrow range volume is higher. The difference is clear, and this indicates the bears are more active. Volume supports a downward breakout as more likely than upward.
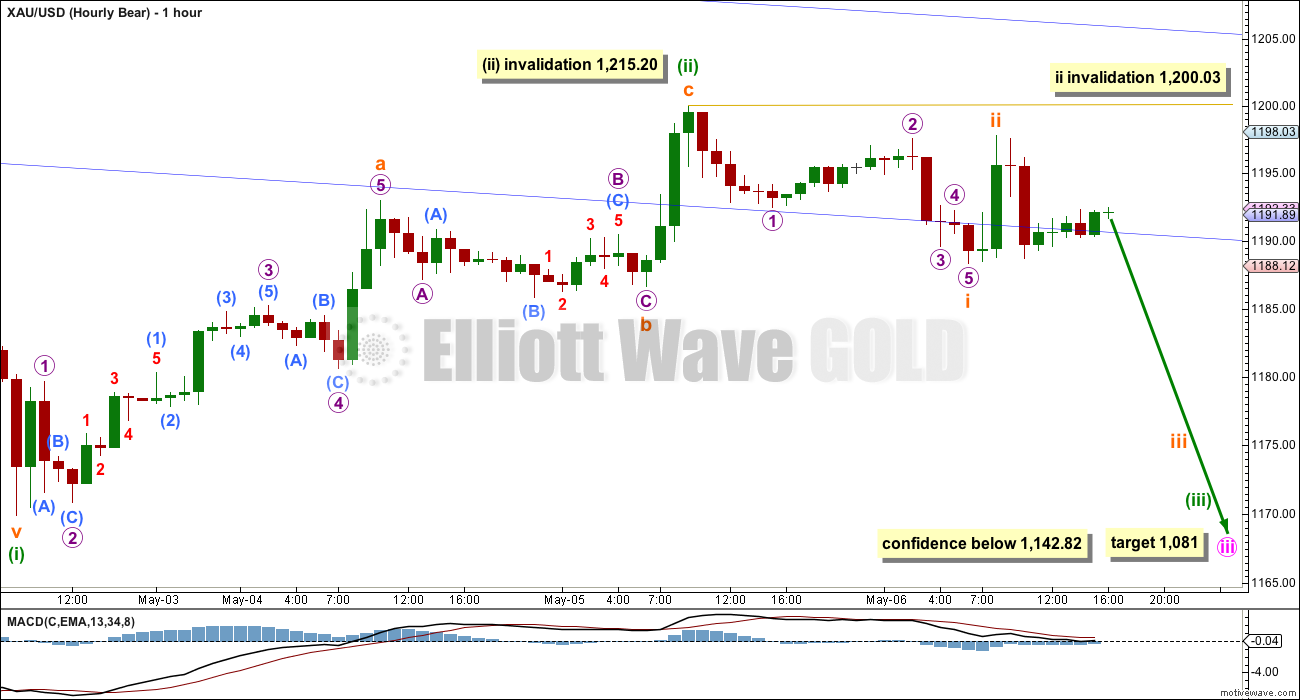
Minuette wave (ii) is most likely complete as a single zigzag.
The problem of proportion which the bull wave count has on the hourly chart is resolved. This movement looks better as a three than a five.
Subminuette wave c is 0.81 short of 0.618 the length of subminuette wave a.
Ratios within subminuette wave a are: micro wave 3 is 1.41 short of 1.618 the length of micro wave 1, and there is no Fibonacci ratio between micro waves 5 and either of 3 or 1.
Within subminuette wave a micro wave 4 is 2.5 times the duration of micro wave 1. The proportion is better giving subminuette wave a a reasonable five wave look.
If minuette wave (ii) is over then a third wave at five degrees may be just beginning. This would expect a big increase in downward momentum to develop over the next week.
The target for minute wave iii remains the same at 1,081 where it would reach 4.236 the length of minute wave i. I am using this Fibonacci ratio in this instance because minute wave i was so short and it fits nicely with the lower target for minor wave 3 at 1,059. Minute wave i so far has lasted six days. If it continues for a further seven days it may end in a total Fibonacci thirteen days.
Copy the blue trend lines over to the hourly chart. If the invalidation point at 1,200.03 is breached then minuette wave (ii) would be continuing higher, as a double zigzag most likely. It would then be expected to find resistance at the upper blue line.
If minuette wave (ii) is over (most likely) then submineutte wave ii within it may not move beyond the start of submineutte wave i above 1,200.03.
This analysis is published about 04:50 p.m. EST.
U.S. economy is hazy ahead of April jobs report
http://www.sltrib.com/home/2488163-155/us-economy-is-hazy-ahead-of
Don’t forget NFP day tomorrow. Gold usually is volatile after the release. Will the bear count prove to be correct tomorrow?
I think the trend may very well reveal itself after tomorrow’s release.
Place your bets. Anyone think gold goes up $30 tomorrow?
I wouldn’t count it
http://safehaven.com/article/37565/gold-and-the-us-employment-report
Very cool chart! Thanks will have a look
That table would scare most people… Basically screams ‘Volatility!’
My short term target for the final small fifth wave down is 1,177
For the very short term it looks like a small fifth wave down may need to complete for both bull and bear wave counts at the hourly chart level. Thereafter the bull count expects upwards movement to above 1,224.35 and the bear count expects a small fourth wave correction.
At that stage the very short term price point which will differentiate them at the hourly chart level would be 1,192.49; the bear count sees a fourth wave correction which cannot move back into its first wave price territory above 1,192.49, and the bull count would expect new highs well above this point.
Can you Please Please Please help out here — I got locked out by mistake. Can’t load your 5-7-15 analysis. Anyone?
I just bought DUST at $14.24 at 1:30 pm. A small position due to Friday am US non-farm payroll. Hopefully that and Lara’s comment and analysis are all bearish. If so I will buy more Friday buy not too much due to a weekend then adjust position Monday. I sure would like Lara’s about 7 days or perhaps sessions to 1,081 to manifest for all the gold bears. Lara’s analysis & video are sure sounding more bearish to me, however she still wants price confirmation to lead the way.
Now as per the GDX chart below, yes I would like GDX to test support at $18.11.
Your’e right Richard, I’d like to prefer that bear wave count, but then I remember to not get too confident while price has not confirmed. I’ve made that mistake before.
Volume is slightly lower today, but it’s still higher than the two prior up days. So volume continues to consistently support the bear wave count.
The trend line breach of On Balance Volume on the weekly chart is pretty strong now.
Ben’s Lockhart’s important May 6 GDX chart – bottom rail has already broke with low of 19.28, support is at 18.11 – 18.64
Author’s reply » GDX positive performance was keeping gold up, now it has lead gold down.. updated chart for you:
https://www.dropbox.com/s/48cfo6m96wrig39/GDX%20DAILY%20TECHS.png?dl=0
Interesting Richard – So are you expecting a test of 18.13 in GDX?
On the hourly GDX charts you can see that we filled one gap today but have two more below at $19 and $18.20.
Did Gold just hit a bottom at 1,182.28 at 10:45 am EST?
Do we continue rebound up from here and see how high Gold goes today to decide Bull or Bear, although the Bear has been showing more signs lately?
Friday 8:30 am US non-farm payroll & unemployment may clarify gold’s position even more.
Hi. Depending on the website, I have Gold price lows showing up as 1179.50, 1179 and 1178… It does not matter though, the drops have pretty much been curtailed by the lower band and Gold price bounce from the drop/s did not manage to get past the 1192.xx high; also Gold price bounce never really made it past 5/50/20dma…. Upside 1196-97 is seen as limiting with 1199-1200 probably already hammered in as interim top; upside risk still remains 1211-12/15….
Syed you are correct on today low at 8:33 am 1178.98. I should of clarified I was speaking of low since the open as looking for a high rebound to buy into DUST.
Have you bought DUST now – just touched $14.22 – which is frustrating for holders but may be good for buyers…
Thanks I watched for it to come around again and got 14.24.
Nice bullish flag setting up on the DUST 15-min charts post-breakout. Needs a little to wind up…probably tomorrow. Structure is bullish.
Bigger picture, we need a monthly GDX close below the red line to confirm that a bigger move down is underway. Channel has been very reliable resistance.
DUST 2 hour channel update from yesterday== BO with gap.
Target price anyone?
DUST will have some near term resistance at $15.
Longer term, this chart still shows my take.
History doesn’t repeat itself, but it does rhyme. The difference between now and late Feb was the overhead gap that needed to get backfilled this time.
GG appears to be one of the first GDX components breaking down from a possible H&S pattern. It led the index on the flag breakdown too on 4/30.
We should get a decisive breakout from JDST today.
Meanwhile, bigger picture….you can see how far JNUG may have to fall before finding longer term support.
As the markets are being hammered today and gold also down, is anyone expecting miners to get a double hit?
Could be a good day to be short regardless of small gold movements upwards.
Are you still holding those DUST/JDST positions from last week?
Yes – £250,000 bought, was £40,000 down but rapidly back up to break even.
Unsure whether to continue holding for what might be a parabolic move…
wow, how much percent of your bankroll is this you are betting right now? probably you are a multi millionaire with more than 250 million. could you donate me some money cause i am very poor. smart but poor. im fighting for evry 100 euro. A bit more money would open more and better chances to trade. i m young and in 3 weeks i ll become father cause my girlfriend is not good in mathematics. so if you are a good guy you could help me a lot. im a good trader no worries. i would increase my capital to trade with. of course not i would spend it for nonsense. it seems you have more money than you need or ever could spend. my life is very hard and i m happy when i can eat healthy. i would jump on the ceiling for happiness if all my assets would be as valuable as one bet by yours.
You must be very sure or very brave or both? A bearish 7 days or sessions to 1,081 could have you buying the rounds!
I was speaking with a world class gold trader last night and he is saying gold is in a major consolidation and when the TTM-Squeeze indicator fires he expects the breakout to be to the down side to 1081.
He will give me the alert when it begins and I’ll load up the truck for the multi-day drop.
Comment deleted dagobertduck, please read the comment guidelines. Thank you.
no problem Lara,
it was a joke. i think nobody wants to know how much money this guy is trading.
Well we will be waiting for your alert!!!!
Thanks in advance.
At this stage with Gold price having made a 1180xx low and 1182-81 holding, I would not now expect Gold price to get past 1190-96 on the rise…
Gold just made the target low at 1180.92 and is bouncing.
From the look of the structure does it look like the bull wave to begin now??
OR bear wave continues to Lara’s target of 1081 in next 7 days???
From chart pattern bears are in control.
Tham,
It appears that subminuette i was at 1188.12 and subminuette ii was at 1198.03. Was 1198.03 the rebound point for safest trade into DUST or did that all change when gold didn’t hit the 1181 target? Gold just dropped $5 in 30 minutes down to 1,184 at 2:54 am EST. It started to drop when it was announced the ECB raises ceiling on Greek emergency loans again. Things are growing increasingly bearish. Lara even estimates about 7 days to 1081.
Hi Richard, just signed in.
First off, the drop below 1188.12 negated the current bull count. It has to be an A-B-C (or W-X-Y) correction for minuette 2 that I posted yesterday. It seemed to have slowed down at 1180.92 just now. So, (1) if it drops further, it cannot go below 1169.94 or the bull is slaughtered, or (2) if it rises around here, then it is still in play, but THE RISE HAS TO GO ABOVE 1200.
For the bear count, Lara’s bear count may be correct, but it looks pretty contorted now with the drop. I calculated that there needs to be very strong drops in the wave 3s of minuette and subminuette degrees, something like 4.236, in order to reach 1081. One other alternative for a less strong drop would be to move the minuette 3 counts one degree lower. We’ll wait for Lara to look at this with additional information unfolding. Now, if either of these counts is correct, then PRICE CANNOT RISE ABOVE 1198.03. In fact, with the current strong momentum, price may not even approach anywhere near that, hence the rebound will be very small.
So, the magnitude of the rise would give a good clue as to which wave count is going to play out. Then, we can safely trade accordingly.
A VIEW / SENTIMENT: With a narrow trade range and an inside day to boot, one should really stand prepared for range expansion and a large impulse move / breakout to occur…. In the early going Gold price has moved away downward from its pivot and broken below Wednesday low – perhaps a clue of which way to expect Gold price to go. The downside remains a little bottomy though at 1180-79 and is of concern. Gold price has not really broken below 1185/83 with much conviction recently…. An upturn in MacdMA and bullish ROC / momentum seems to suggest a short term rally / upside move is likely…. It should get choppy out there and would remain to be seen if Gold price can really take out 1197/98-1211/12 range! My money is on the downside (with risk) as long as 1212-15 range is not broken above…. I guess all we go to do now is hear from Gold price itself and let it make its move!…. lol…. 🙂
GDXJ and GLD on the Buying on Weakness list today.
Duration target for wave 5 completion.
April 1oth : For alt bear wave count; “Primary wave 5 may last a total Fibonacci 55 weeks. It is now beginning its 39th week.”
As of this week now beginning 43rd week. To reach the target 12 more weeks +/- few weeks. That will put Jun-Jul for gold bottom. Hmmmmm.
Gold has lot of waves to complete.