
Both bull and bear Elliott wave counts remain valid. Price has not yet told us which one is correct.
Summary: The bear wave count requires a very strong downwards move from here. A new low below 1,169.94 would provide some confidence that price is breaking out downwards, but to have a substantial level of confidence in the bear wave count a new low below 1,142.82 is required. The mid term target remains the same at 1,081, which may be met in five days or it may now need longer, maybe thirteen days. The bull wave count requires a new high above 1,200.03 for initial confidence.
Click on charts to enlarge.
To see weekly charts for bull and bear wave counts go here.
Bear Wave Count
I would judge this bear wave count to be about 60% likely.
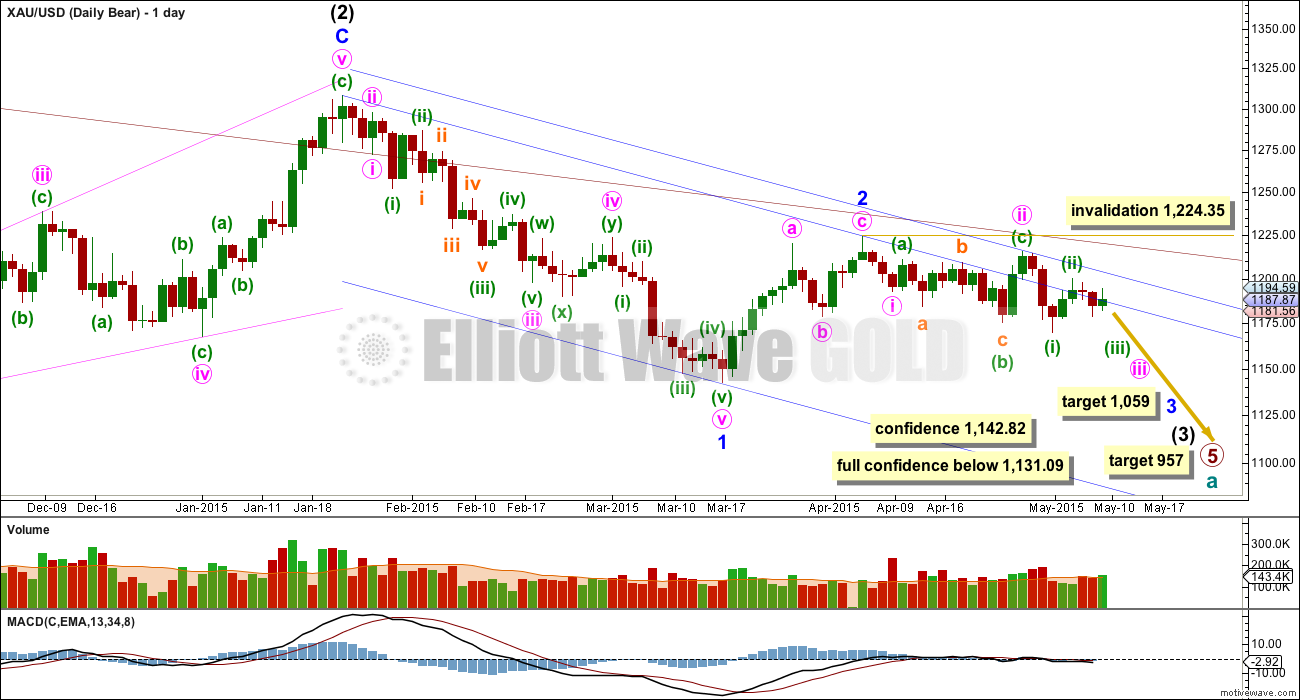
This wave count follows the bear weekly count which sees primary wave 5 within cycle wave a as incomplete. At 957 primary wave 5 would reach equality in length with primary wave 1.
Pros:
1. Intermediate wave (1) (to the left of this chart) subdivides perfectly as a five wave impulse with good Fibonacci ratios in price and time. There is perfect alternation and proportion between minor waves 2 and 4.
2. Intermediate wave (2) is a very common expanded flat correction. This sees minor wave C an ending expanding diagonal which is more common than a leading expanding diagonal.
3. Minor wave B within the expanded flat subdivides perfectly as a zigzag.
4. Volume consistently supports the idea that the trend is currently down.
Cons:
1. Intermediate wave (2) looks too big on the weekly chart.
2. Intermediate wave (2) has breached the channel from the weekly chart which contains cycle wave a.
3. Minute wave ii breaches a base channel about the first and second wave one degree higher, minor waves 1 and 2. It is deeper and longer lasting than normal for a low degree second wave within a third wave one and two degrees higher.
4. Within minor wave 1 down there is gross disproportion between minute waves iv and ii: minute wave iv is more than 13 times the duration of minute wave i, giving this downwards wave a three wave look.
This wave count now expects to see a strong increase in downwards momentum as a third wave unfolds. At 1,059 minor wave 3 would reach equality in length with minor wave 1, and both would be extended.
Within minor wave 3, if minute wave ii continues further as a double flat or combination then it may not move beyond the start of minute wave i above 1,224.35.
Draw a blue base channel about minor waves 1 and 2. Create a parallel copy and push it up to sit on the high of minute wave ii, then copy these trend lines over to the hourly chart. Look for upwards movement to find resistance at the blue trend lines.
Volume for Friday is slightly higher for an up day. Although volume is higher than the prior two down days, it is still not higher than the strong down day for 30th April, six days ago. This is a very small cause for concern with the bear wave count, but it is not clear enough to favour the bull wave count.
The bear wave count sees another first and second wave now complete. This gives a series of five overlapping first and second wave corrections. When third waves extend they do necessarily begin with a series of overlapping first and second waves, which convinces us that a third wave is not beginning right before it takes off. When this happens it is like a spring loaded with potential energy. When the energy is released the movement can be explosive.
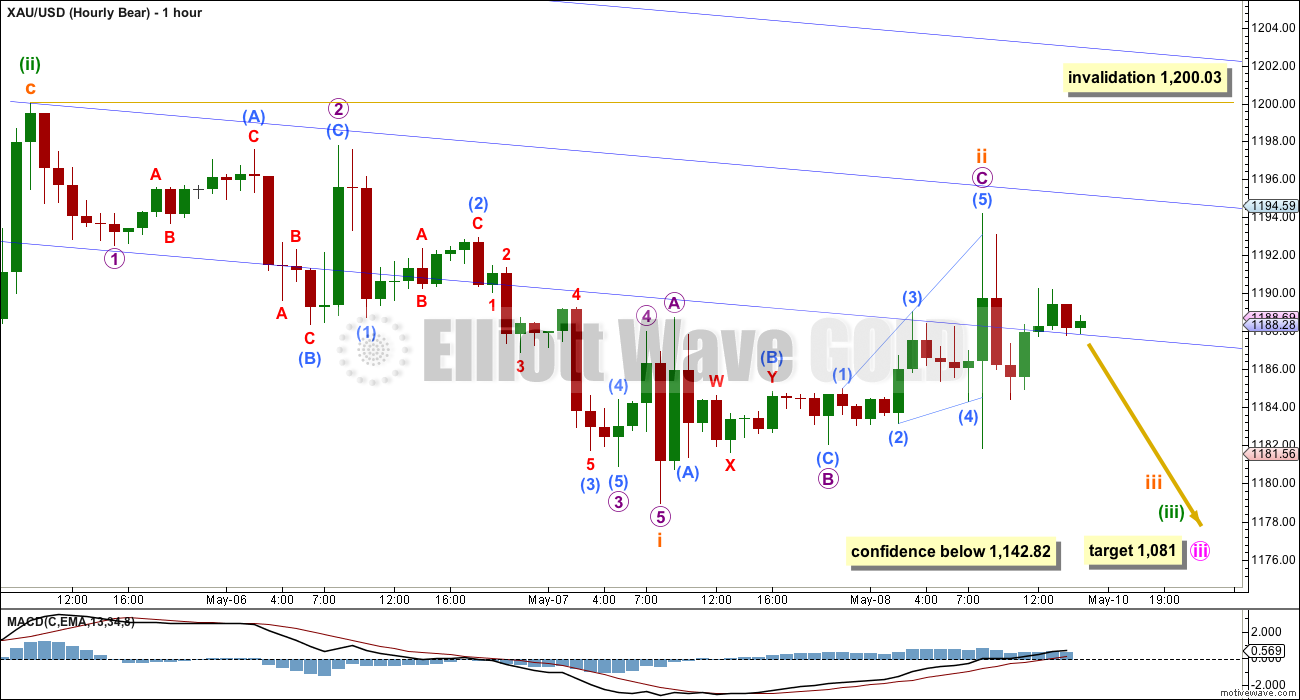
Gold continues to make lower highs, although it is not making lower lows for the last few days.
Subminuette wave ii subdivides reasonably well as a three wave zigzag correcting to just above the 0.618 Fibonacci ratio. It is extremely likely to be over here.
A third parallel copy of the upper blue trend line from the daily chart shows where minuette wave (ii) and now subminuette wave ii have found resistance. I expect any further corrections to find resistance at this trend line.
Interestingly, minuette wave (iii) would reach 2.618 the length of minuette wave (i) at 1,081 and minute wave iii would reach 4.236 the length of minute wave i also at 1,081. This mid term target may be met in another five days if minute wave iii totals a Fibonacci thirteen days / sessions. It may be able to do this if the fifth wave within it is fast and strong, and the fourth wave corrections are less time consuming than these second wave corrections have been. But if it requires more time then the next Fibonacci number in the sequence is twenty one which would require a further thirteen days to the target.
Subminuette wave ii may not move beyond the start of subminuette wave i above 1,200.03.
I would have some further confidence with a new low below 1,169.94 in this bear wave count. It does still require a new low below 1,142.82 before a reasonable amount of confidence can be had in it.
Bull Wave Count
I would judge this bull wave count to be about 40% likely.
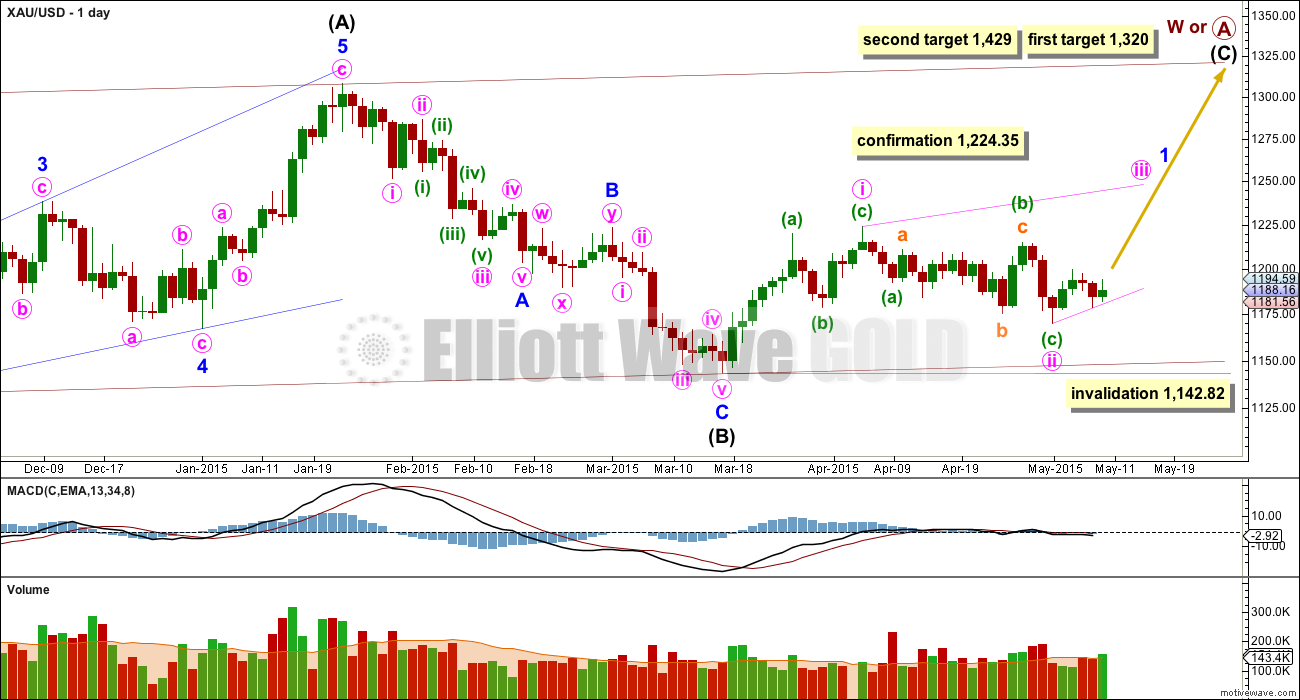
The bull wave count sees primary wave 5 and so cycle wave a a complete five wave impulse on the weekly chart. In order for members to judge for themselves I will list all points for and against for bull and bear wave counts.
Pros:
1. The size of the upwards move labelled here intermediate wave (A) looks right for a new bull trend at the weekly chart level.
2. The downwards wave labelled intermediate wave (B) looks best as a three.
3. The small breach of the channel about cycle wave a on the weekly chart would be the first indication that cycle wave a is over and cycle wave b has begun.
Cons:
1. Within intermediate wave (3) of primary wave 5 (now off to the left of this chart), to see this as a five wave impulse requires either gross disproportion and lack of alternation between minor waves 2 and 4 or a very rare running flat which does not subdivide well.
2. Intermediate wave (5) of primary wave 5 (now off to the left of the chart) has a count of seven which means either minor wave 3 or 5 looks like a three on the daily chart.
3. Expanding leading diagonals are are not very common (the contracting variety is more common).
Volume shows a small increase for an up day, but for volume to support the bull wave count it needs to show an increase beyond that for 30th April, six days ago. While up day volume is lower than 187.8K the bear wave count will be favoured.
Within cycle wave b primary wave A may be either a three or a five wave structure. So far within cycle wave b there is a 5-3 and an incomplete 5 up. This may be intermediate waves (A)-(B)-(C) for a zigzag for primary wave A, or may also be intermediate waves (1)-(2)-(3) for an impulse for primary wave A.
Intermediate wave (A) subdivides only as a five. I cannot see a solution where this movement subdivides as a three and meets all Elliott wave rules (with the sole exception of a very rare triple zigzag which does not look right). This means that intermediate wave (B) may not move beyond the start of intermediate wave (A) below 1,131.09. That is why 1,131.09 is final confirmation for the bear wave count at the daily and weekly chart level.
Intermediate wave (B) is a complete zigzag. Because intermediate wave (A) was a leading diagonal it is likely that intermediate wave (C) will subdivide as an impulse to exhibit structural alternation. If this intermediate wave up is intermediate wave (3) it may only subdivide as an impulse.
At 1,320 intermediate wave (C) would reach equality in length with intermediate wave (A), and would probably end at the upper edge of the maroon channel. At 1,429 intermediate wave (C) or (3) would reach 1.618 the length of intermediate wave (A) or (1). If this target is met it would most likely be by a third wave and intermediate wave (C) would most likely be subdividing as a five wave impulse.
It is possible that the intermediate degree movement up for the bull wave count is beginning with a leading diagonal in a first wave position for minor wave 1.
A leading diagonal must have second and fourth waves which subdivide as zigzags. The first, third and fifth waves are most commonly zigzags but sometimes they may be impulses.
Within diagonals the most common depth of the second and fourth waves is between 0.66 and 0.81. Minute wave ii is 0.67 of minute wave i.
Minute wave ii may not move beyond the start of minute wave i below 1,142.82.
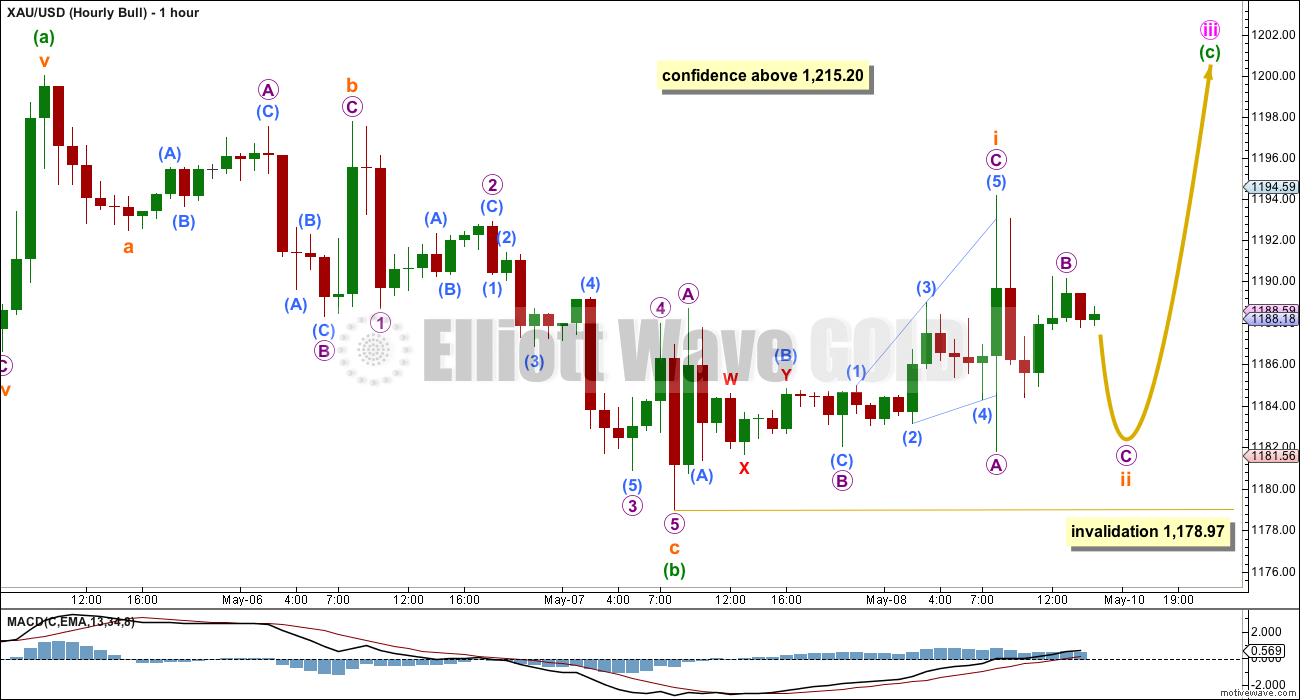
I have tried to see if the upwards movement labelled subminuette wave 1 can subdivide as a five and it will not. It only fits as a three.
Minute wave iii within the larger leading diagonal for minor wave 1 (as on the daily chart) may be either a zigzag or an impulse. It is most likely to be a zigzag.
If this upwards movement is a three it may be subminuette wave i within an ending diagonal for minuette wave (c), and so minute wave iii is unfolding as a zigzag.
Within the ending diagonal of minuette wave (c) subminuette wave i is a complete zigzag and subminuette wave ii is incomplete. It is most likely to correct to between 0.66 to 0.81 of subminuette wave i between 1,184 to 1,182. So far it has reached a little lower than this and the structure is incomplete. Micro wave C is likely to make at least a slight new low below the end of micro wave A at 1,181.80 to avoid a truncation.
Subminuette wave ii may not move beyond the start of subminuette wave i below 1,178.97.
If 1,178.97 is breached then the bull wave count would see minuette wave (ii) continuing lower. The invalidation point for that is at 1,169.94.
If 1,169.94 is breached the bull wave count would further reduce in probability. It would only reduce substantially in probability with a new low below 1,142.82.
This analysis is published about 04:34 p.m. EST.
Just doesnt have the feel of the start of a III down
Important update to 5-8-15 analysis is out!!
Important update to 5-8-15 analysis is out!
Annoying Gold – http://www.gunner24.com/newsletter-archive/may-2015/10052015/
May high 1220 – 1240 then October low 1,100 – 950
I’m looking to sell DUST between 1180.10 as per Tham or 1177 as per Lara – “In the very short term one final small fifth wave
down to 1,177 would complete an impulse for both wave counts at the hourly
chart level. Thereafter, they again diverge. The bear count then expects a
fourth wave correction which may not move into first wave price territory above
1,195.49. The bull wave count expects new highs.”
SENTIMENT: For Mondays trade Gold price is bottomy and may not dip much below its pivot 1187 and seems to be straddling 50% retracement of 1224/1142 as support with downside risk 1177-76, upside move / short term rally is expecting to possibly rise through 1190-93 with 1196-97 on the outside….
Another Bearish perspective: https://www.youtube.com/watch?feature=player_detailpage&v=woc-nNZFv-s#t=972
Gold @ 16:12 GDX @ 18:23
A VIEW: I am not too sure if I would get too excited about Gold price downside in a hurry just yet; one just has to be patient…. The Gold price structure remains inconclusive for either the upside or the downside and has given us its share of false breaks…. Gold price made 3 new highs and 4 new lows during the last one month – just goes to show how unpredictable trading this has been…. The April H 1224.50 / L 1168.40 range is yet been taken out; maybe Gold price is in a compression triangle of sorts and continued sideways choppy overlapping price activity may be seen…. For how long? On a weekly outlook basis, Gold price remains bearish but bottomy (dang); short term up move / rally is expecting…. Remains to be seen how much purchase the rally/s brings to the table…. I would continue to look to keep it short though (upside risk notwithstanding). //// Treasury yields are expected to continue to rise, that will likely take the USDI up with it pushing Gold price down…. Gold price at CMP 1187 is almost back to where it started on Jan 1, 2015, the high for the year 2015 has been $1308 with a low of $1142 and the upside is slowly being left behind as Gold price grinds lower lol…. 🙂
Richard
Let us stay on the subject: What is the frame of the indicator/s for which his software is designed around?
Not asking formula just the indicators being used or a new one invented.
It is great Deep Voice has success rate better than other traders.
He must have backtested his trading platform.
Thanks.
It is the ultimate overbought/oversold indicator.
No idea, “frame of the indicator/s for which his software is designed around?
and what the most people in here still dont understand by analysing COT
‘s is the fact that Gold ‘s manipulation is over the physical market the
most part.
It is a good indication for an end of a rally to watch
what the banks are doing over the futuremarket but this little cover we
seeing now in gold is completely insigificant even more if you look at
Silver ‘s COT ‘s.
im not that bearish for gold in the short term
cause of that little cover by the banks. im not that bearish cause the spec ‘s
longposition is too small.
Here are some numbers:
Gold Comm S: 299017 -18K
Spec’s L: 177256 -20K
Silver Comm S: 126347
Specs L: 63161
How is these numbers help trade any one???
Yes at the extreme top or bottom COT report helps what to come like in Jan when gold topped at 1307 and comm were short highest amount of contracts: 422000.
market experienced the result of that.
Yes some may trade using cot everyday then there are some traders trade commodity using Basis (contango/backwardation/GOFO). I believe those are short term trades
Like to learn from you how do you trade using COT/
Thanks.
the only reason why i use COT-data is the manipulation. this is the only reason why i can be that accurate.
“Yes at the extreme top or bottom COT report helps what to come like in
Jan when gold topped at 1307 and comm were short highest amount of
contracts: 422000.”
you will never hit a top with this statement.
only watching commercials compared to specs or even alone is senceless and useless for trading. you will never be able to identify the top cause the highs are allways different.
you cant say xxxxxxxx contracts by commercials will be the top. not really!
it only gives you a broad overview about sentiment nothing else.
the significannce is the pricechange relatively to positionchange at futuremarket and the behavior of some banks.
very important to understand too is that watching gold anlone is even senceless as useless.
you have to watch gold and silver cause this markets are different and cosequently the manipulation is different. for a trendchange to the upside both datas have to look good not only Gold
we will never have a big rise in gold when JP Morgan is 50 days short of worldproduction in Silver perspectively the big 8 some around 80 days and therefore this little coverage we saw in gold has no sigificance even more when you understand that the manipulation in gold is over the physical market the most part and only on significant chart levels or at the end of a rally some banks rise their positions.
also we will never have a big drop with this kind of low long position by the specs in Gold.
for that reason Laras counts still wrong even if im said to say this
if there will be no exogenous event we very likely will have another sideways/upwardphase to get some longspeculators into gold probably a false breakout to the upside with a target around 1240 or 1250.
Silver could see 18 dollars.
so overall a slight rise is the most likely scenario for now for the next weeks.
dagobert, this is off topic, but just curious…..
how is it that your name is not a hyperlink on the page like the rest of us? How did you do that?
cause im mr rothschild 😉
Gold’s price objective 850 by Oct 2015.
Below is weekly chart of gold basically a chartology using breakouts and past impulse wave amount and duration to come to PO.
Rambus is basically using EW techniques. the first drop in 2013 wave 3 amount and duration projecting it to current EW count to wave 5 from beginning from int wave 2 at 1307.
Richard
You have increased my curiosity on this ” the accurate custom indicator”.
I have been searching for this magic indicator all my life.
Can you ask him to describe it? Does not have to be combination but ingredients will suffice.
One magic indicator i have come upon is the TSI in different time frame. but it is s short term. Sold DUST near top 14+ and bot back at bottom before close using this indicator.
Of course using EW count as major trend in mind I trade only in direction of major trend. Surprises are always in the direction of major trend.
Ask him share the name or combination of indicators being used.
EW does have value. It may not be for shrt term trade but long term it has great value.
The top trader with the accurate custom indicator. He just told me he sold all his bullish gold ETFs at the close, GDX and GDXJ are no longer going up, just has cash and will go bearish next week.
Really~~~! This a for real top trader, you’re not just wetting our appetite? I believe you so Thank you for that big piece of info.
But “the accurate custom indicator” come on
Figure he had hundreds of thousands in JDST and DUST on Wednesday. The guy’s indicator he had his software company work on and cost hundreds of thousands of hours and dollars to develop what I believe is the most accurate indicator in the world. He makes a ton of money with it. It is his own money tree. He doesn’t use any other T/A and doesn’t even believe in EW. His monthly rates of return are astounding. He bought and sold JNUG and NUGT twice for big profits Friday. Sometimes he flips in 10 minutes like at Friday am US non-farm payroll news release. I don’t have time to post made up comments. It doesn’t matter to me whether anyone beliefs this too good to be true tales of success. However I’m glad he’s out of bullish and will switch to bearish next week. I asked if I could buy a copy of the software and he said it isn’t ready for public release. So I just take whatever tips or success stories he tells me and totally believe him. Even if I expect most not to.
I have had a very diversified life and seen, heard and done many things that 99% of the public would not believe. I accept the non-believers beliefs are based on their perceptions based on their realities. Think about it, the majority of traders don’t believe in EW. So what!
Hey, not mad at ya. I’m glad you’ve expanded on this indicator and your friend’s success.
…99% of the public, well now you’ve gone and peeked my curiosity
at first I thought EW was “just another tool” till I started looking into it more.
Again, thanks for this valuable piece of info.
I started doing this process 4 years ago and this Tuesday will repeat all his courses on-line for results in minutes in person or at even miles away. I have done 85 documented Miracles.
http://www.kinslowsystem.com/
http://www.amazon.com/s/ref=nb_sb_noss_2?url=search-alias%3Dstripbooks&field-keywords=Frank+kinslow&rh=n%3A283155%2Ck%3AFrank+kinslow
Thanks for passing on that bit of info. Would like to say thank you in advance for passing on any other news you get from him. I make my own decisions, but I like to consider all I can before taking action.
This is after all, real money. My retirement money.
I think he should be called “Deep Voice” from now on. So Deep Voice is in cash and will go short next week?????? Hmmmm
Lara has just expected the same.
Yes, Deep Voice is a good name. 🙂
In yesterday’s post you had wrote that the trader went bullish buying NUG/JNUG and long PM.
If you are short that is good news. Being in cash is good thing. Time to back up the truck yet!!!
Lara: Great report again.
You mentioned higher day volume for today is concern.
If you look at the weekly volume for this week ending today is much lower than past several weeks.
Last week’s down volume on weekly basis was much higher for a red candle.
Yes, true.
It’s only a slight concern really. The bull count really would require a stronger up day than that to be favoured.
Lara, thanks for being Amazing!!!!
i still predict some more weeks of trendless sideways movement or a slight rise before the next drop will start. Silver ‘s COT is too bad for a mid term rise and Gold ‘s data is too good for a big drop. We still in the same position, nothing changed….
why it must always go up or down? Is it a weakness of elliottwave-theory to identify a sideways phase? if we dont get an exogenously event we will need more specs going long before we can have a drop. probalby we have to breakout to the upside to get some. im sure the banks will replace their shorts which they were covering for now.